Prevent Availability Risks and Optimize Db2 Performance
The volume and complexity of Db2 Statistics data and Db2 Accounting data creates a major challenge for analysts who want to derive value from the rich metrics available.
Easy visibility into key Db2 metrics through SMF records is crucial to proactively prevent availability risks and to effectively manage and optimize performance.

Comprehensive Solutions to Your Db2 Performance Management Issues
Quickly Troubleshoot Db2 Performance Issues
Reduce Mean Time To Resolution for unpredictable problems.
Key Features
Automated alerts and intuitive drill downs ensure that when performance or availability issues occur, the root cause is quickly identified and resolved before end-users are impacted or resources wasted.
Discover potential issues before they occur with automated site assessments and easily resolve them
Discover potential issues before they occur with automated site assessments and easily resolve them
Tune and Optimize Db2 Performance
Tune and optimize your Db2 performance for maximum efficiency.
Key Features
Built-in AI-based health and performance insights and recommendations guide you towards sub-optimal areas impacting performance and availability and provide an intuitive and easy way to resolve and optimize your Db2 environment.
Comprehensive pre-built reports provide day-one access to tuning recommendations and overall site health.
Comprehensive pre-built reports provide day-one access to tuning recommendations and overall site health.
Extensive Report-Customization and Integrations
Easily integrate data from different sources and customize reports.
Key Features
Integrating data, such as from CICS, IFCID 199, or other SMF sources provides insights Db2 data alone cannot. Utilize built-in report customization and data integrations to take full control of your data and provide answers to any of your questions.
Edit, expand, and customize reports with built-in options to add sources, hone in on specific data, view data in different ways, and more.
Edit, expand, and customize reports with built-in options to add sources, hone in on specific data, view data in different ways, and more.
Identify Db2 Performance Trends and Anomalies
Gain elevated insights and predictability with trending and anomaly detection.
Key Features
AI-based anomaly detection alerts you to significant changes based on your specific baselines so issues that cannot be detected due to normal performance constraints are immediately found.
Trending and compare features provide critical before/after views and help you understand performance and resource utilization trends of your Db2 servers.
Trending and compare features provide critical before/after views and help you understand performance and resource utilization trends of your Db2 servers.
Monitor Db2 Performance and Proactively Prevent Availability Risks
The volume and complexity of Db2 Statistics data (SMF 100) and Db2 Accounting data (SMF 101) data creates a major challenge for analysts who want to derive value from the rich metrics available there. Easy visibility into key Db2 metrics through SMF records is crucial to proactively prevent availability risks and to effectively manage and optimize performance.
IntelliMagic Vision automatically assesses every Db2 member (and even every buffer pool when applicable) to proactively identify potential availability risks in your environment and direct you to important issues that may warrant your attention.
In addition, the intuitive user interface and dynamic context-sensitive drilldowns available throughout IntelliMagic Vision facilitate types of analysis that are not feasible with static reporting solutions, enabling you to:
- Immediately drilldown on a specific subset of data based on observations from the current view
- Pursue one line of analysis, and if that ends up being unfruitful, quickly pursue another hypothesis with minimal wasted time and effort
- Seamlessly navigate to focus your analysis in a manner that insulates you from the fact you are dealing with massive quantities of underlying SMF data
IntelliMagic Vision offers you the out-of-the-box visibility and intuitive navigation to manage every component of your z Systems infrastructure under a single solution, facilitating collaboration across teams that have historically been isolated by siloed tool sets.
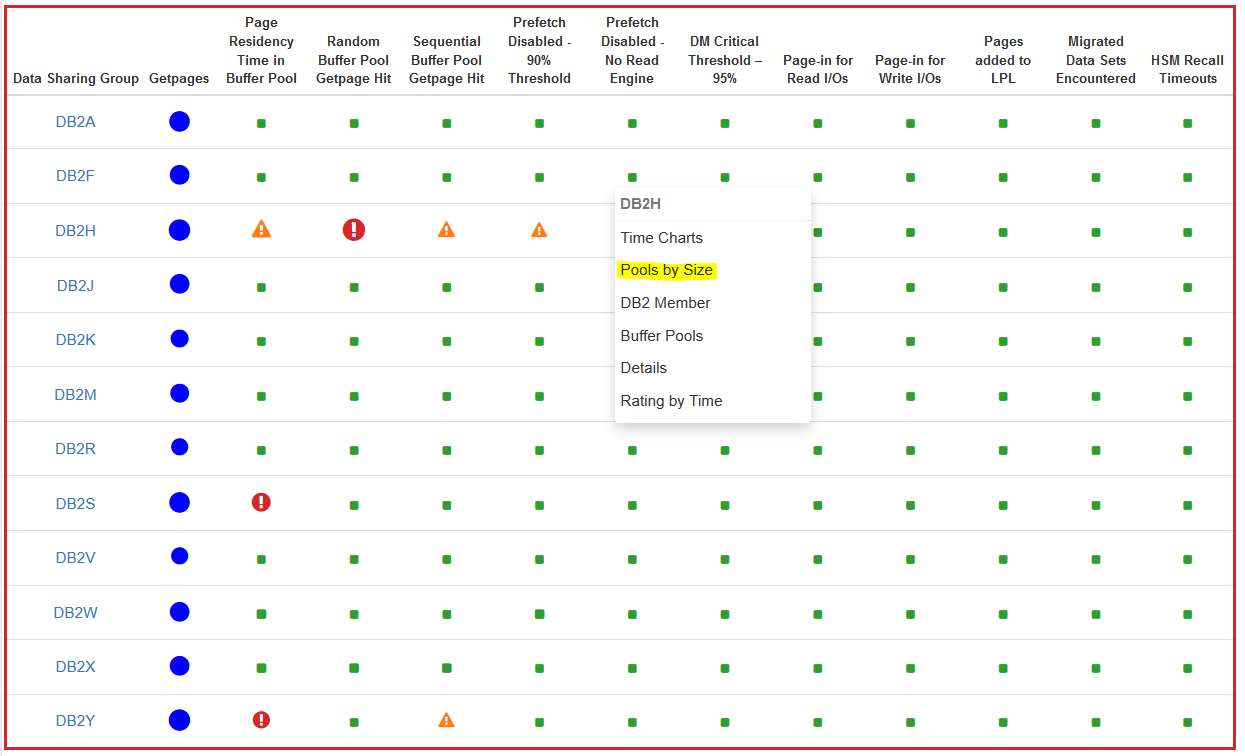
Health Insights Assessments – Enterprise-wide
Automated assessments of 80+ metrics for every Db2 member and buffer pool in your environment help identify potential risks to availability and performance.
In this example with key Buffer Pool metrics, exceptions relating to hit ratios and page residency times are identified for every data sharing group and presented in a single easily consumable view.
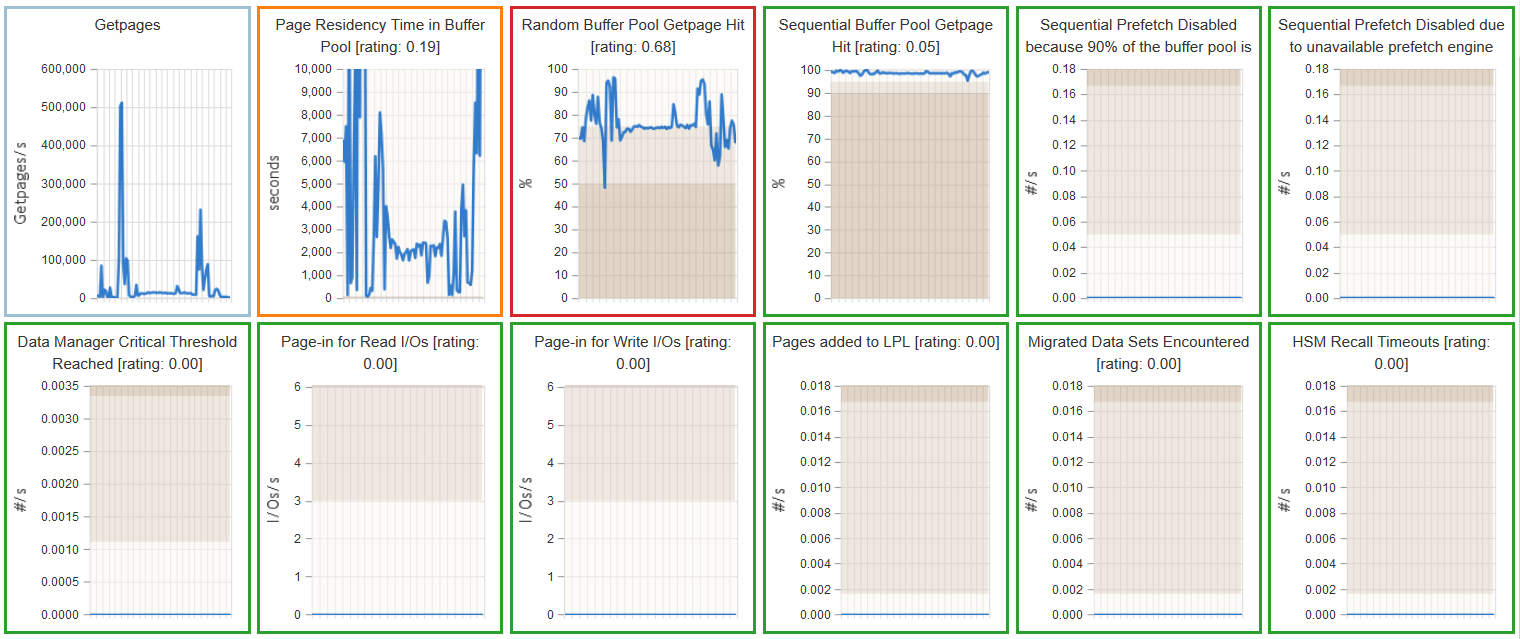
Health Insights Assessments – Time Charts
At any phase of the analytical process “Time Charts” of all assessed metrics can be generated to examine potential high-level relationships between the metrics. In this example, possible time-of-day correlations between the two metrics with exceptions (with the orange and red borders) and overall getpage activity (in the first chart) can be evaluated, and any specific metric can be selected for more detailed analysis.
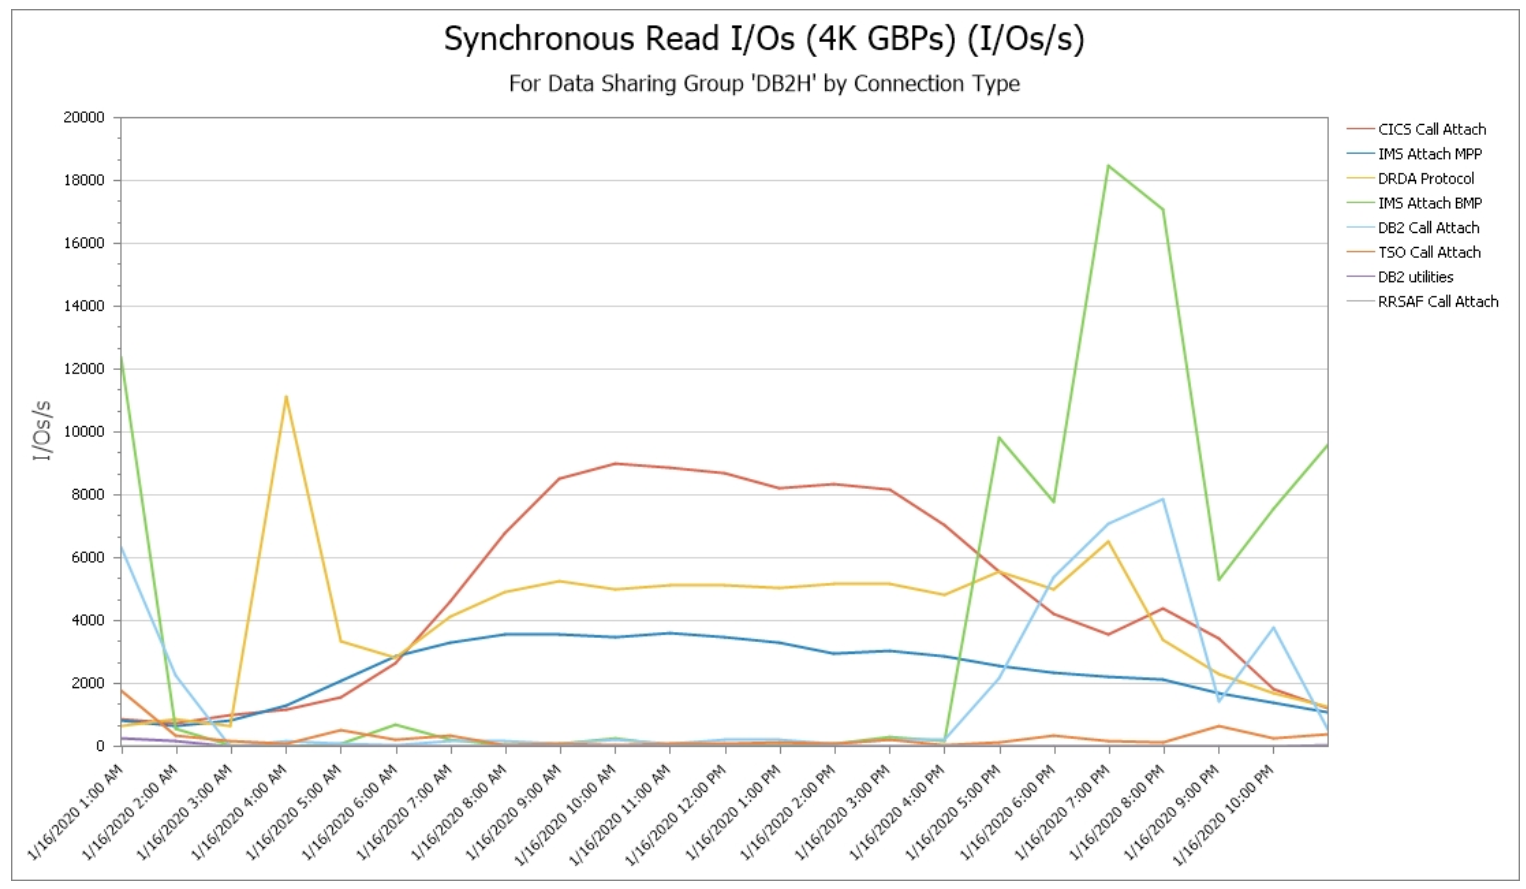
Seamlessly Integrate Statistics and Accounting Data
Context-sensitive drilldowns are especially powerful when working with large quantities of data, enabling you to zero in on the subset of data pertinent to the specific type of analysis currently being performed. As one example, industry Db2 performance experts frequently suggest analyses focused by connection type, since online work (e.g., coming into Db2 from CICS) typically has a very different profile from batch work (e.g., coming in through IMS batch BMPs).
In this example a drilldown seamlessly integrates connection type (from Accounting data) with sync read I/Os (from Statistics data) to create this time of day profile.
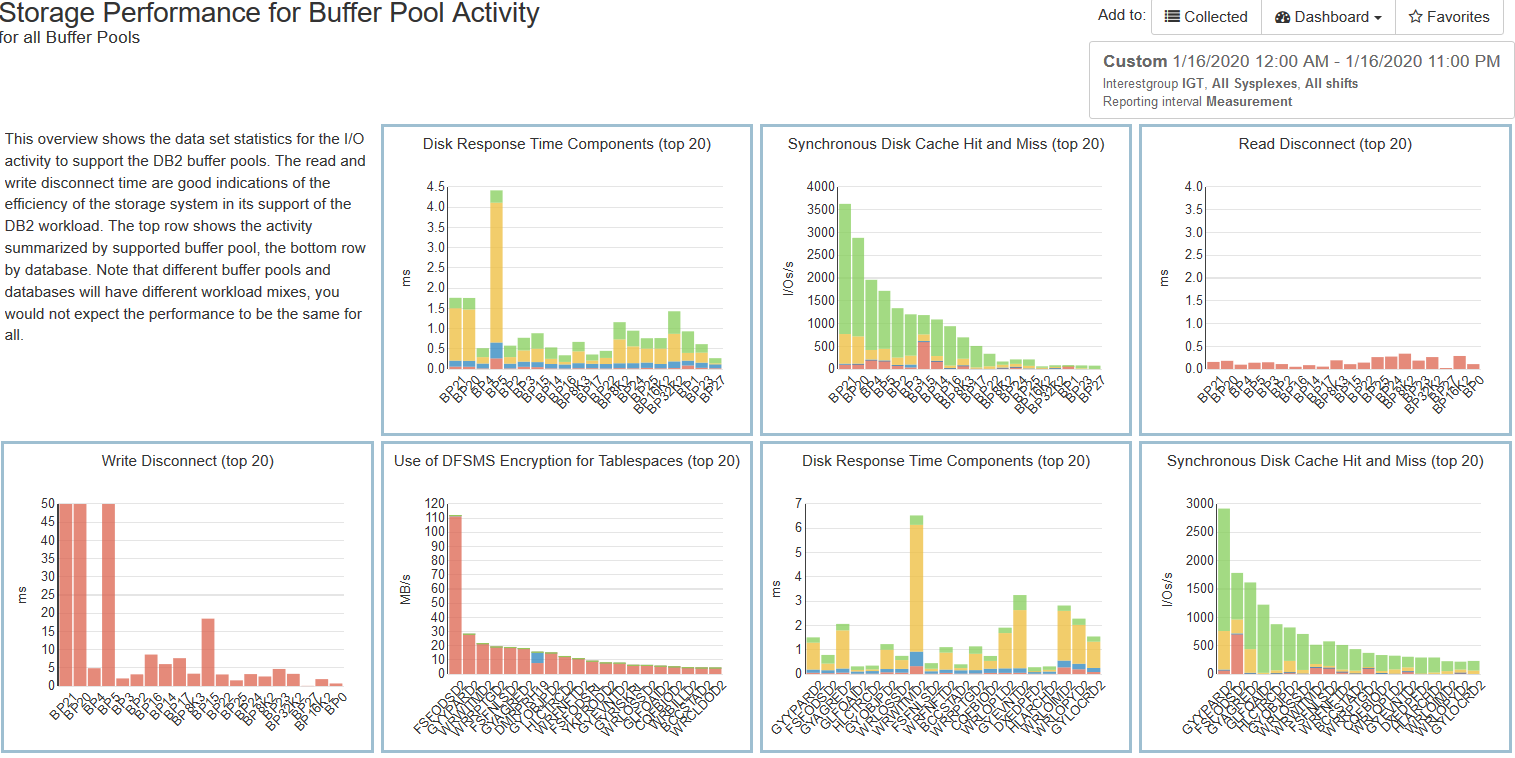
Integrated Visibility into Db2 I/O Statistics by Buffer Pool and Database
Powerful insights into disk I/O and cache performance by Db2 buffer pool and database can be facilitated by integrating data set I/O performance data (from SMF 42 records) with Db2 dataset I/O statistics (IFCID 199) data.
Metrics including disk response time by components (IOSQ, Pend, Disc, Conn) and disk cache hits and misses are presented, by Db2 buffer pool (along the top row) and database (along the bottom). And any of these can be selected for more detailed analysis, leveraging numerous drilldowns.
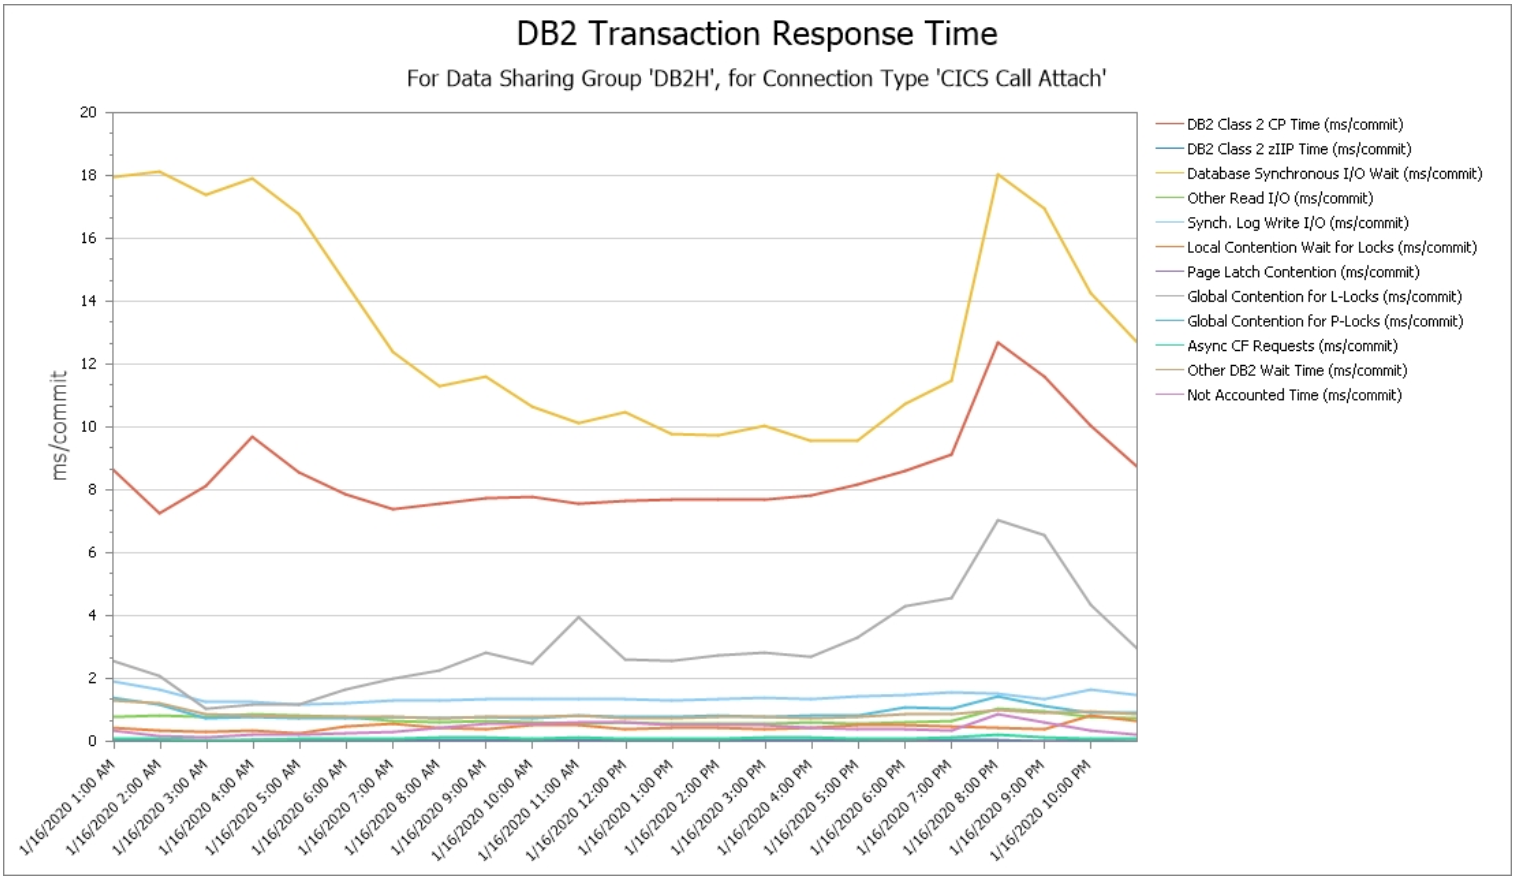
Visibility into Db2 Elapsed Time Profiles
In Db2 accounting data, combining “class 2” (CPU) and “class 3” (wait) times provides an elapsed time profile of time spent within Db2.
Here we see such a profile for work coming from CICS, showing that database sync I/O time (in yellow), CPU time (in red), and Global Contention for L-Locks (gray) are the primary contributors to elapsed time.
IntelliMagic Supports Several of the Largest Mainframe Shops in the World
Flexible Deployment and Monitoring

In the Cloud
Cloud based deployment can be accessed from everywhere in the world and is easy to share with colleagues

Services and Support
Take advantage of IntelliMagic's experienced performance experts for standalone custom services or daily monitoring

On Premise
Install the software on premise and use it offline for total control of your installation
Book a Demo or Connect With an Expert
Discuss your technical or sales-related questions with our mainframe experts today
Db2 Mainframe
Getting the data you need out of the Db2 mainframe is a serious challenge for anyone. The sheer amount of data available makes running specific queries a difficult task. To manually code each query requires more experience than an online SQL tutorial can give you. Understanding how to communicate with the mainframe takes time away from other important tasks.
Db2 is a family of data management products and databases developed by IBM. It organizes data into tables based on relational parameters. Organizations can analyze this data by running queries in the databases to analyze statistics and data. The data on the mainframe can be crucial to business operations. The problem is in the difficulty of getting to and making sense of the information.
A mainframe Db2 tutorial can take hours of your time and still might not teach you how to get exactly the data you need. You need to build commands, manage authorizations, and run utilities for every query you run. These days, taking time out of your day to code every specific query you will need for analysis. Instead of spending time running tasks and analyzing the data, you are spending hours just running the initial queries.
There are tools available that can retrieve data for you and report it in clear, easy-to-understand ways. Platforms like IntelliMagic Vision for z/OS make monitoring and analyzing Db2 data simple. No need for a lengthy Db2 tutorial or spending excessive amounts of time trying to make sense of manual queries. In this article, we will look into the procedures of monitoring and managing Db2 data and how tools like IntelliMagic can benefit your company by simplifying the entire process.
JCL Mainframe
To even begin utilizing the Db2 database, one would need to understand JCL, COBOL, and what they have to do with each other. Any Db2 query tutorial will start with these terms and how they apply to the mainframe. JCL is the easiest language to find what you need out of the mainframe with accuracy. If you can understand JCL, mainframe data will be easier to access and make sense of.
So, what do they mean? JCL stands for job command language. It is the scripting language used by IBM to instruct the database on how to start subsystems and run batch jobs. It allows for precise queries in the mainframe to help your team locate the data sets required for specific analysis. Jobs cannot be completed without a specific knowledge involving JCL and how it works within the database. In other words, JCL language tells the system what to do, what files to use, and how to use them.
COBOL is the code that JCL translates for the system to understand. COBOL stands for Common Business Oriented Language. Any job run on a mainframe is written in COBOL. A JCL tutorial would go over how to use COBOL coding to run batch jobs on the mainframe, while a JCL example will just show a script of COBOL coding written to perform a simple task.
IntelliMagic speaks JCL and COBOL languages with ease and uses them to help analyze the data you need. It offers a user-friendly interface that simplifies the process for virtually anyone to use effectively. Learning how to code with COBOL is no simple feat. IntelliMagic can reduce the need to manually code in COBOL to execute tasks. This makes you more efficient and information more accessible to you and your organization.
Db2 Mainframe Tutorial
SQL, or Standard Query Language, is another essential function of Db2 queries. Much like COBOL is to JCL, SQL is the language of Db2. SQL code is not an easy language to learn, and without it, there are very few ways to utilize Db2 queries. SQL consists of statements that drive the functions that define or modify data objects like tables as well as retrieving and inserting the data in those tables.
Understanding what you need out of the Db2 mainframe is the first step to building effective queries. Making sure of your data needs can help cut down on time trying to code queries based off of general searches. Taking out the guess work out of query building can save you time and money. Utilizing applications to better pinpoint the exact data you need to analyze is a great choice for companies looking to cut down on coding educations.
SQL statements are often embedded in COBOL programs to perform stand queries. Db2 COBOL tutorial videos are good resources to get a quick overview of the difference between Db2 and SQL. Queries run by IntelliMagic’s user-friendly interface give you detailed visual graphics and reports on your Db2 query. Tutorial documents published by IBM themselves clearly define the intricate relationship between SQL and Db2 mainframe queries.
IntelliMagic AI-based programs will help you bypass the Db2 mainframe tutorial and optimize your Db2 performance.
Without having to manually code each specific query, you can get to the important task of analyzing and looking for relationships in the data sooner. IntelliMagic allows you to acquire data from the mainframe easily with its user-friendly interface designed for your team to make the most out of the data provided. With over 80 metrics and simple to understand visual aids to report the data, almost anyone can make sense of or compare data reports with IntelliMagic.
COBOL Db2 Tutorial
Again, COBOL is a programming language that is translated by JCL to run programs through the mainframe. It is the driving force of Db2 queries and monitoring. A cursor in Db2 is designed to hold the selected rows of tables that relates to functions of the cursor. IBM has a library of Db2 COBOL program examples that sample COBOL Db2 programs using cursor commands to analyze specific data. Using cursors effectively can be an effective way to highlight relational data. But, where do you start with cursors?
IntelliMagic has a simple to use and easy to understand interface that takes the guess work out of running queries in Db2 databases. Utilizing an application that can minimize the need to use COBOL to manually code queries means you can essentially bypass all of the training and COBOL tutorial modules and get straight to the task at hand.
Automatic customizable reports for Db2 data is no longer a pipedream. With applications like IntelliMagic Vision for z/OS available to you, it only makes sense to make the most of them so you can maximize your efficiency and get down to what really matters, the data. In the past, trying to have a COBOL tutorial point you in the right direction was about the best thing to do. Now, however, you have better options.
This is not to say that a COBOL Db2 tutorial won’t be a benefit to your team. They are still helpful resources and can be excellent in providing supplemental knowledge to any organization that chooses to go with an application like IntelliMagic. Understanding what IntelliMagic is doing, even on a basic level, can help you get the most out of your tool. It will help increase your overall comprehension of the data reporting and in pinpointing vital data tables on the mainframe.
SQL In Mainframe
As a reminder, SQL, in mainframe queries, is the language of Db2 databases. Any time an SQL statement is executed, it returns information about the statement execution. The Db2 SQLCODE and SQLSTATE are the information that are returned and give the coder an idea of how successful the statement was. Making sense of Db2 SQL query in mainframe data starts with understanding a lengthy Db2 SQL commands list. Knowing how to use SQL to pinpoint the data you need is the foundation of using the mainframe effectively.
To get detailed information from Db2, SQL SELECT commands are used to zero in on specific rows and subsets of a larger table of data. This can quickly turn into a lengthy trial and error guessing game for anyone who is not an expert on Db2 SQL. Tutorials online can only get you so far. Implementing applications to run SQL queries for you is the best course of action for any organization looking to spend more time analyzing the data rather than trying to find it.
Programs and applications like IntelliMagic for z/OS can seamlessly run queries and compile data into easy to understand visual aids that you can use right away. IntelliMagic also offers online resources that can educate anyone still asking, “What is Db2 SQL?” Analyze over 80 metrics in a variety of ways to determine potential high-value relationships between metrics. Multiple visual representations of data can be accessed and any specific data point can be selected for deeper analysis.
If your organization is in the market for a Db2 monitoring and performance management application, IntelliMagic is the perfect solution. With virtually no limits to the number of ways, data can be gathered, represented, analyzed, and compared, IntelliMagic can maximize efficiency and accuracy. Click here to get in touch with an IntelliMagic expert today to see all of the benefits waiting for you!