
DevOps is a critical discipline that is focused on applying force multipliers in the right place at the right time to improve quality, velocity, and efficiency in Information Technology. The components of DevOps have been around for decades. Like all good mashups, DevOps seeks to bring together often more siloed disciplines of applications development and operations or delivery.
Most of us would agree that mashups that only rearrange letters don’t necessarily make something better. In this blog, I won’t debate the benefits, the motives, or the actual definitions of DevOps. We can all agree that software development and delivery continue to evolve to incorporate better tools and new technologies. Furthermore, DevOps is clearly a growing discipline (see Figure 1), and we should all buckle up for a better understanding of it and how we can engage with our teams to integrate into the DevOps oriented environment.
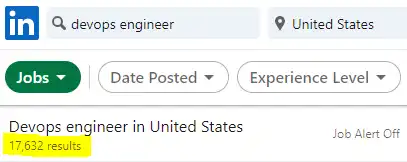
Figure 1: A recent search referencing DevOps engineers on Linkedin
This discussion aims to unpack some key areas that make the DevOps gears mesh correctly so that you are doing more than checking the boxes as you work to integrate the tried-and-true mainframe methods into the DevOps world. There are other people and other processes that contribute to effective and valuable IT service. However, if we zero in on the gearbox (DevOps) as part of a race car analogy, we can focus on several keys to achieving the velocity, efficiency, and quality that helps us win the race.
These keys include:
- Communication
- Collaboration
- Automation
- Flexibility
- Measurement
Improve Communication and Collaboration Within Your DevOps Environment
Many organizations, even those with mature DevOps capabilities, continue to host large ‘war room’ type responses to issues. DevOps may be making inroads to integrate CICS development and Db2 DBAs, but the DevOps team won’t likely include these deep experts from both of those areas.
For one thing, there just aren’t that many extra resources to volunteer into the new organizational structure. This means that the specialized groups will be invited to work together on these calls. When each specialization is referencing reports from different solutions to solve one problem, the multiplicity of views increases the difficulty navigating a path to the truth.
This is why calls for a ‘single pane of glass’ are real. That goal is still largely aspirational, and too often these solutions can become a “single glass of pain”1. However, moving toward integrated views of data from different components and sub-components of the enterprise is something that should drive solutions. This helps combat the expanding IT complexity and declining experience of delivery resources.
Integrated Views of Data from Different Components
Two critical areas for many mainframe environments include CICS and Db2. Here’s an example of an out of the box view integrating CICS transaction data with Db2 data associated with the transaction.
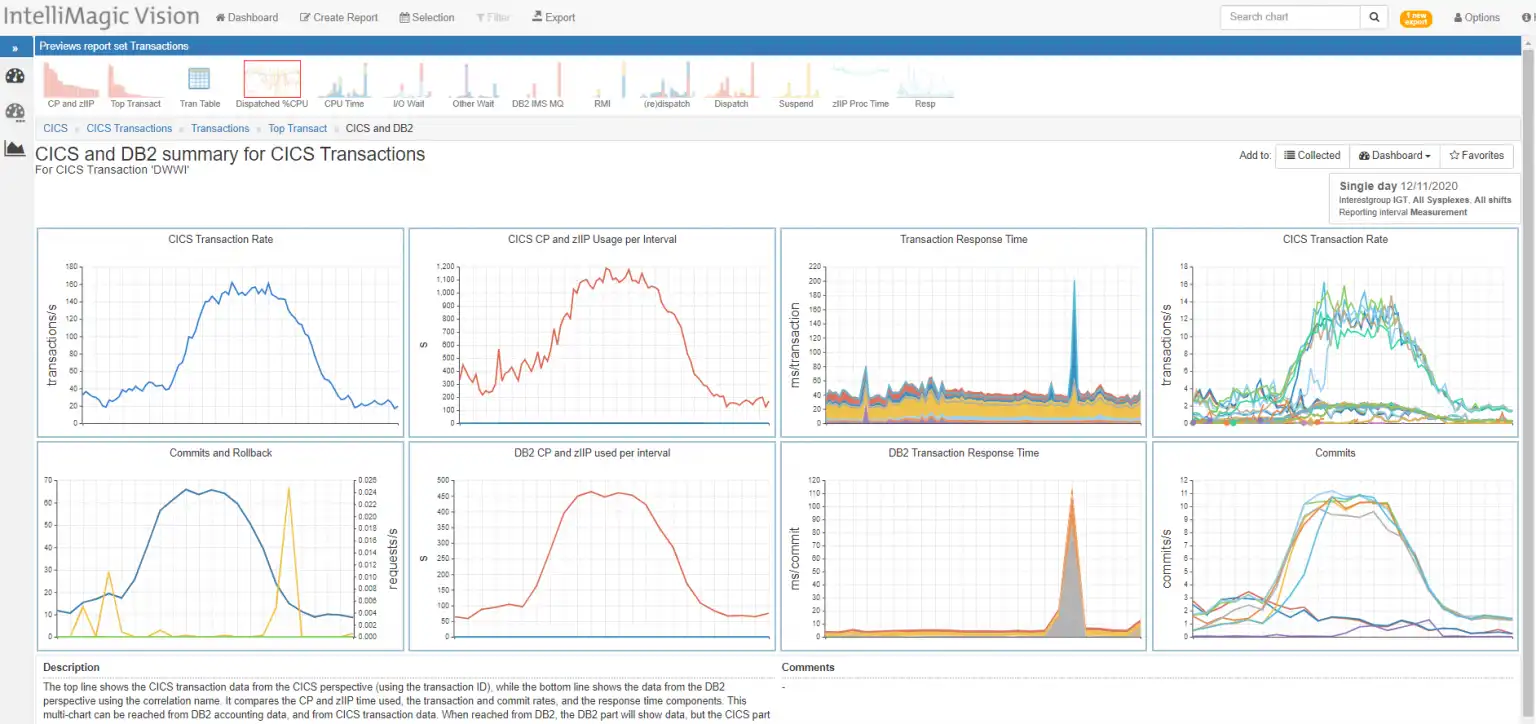
Figure 2: IntelliMagic Vision Integrated performance data for CICS and Db2
These integrated and interactive views of CICS/Db2, including the ability to dynamically edit the reports, make required analysis seamless.
This effective integration (mashup) of these data types is not possible with separate views from a separate CICS monitor and Db2 monitor. This improves incident diagnose time and leads to actionable steps more quickly.
Foster Fact-Based Decisions and Enable Consistent Practices for Better Communication and Collaboration
Easy access to the reports, and quick access to specific reports can aid in future analysis and help prevent incidents. These are features that foster communication and collaboration.
Here are several more important features:
- Flexible – easily modified, customized reporting to improve velocity in ad hoc analysis
- Accessible – Browser based, whether SaaS or on-premise
- Secure – SaaS encrypted data, user authenticated, secure data exchange
- Shared Dashboards
- flexible combinations, customized reports
- facilitate communication with the same version of the truth
- build transparency and trust among enterprise teams
Your “DevOps” mainframe performance solution requirements must include mainframe reporting requirements that deliver easily shared views like these.
These attributes help foster fact-based decisions and enable consistent practices. Web enabled solutions improve the communication and collaboration of your teams. Screen shares of browser views or sharing report URLs in an email improve the focus of which resources are needed and what action may help. Shared dashboards further improve your ability to incorporate key mainframe expertise into the DevOps reporting and lessens a reliance on unshared ‘monitors’.
DevOps Automation: Continuous ITOA Reporting
IT Operations Analytics (ITOA) solutions should also include a high degree of automation. It’s one thing to have solutions automatically looking for anomalies in oceans of data, but automatically preparing the data, and integrating data types together elevates your analysts. Otherwise, preparing and processing data often bogs down an analyst’s time. Therefore, alternatives that offload the processing and database work to an external service provide many productivity benefits. Once automated, there is much more time to attend to the business needs of the organization.
In addition, solutions that intelligently rate metrics reduce the time to evaluate the system health by automatically evaluating everything and highlighting those conditions that warrant further investigation. Rather than spending hours looking at thousands of reports, suddenly, analysts are free to prioritize highlighted metrics before an incident. Automating reports and exports to feed other enterprise reporting needs also improves analyst efficiency.
Another key attribute for DevOps reporting is continuous ITOA reporting with little lag. Mainframe performance analysis is no longer a ‘next day’ armchair quarterback sport. Does your RMF/SMF solution provide automatically processed, automatically assessed key metrics throughout the day?
Folding this type of improvement back into our racing analogy, we might see that winning the race becomes much easier if your pit times were reduced by a factor of 10. Likewise, reducing the time to review issues from greater than 24 hours ago to under two hours ago will give you a serious edge in prevention, productivity, and responsiveness to unseen challenges on your IT management journey.
Flexibility: Easy Modification and Customization
Most DevOps engineers likely enjoy some programming, but codifying the knowledge and experience of mainframe subject matter expertise into an enterprise dashboard is NOT where DevOps adds value to IT. Rather, DevOps should focus on improving the velocity and quality of your IT product features.
Any performance solution must have the flexibility to add their own customized views of specific subsystem performance: system performance, disk, tape, MQ subsystems, batch jobs, TCP/IP performance including encryption, replication and more onto one ‘application’ dashboard. The specific metrics and application components of your mainframe subsystems must be easily stitched together into a more comprehensive performance and availability view in a customized dashboard.
With a nearly unlimited number of metrics and enterprise interactions, a new way to combine the data within existing solutions is necessary. Easily modifying existing reports and providing a variety of export options are a necessity to meet the ever-evolving reporting needs within your organization. This unlocks the breadth of the mainframe SMF data to build reporting that is easily shared among the other towers, and the command center.
Measurement
DevOps will be more effective when armed with more information. Correlations of metrics without context might provide insight, but metrics without descriptions are useless. Solutions that report values alone will drive confusion. “Is that rate per minute, or second? How can that utilization be greater than 100%?”
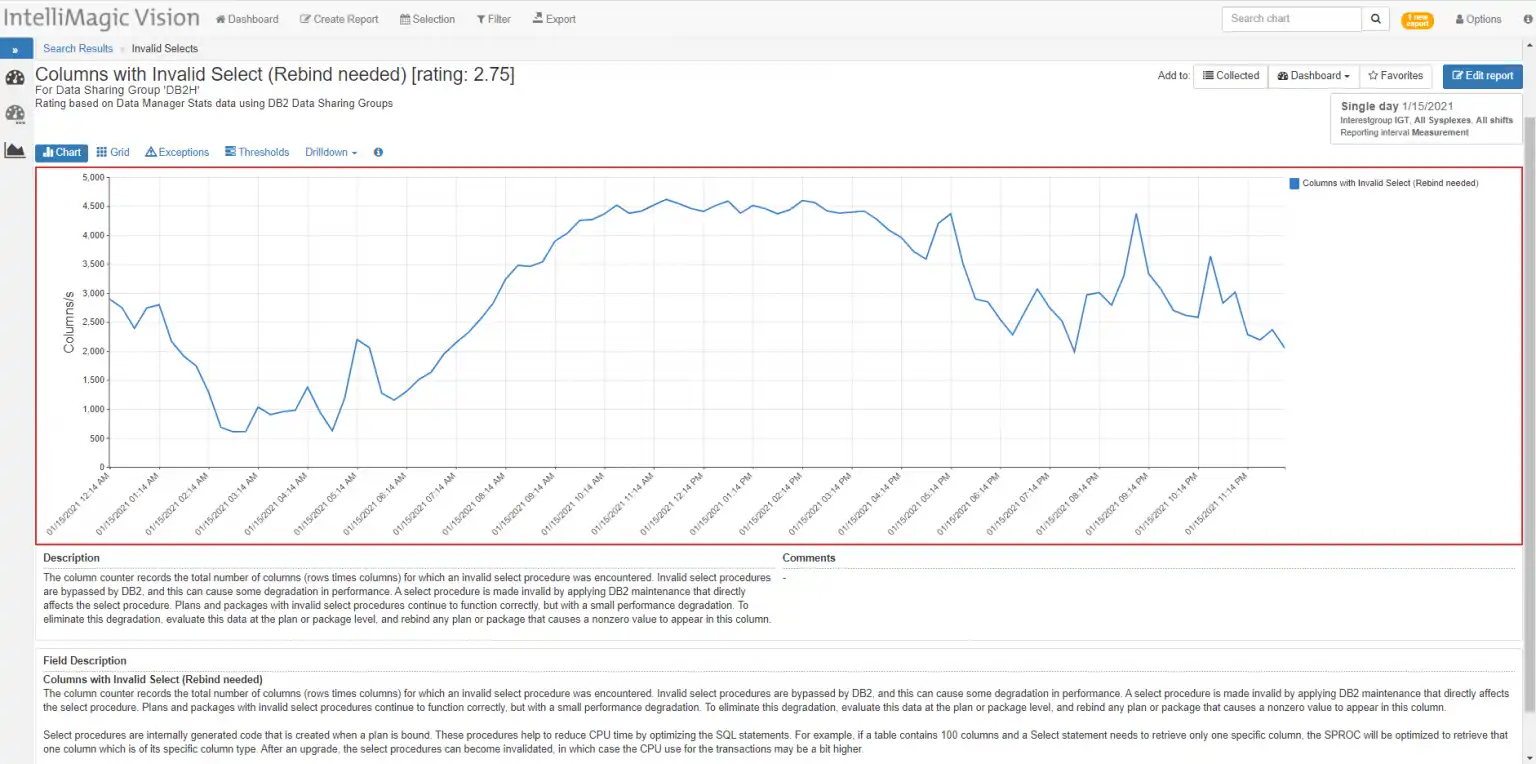
Figure 3: IntelliMagic Vision DB2 reporting example containing helpful descriptions and recommendations
Valuable solutions build knowledge with use and better solutions provide guidance on next steps or explain the relevance of the metric in specific terms. Metrics in compute environments can be event focused, but often time is single most important state information in performance analysis. Since compute systems contain ‘human patterns’ of use, we have come to expect certain metric behaviors at different times of the day, or season of the year.
Solutions should allow for the flexibility to compare time frames, focus on specific windows, and broaden time frames to evaluate longer term trends.
Event focused analysis and log analytics are extremely helpful in diagnosis of the problems that have occurred, but isn’t it much better to prevent a logging event that reduces quality of your IT delivery?
This is where automatic ratings, change detection and other automatic intelligent processing can give you an overdrive gear in your analysis. Embedded intelligence that automatically assesses the massive amounts of data and evaluates it for not only best practice guidance and hardware limits, but also highlights significant changes. That’s smart data!
New Project – New Dashboard
DevOps manages the system now. In spite of many advances in solutions, we can’t predict the next convergence of circumstances that will create the next critical situation. Stuff happens!
But when it does, it’s important to have solutions that give you opportunities to create ad hoc reports and share them quickly. A typical mainframe solution in the past provided canned reports that may not show the problem until tomorrow’s data is processed (If you have kept up with the new SMF records and reporting as IBM continues to provide more telemetry).
Figure 4 shows an example of a custom dashboard that was put together to help bring visibility to the changes encryption was having on systems as one customer migrated traffic to more secure ciphers.
The keys:
- User customized performance reporting
- Multiple export format capability – provides integration
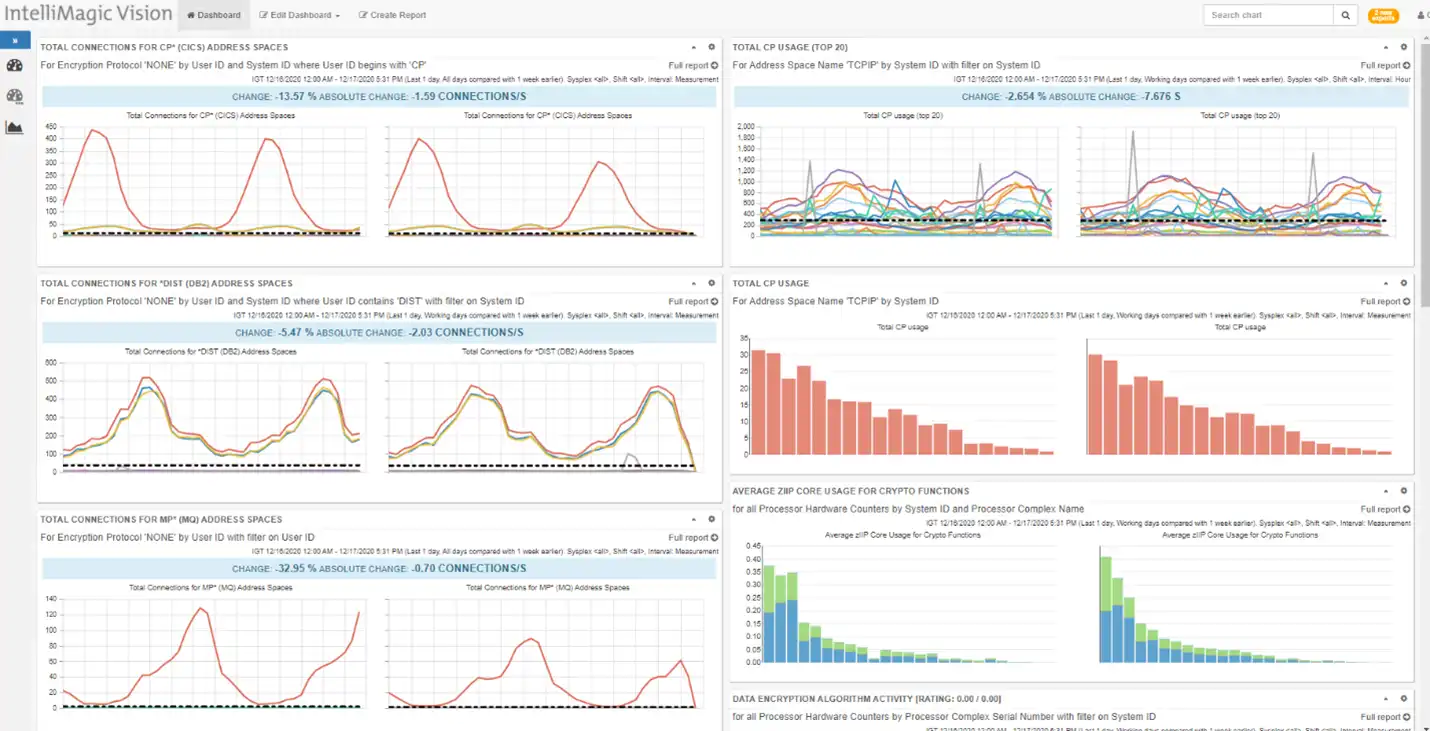
Figure 4: Custom dashboard combining reporting from several areas
The dashboard shown in Figure 4 was seamlessly customized by combining reporting from Address Space (SMF type 30), Encryption activity (119.12), TCP/IP (119) activity across MQ, DB2, and CICS subsystems with Crypto activity (113).
DevOps Built to Win
DevOps is here, and it will continue to evolve. We are sure to see more changes as technology advances. As we manage our enterprises, we can no longer stay siloed with our information. We would encourage you to explore our solutions and how they align with you on your DevOps journey. I’m sure you will find that we will often exceed your expectations and give you the quality, velocity and efficiency to win the race on your DevOps journey.
1 Attributing the “single glass of pain” phrase to Ron L. Kaminski, whom I first heard use the term to describe the attempts to consolidate the complexity of ‘enterprise performance’ solutions into one screen.
Reporting on Coupling Facility Health and Performance
This white paper demonstrates how to effectively monitor the coupling facilities in your environment and automatically highlight any developing problems.
This article's author
 Jack Opgenorth
 Share this blog
You May Also Be Interested In:
What's New with IntelliMagic Vision for z/OS? 2024.2
February 26, 2024 | This month we've introduced changes to the presentation of Db2, CICS, and MQ variables from rates to counts, updates to Key Processor Configuration, and the inclusion of new report sets for CICS Transaction Event Counts.
Viewing Connections Between CICS Regions, Db2 Data Sharing Groups, and MQ Queue Managers
This blog emphasizes the importance of understanding connections in mainframe management, specifically focusing on CICS, Db2, and MQ.
What's New with IntelliMagic Vision for z/OS? 2024.1
January 29, 2024 | This month we've introduced updates to the Subsystem Topology Viewer, new Long-term MSU/MIPS Reporting, updates to ZPARM settings and Average Line Configurations, as well as updates to TCP/IP Communications reports.
Book a Demo or Connect With an Expert
Discuss your technical or sales-related questions with our mainframe experts today