
CONNECT Time Puzzlement
One of the attractive features of using IntelliMagic Vision as a cloud service is that when something changes, you get technical experts excited about diagnosing what went wrong. Our curiosity kicks in and we have a strong desire to “solve the puzzle”.
Recently, a situation occurred at one of our cloud services customers that was a real head-scratcher. One of the disk storage systems saw a sudden jump in CONNECT time. Something had changed, but what was it?
Red Alert
As part of our cloud services solution, IntelliMagic professionals keep an eye on things and report any alerts back to our customers. Friday morning, the 28th of September, was just like any other Friday. We grabbed a cup of coffee and sat down to review our customers’ data. And WOW!
We saw a sudden change in the CONNECT time rating for an IBM-DS8886 that was alarming. We looked back at historical data and did not see anything like it in the past. This was something new and exciting (if you’re a performance guy).
The chart below shows a comparison of the CONNECT time on the day the problem started with the prior week. The change was dramatic and had a specific time of onset. In fact, it had increased 114% from the prior week!
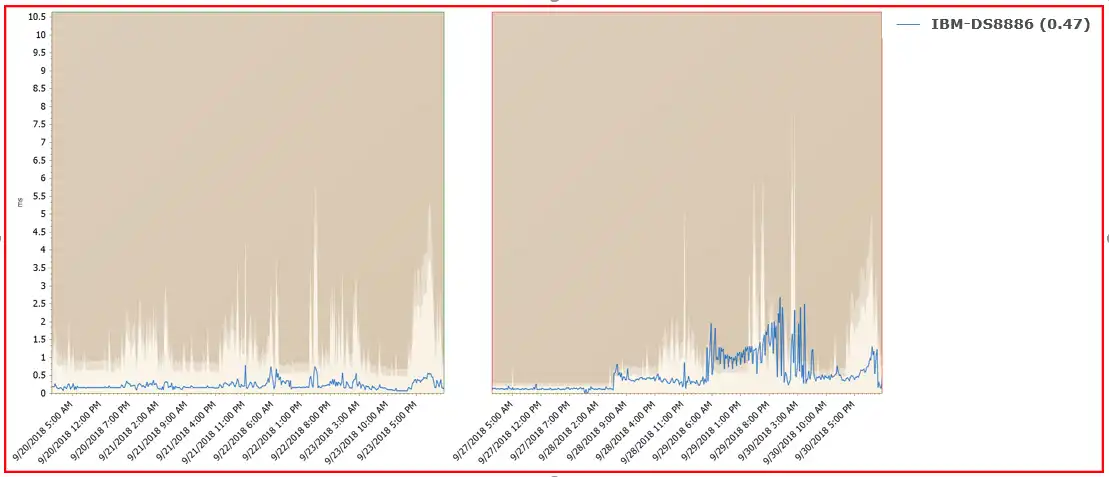
Figure 1 – Connect (ms) [rating: 0.00 / 0.47]
One thing you might notice when you look at this figure is the different shadings seen in the chart area. These represent dynamic thresholds that IntelliMagic Vision calculates for each interval based on workload and hardware attributes. This is far superior to a static threshold because a high CONN time alone does not necessarily indicate a problem.
Finding the Source
By simply drilling down to CONNECT time by system, it was easy to determine that SYSID SYS21 was causing all the elevated CONNECT time. The chart below illustrates this.
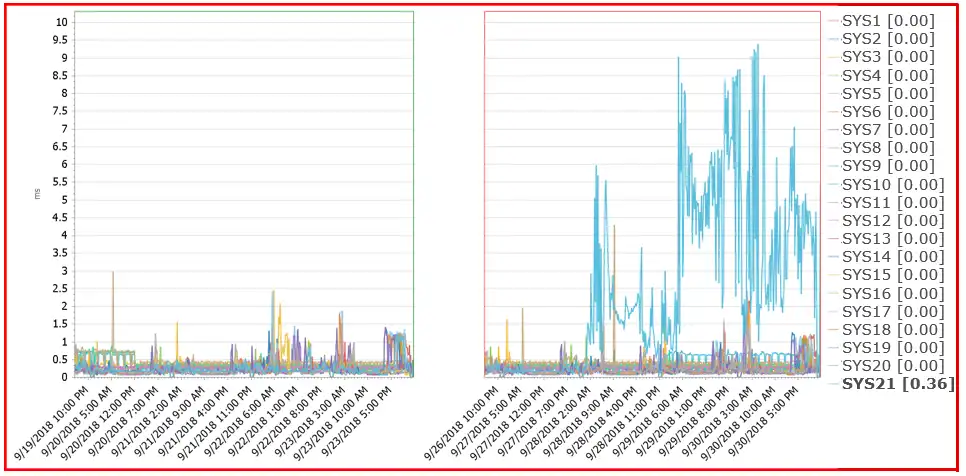
Figure 2- Connect (ms) by System [rating: 0.00 / 0.36]
Unusual VTOC Activity
Next, we wanted to know if the problem was isolated to specific datasets, so we simply clicked one more time to drill down to datasets. Indeed, we were able to see that the issue was coming from the VTOC of just a few specific volumes, as seen in the chart below.
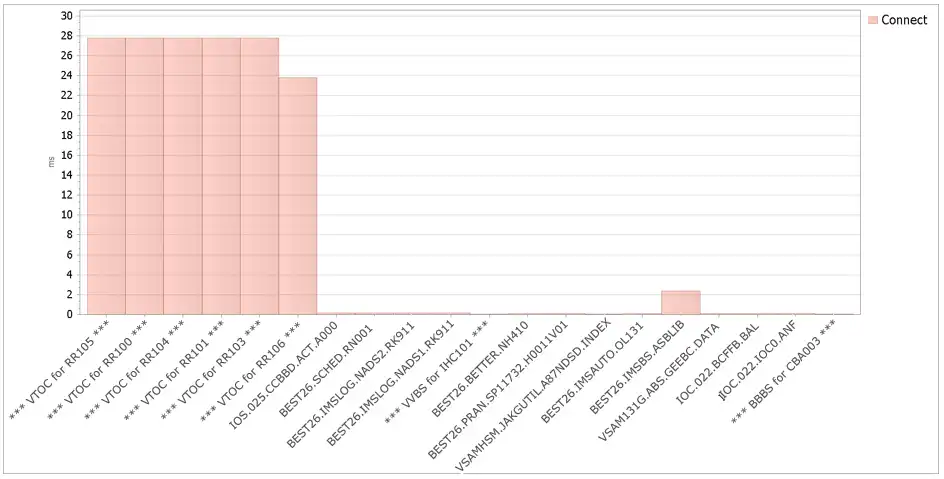
Figure 3 – Data sets by Connect intensity
What was this unusual VTOC activity? A conversation with the customer’s storage management team indicated that they had turned on AUTOBACKUP and AUTOMIGRATE for a few of their storage groups.
AUTOBACKUP and AUTOMIGRATE are the Culprits!
AUTOBACKUP and AUTOMIGRATE are automated functions of DFSMS used for storage management. Unfortunately, based on the data set reports the VTOCs were accessed inefficiently resulting in high CONNECT times.
Another negative impact was that the channel the LPAR was using was getting hammered. See the chart below which shows channel utilization for the channel attached to SYSID C1H0.
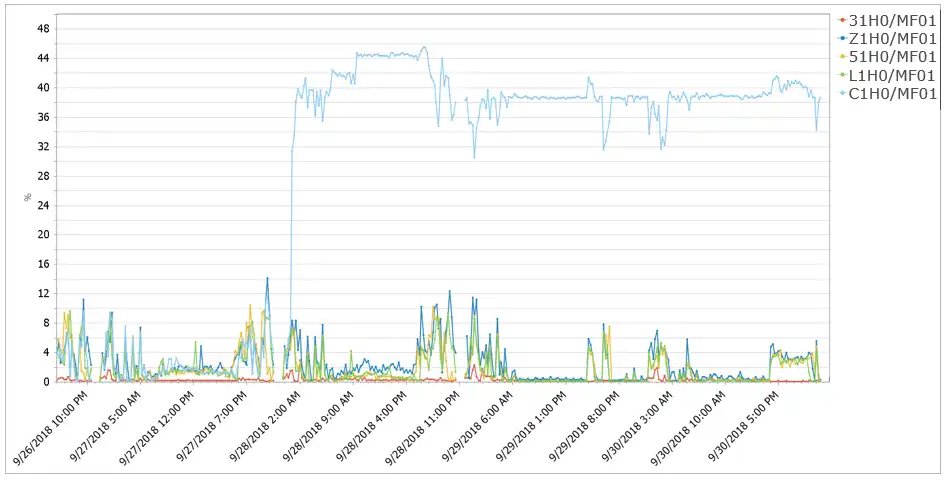
Figure 4 – Highest Microprocessor Utilization for channels used by LPAR (%)
You can see the huge disparity in utilization caused by the AUTOBACKUP/AUTOMIGRATE processes. We suggested that the customer open a case with IBM since this behavior is unacceptable.
For a temporary workaround we recommended dropping the MAXBACKUPTASKS and MAXMIGRATIONTASKS settings from 6 to 1 to limit concurrency when turning on AUTOBACKUP and AUTOMIGRATE for the first time for entire storage groups.
Fortunately, there were no adverse effects to applications this time. But if other activity was present that stressed the channels, that could have been bad.
An Ounce of Prevention
This problem had a happy ending. In this case there were no serious implications from the elevated response time and channel utilization. By helping our customer be proactive and understand what was happening, they will be prepared in the event there are negative implications down the road.
Would you like to be more proactive in managing your z/OS Storage? IntelliMagic Vision could be the answer. Contact us for more information.
This article's author
 Lee LaFrese
 Share this blog
Related Resources
Banco do Brasil Ensures Availability for Billions of Daily Transactions with IntelliMagic Vision
Discover how Banco do Brasil enhanced its performance and capacity management with IntelliMagic Vision, proactively avoiding disruptions and improving cross-team collaboration.
IntelliMagic Vision Support for Hitachi VSP SMF Records from Mainframe Analytics Recorder
Learn how to gain insight into the health of the Hitachi Virtual Storage Platforms VSP 5000 series and VSP F/G1x00 storage systems using the SMF records created by the Hitachi Mainframe Analytics Recorder.
From Taped Walls to Your PC: z/OS Configuration Made Simple with Topology | IntelliMagic zAcademy
In this webinar, we explore a technique that integrates diverse data sources from z/OS, presenting them in a clear, concise, and interactive visual format.
Book a Demo or Connect With an Expert
Discuss your technical or sales-related questions with our mainframe experts today