
Would you like to be able to see into the future? In the 2002 movie, Minority Report, a group of mutant psychic children could see visions of future murders. Tom Cruise plays a police officer that is part of a division that arrests people before they can commit their crimes. While we may never be able to leverage psychic mutant children to predict the future, breakthroughs in Artificial Intelligence and predictive analytics are making it possible to accurately forecast all kinds of events.
In the first blog in this series I spoke about the need for proactive performance management. The bottom line is that an ounce of prevention (proactive performance management) is worth a pound of cure (reactive root cause analysis). In the second part I discussed some common SAN performance issues and how to diagnose and react to them. In this last part I will address some of the use cases where planning and predictive analytic techniques may be leveraged.
The purpose of this blog is to describe some practical techniques that can be used to quantify the planning requirements. Within infrastructure capacity management it is important that we consider growth to help us understand future costs for budgeting purposes. Within storage management there are several specific use cases:
- Based on current consumption how much space will I need in 1 year, 2 years, etc.?
- Based on workload growth patterns, when will I experience performance bottlenecks within my current infrastructure?
- If we add an additional application to our current infrastructure, will there be a noticeable performance impact?
- Where am I experiencing significant changes in the workload activity across the infrastructure that may lead to performance bottlenecks?
Use case #1: Planning for storage capacity
The most common area where we need to plan is for storage capacity. Everybody that manages storage must do this. I have seen many techniques applied:
- HisS: Historical Swag or Order about the same as last year. This is commonly used in smaller IT shops.
- LRA: Linear Regression Analysis: Apply this technique to your usable capacity trend from the previous year(s). Continue the growth line for some time in future. This is typically done by putting the storage capacity history in a spreadsheet and using the spreadsheet linear regression analysis function to project storage. The more history you have and the more static the industry behaves, the more useful this approach may be. This is the most commonly used method. If you have enough history, it is usually reasonably accurate for most industries and organizations. For extremely dynamic organizations the historical growth will not necessarily predict future requirements.
- ABRBO: Average Burn rate/Burn out: Calculate the average burn rate as the amount of newly used storage capacity in GB per day. Divide capacity left by burn rate to calculate days until burn out. This is useful in predicting when you will run out of space. It won’t necessarily tell you how much you need to purchase but is very helpful in planning for space consumption.
- WARP: Wait and Reach out to vendor in Panic I have seen this used at large organizations where the storage management team had excellent relationships with the vendors. Unfortunately, most vendors don’t keep a lot of inventory local to customers so delivery may not be timely. Just-in-time inventory practices have made this approach especially risky.
- CoD: Capacity on Demand With this technique you pay for a certain entitlement and you keep additional inventory on the floor even though you have not actually purchased it yet. When you need it, you can use it and the vendor will charge you. This isn’t planning but just a crutch for people who can’t plan. You still need to use some technique to understand your future requirements.
- Cloud: Throw it on the cloud and then you don’t have to plan. This is another way to simply avoid planning. The CFO and CIO are still going to want someone to predict the costs associated with cloud storage. If you are using cloud storage you may not need to spend a lot of time managing the vendors, but you will need to understand the various cloud storage options from a cost, availability and performance perspective. Forward thinking and planning will still be required.
IntelliMagic Vision uses ABRBO to help understand consumption rates and when you will be out of storage as shown in Figure 1. The primary Y-Axis shows the number of days until the storage system is out of capacity. The secondary Y-Axis shows the amount of space in GiB. In this case the storage system will run out of capacity in approximately 73 days.
For most environments that have a one-year planning cycle, you can evaluate your storage systems using this technique and simply focus on those that will run out of space during the planning cycle.
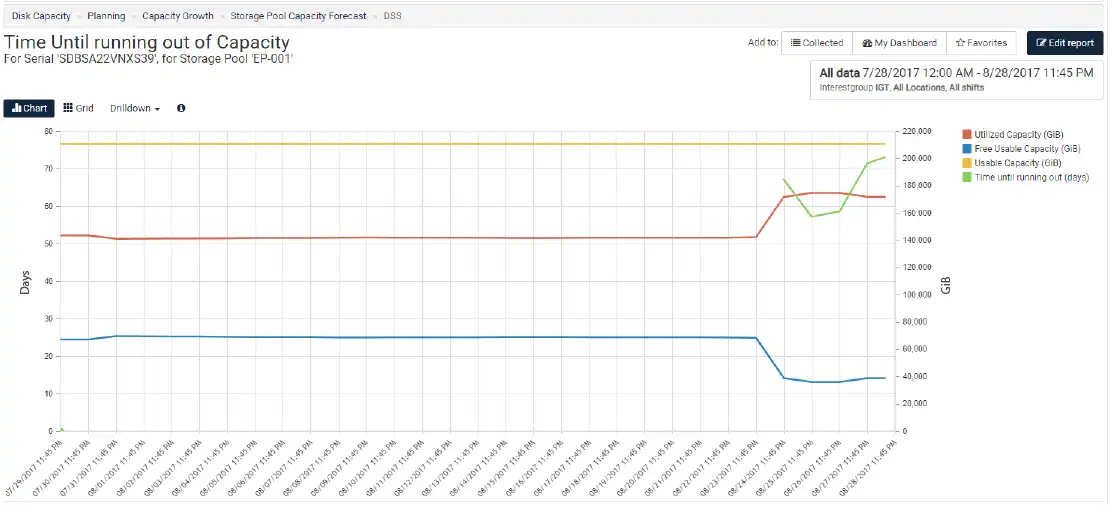
Figure 1: Planning for Storage Capacity
Use Case #2: Based on workload growth patterns, when will I experience performance bottlenecks within my current infrastructure?
You can use straightforward techniques to forecast space growth. Forecasting performance growth is much more sophisticated. Nevertheless, there are a few techniques that are commonly used:
- Back of the napkin: For example, if you are currently running 10,000 IOPS and you have a 10% annual growth in your IOPS, and the storage system can handle 20,000 IOPS (based on your experience) before there is performance impact then:
- Year 1: 10,000 IOPS * 110% = 11,000 IOPS
- Year 2: 11,000 IOPS * 110% = 12,100 IOPS
- Year 3: 12,100 IOPS * 110% = 13,310 IOPS
- And so on.
The storage system can handle 20,000 IOPS safely so you don’t need to worry about running out of performance capability prior to the storage system being retired, so long as the storage system will be retired in the next 7.3 years (log(20,000/10,000)/log(1.1).
- Modeling: Analytic queuing models are a more comprehensive method than the back of the napkin approaches. They require information on peak workloads and rely on abstraction of the specific hardware components in the storage configuration. Storage vendors may offer modeling to support their hardware sales but working with an independent entity that will model multiple target configurations from several vendors is a less biased approach.
- Overkill: Just buy the most powerful hardware that you can afford. This may mean using all-flash storage, large caches, 16 Gb SAN and peak processing power available within the storage. The obvious problem is that you probably don’t need the fastest storage and you may waste a lot of money this way.
- TTSV: Trust the Storage Vendor. Go talk to your favorite vendor and tell them a little about your storage requirements. Then buy whatever they propose. After all they must know their hardware the best. Of course, the vendor is financially motivated to sell you the biggest and most powerful storage system they can. See overkill.
- Outsource: Whether it would be a traditional outsourcing arrangement or outsourcing to the cloud, this method essentially abdicates responsibility to a third party. This may be successful in some instances. However, the first time you hit a major performance issue that impacts your business and you watch how slowly your outsourcing company gets it resolved, you may decide it is not the approach for you.
Use Case #3: If we add an additional application to our current infrastructure, will there be a noticeable performance impact?
In order to understand the impact on the existing environment you need a couple of components:
- The existing workload and infrastructure performance and capabilities (See Use Case #2)
- The new workload requirements. In order to conduct any assessment of the I/O performance impact you need to measure and understand the volume and characteristics of the new workload from an I/O perspective. At a minimum you should note:
- Number of expected I/Os per second
- % of Reads
- Average Read and Write Transfer Size
With these characteristics you can estimate how the new workload will affect the existing storage system. You can obtain this information from any native operating system utilities.
- Estimating the impact to the existing system based on the new workload can be done in one of the ways described in Use Case #2. IntelliMagic has a tool called IntelliMagic Direction that we leverage in consulting engagements to model various ‘What-if’ scenarios for storage systems as shown Figure 2.
This example is showing how growth in I/O rate and Disk capacity impact the service times.
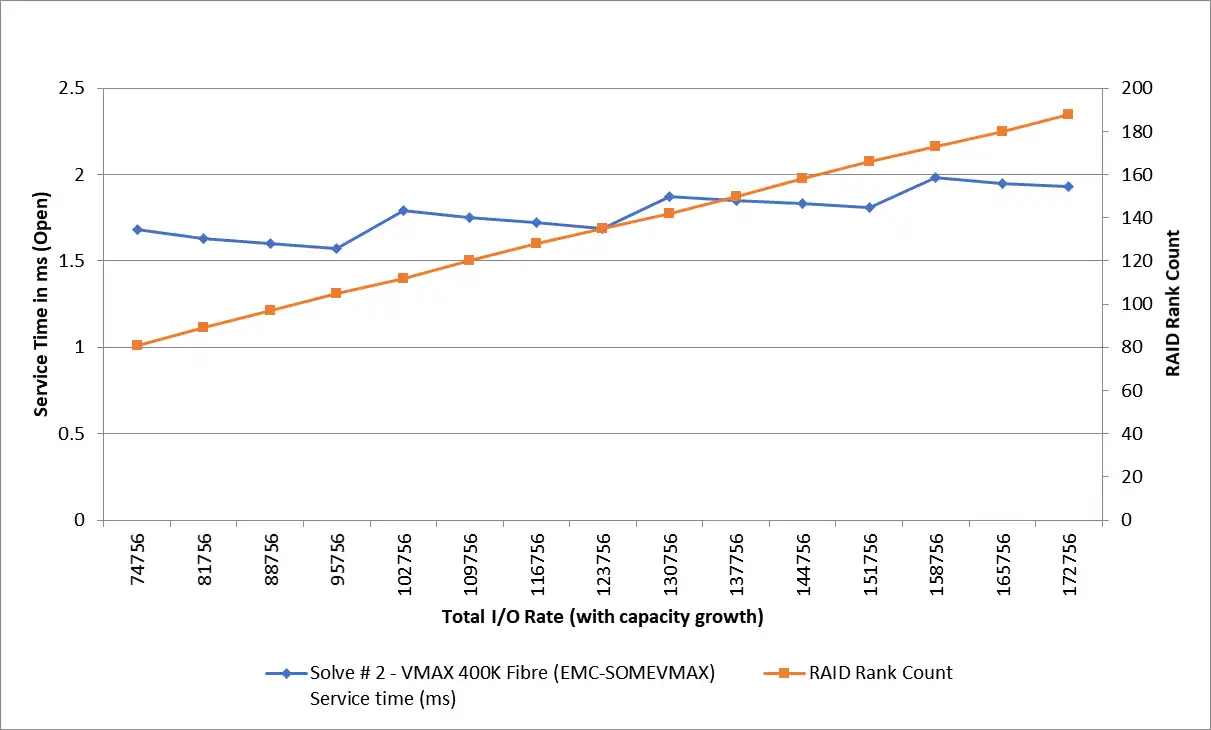
Figure 2: Modeling Storage Systems
Use Case #4: Where am I experiencing significant changes in the workload activity across the infrastructure that may lead to performance bottlenecks in the long term?
In this particular use case let’s focus on long term growth trends as opposed to short term growth trends. I normally configure a series of trending charts for key areas of my environment in order to continuously reflect the trending of key areas. There are a couple kinds of growth:
- Organic growth. In most organizations the organic workload growth from existing applications is not exponential.
- New workload growth. If you are in an organization that is adding new applications to existing infrastructure, then you have to carefully monitor your environment so you can identify deviations from baseline. See Use Case #3 for dealing with this type of growth.
For the organic growth keeping an eye on trending charts is helpful. One example of this type of important trending chart is the IOPS vs Response Time as shown in Figure 3. In this chart, the I/O rate did not increase but the response time did. I would want to drill down to see why the response time is increasing.
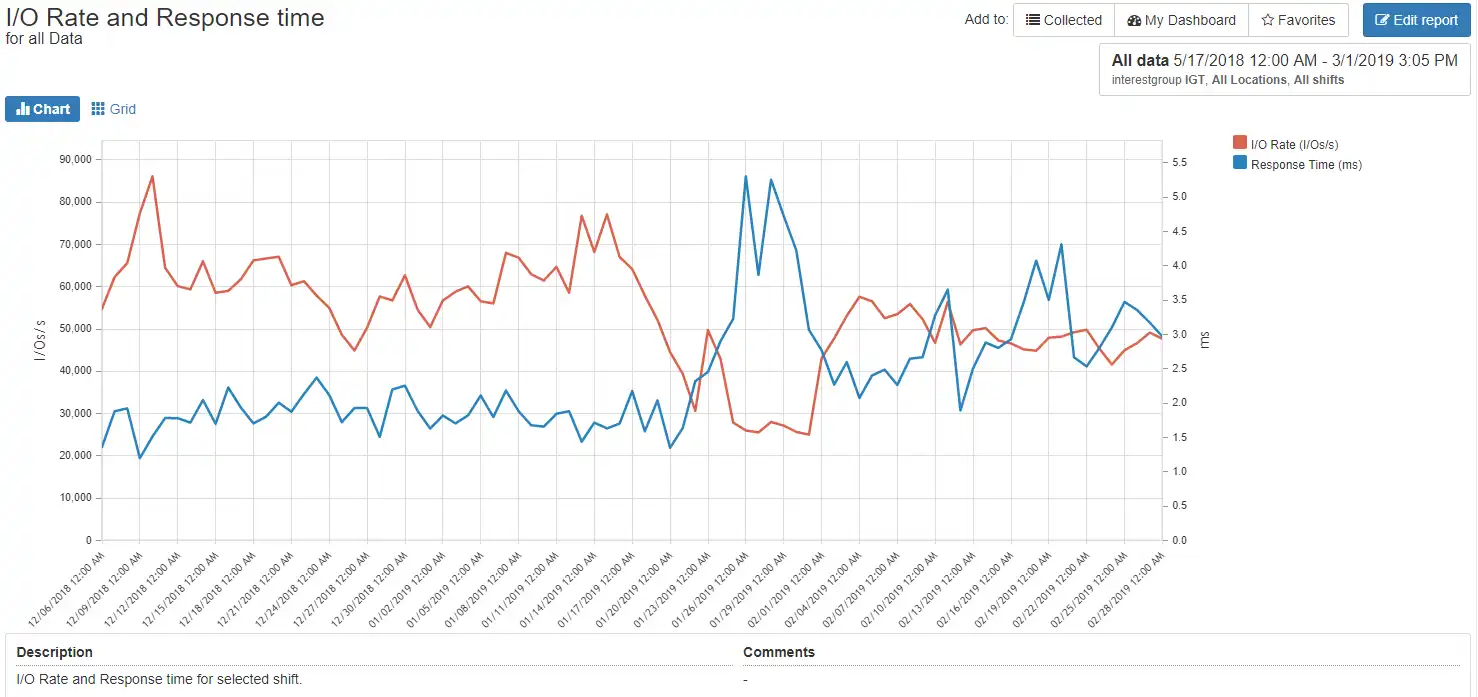
Figure 3: I/O Rate vs Response Time
The overall response time for storage systems is shown in Figure 4. Clearly the system arkham_V7K2 is trending in a bad direction and should be investigated. I also monitor top switch ports and heavy hitting hosts in the same manner to make sure key performance indicators such as throughput or response times are not trending in the wrong direction.
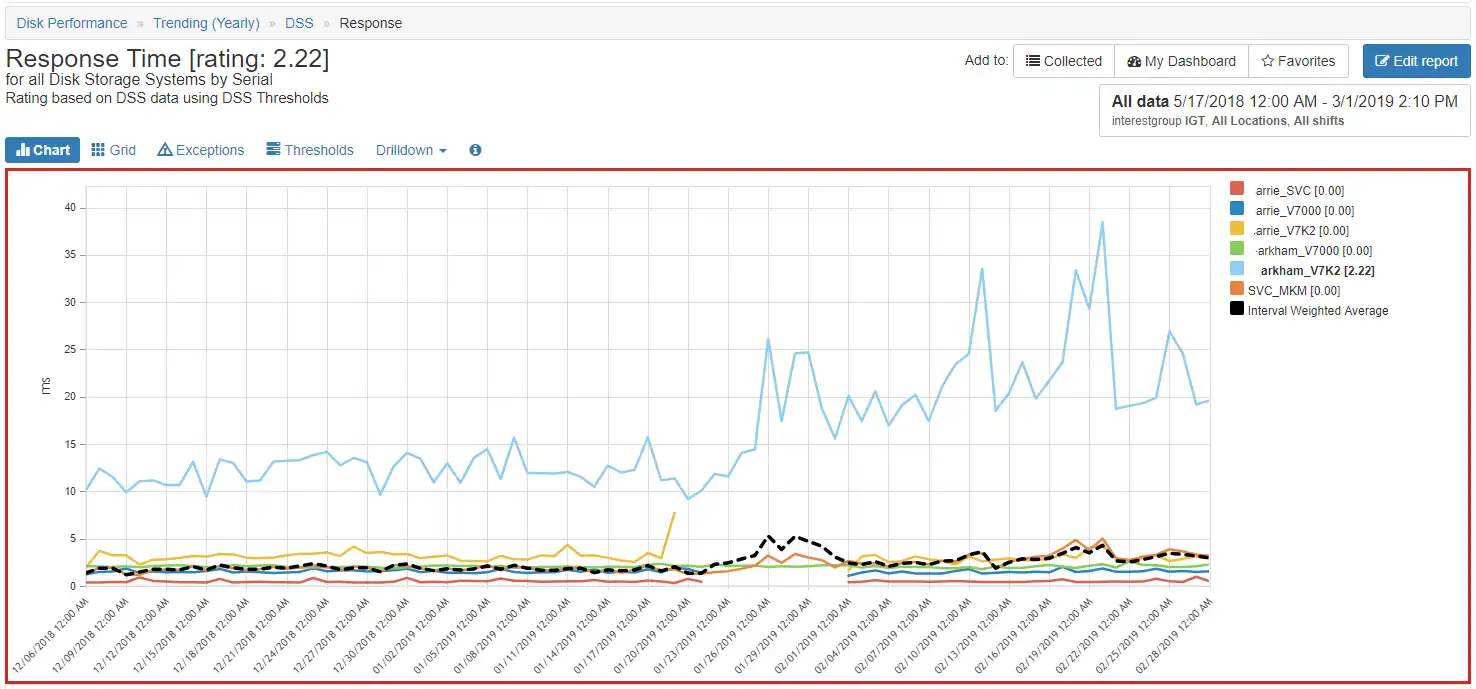
Figure 4: Trending DSS Response Time
In this blog, we looked at a few use cases where applying some predictive analytic techniques can help in planning for storage capacity and storage performance requirements. If applied successfully you can reduce excess spending on unnecessary hardware and reduce the risk of experiencing infrastructure disruptions.
This article's author
 Brett Allison
 Share this blog
Best Practices for SAN Performance (Part 1: Proactive)
Read part 1 of the blogRelated Resources
Finding Hidden Time Bombs in Your VMware Connectivity
Seeing real end-to-end risks from the VMware guest through the SAN fabric to the Storage LUN is difficult, leading to many SAN Connectivity issues.
Should There Be a Sub-Capacity Processor Model in Your Future? | IntelliMagic zAcademy
In this webinar, you'll learn about the shift towards processor cache efficiency and its impact on capacity planning, alongside success stories and insights from industry experts.
How to Detect and Resolve “State in Doubt” Errors
IntelliMagic Vision helps reduce the visibility gaps and improves availability by providing deep insights, practical drill downs and specialized domain knowledge for your SAN environment.
Request a Free Trial or Schedule a Demo Today
Discuss your technical or sales-related questions with our availability experts today