
Most of us can identify with situations where we are deluged with data, and we face challenges wading through it all and pulling out the value. A scenario that comes to mind is the proliferation of TV shows now available. As if the shows on the hundreds of networks available on cable TV weren’t enough, the challenge is compounded by the plethora of programming now available through streaming services.
Current cable TV “GUIDE” functionality (where you scroll page by page through a list of hundreds of shows) certainly doesn’t cut it. The streaming services attempt to provide some help through lists of shows divided into categories like drama or comedy, but unless you know specifically what you are looking for in advance, their search capabilities still leave a lot to be desired.
Analyzing CICS Performance
Mainframe performance analysts can consider themselves fortunate to have access to more extensive metrics than on any other platform, but often find themselves facing a similar uphill battle trying to sift through gigabytes if not terabytes of SMF data produced daily at their sites. This task of deriving value from massive quantities of data can be particularly challenging for analysts charged with effectively analyzing CICS performance from the SMF 110 CICS Monitoring Facility data.
It is clear this cannot be accomplished by analysts sifting through tabular data presented in countless static reports. To successfully achieve this, there are conceptually two ways you need to put the power of the computer to work for you.
One is for the computer to be automatically checking key metrics associated with the thousands of elements in your infrastructure to identify hidden risks to availability.
A second is to exploit a powerful graphical user interface to dynamically interact with the data, leveraging context-sensitive drilldowns enabling you to determine based on the current chart what the next logical analytical step should be.
In this blog I am going to focus on that second aspect, the analytical value provided as a highly flexible user interface makes data easily accessible.
Analyzing Time Measurements for CICS Transactions
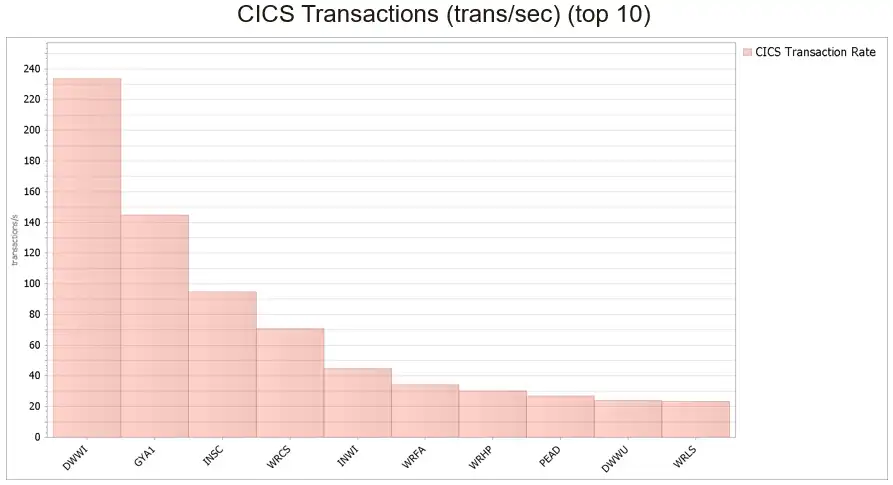
Of the nearly 400 fields in the SMF 110-1 records, approximately 100 represent various time measurements (e.g., CPU, response, wait), so that is clearly an important focus for analysis. As a starting point, one might choose top transactions by total CPU consumed (typically called “CPU intensity”) or by transaction volume. The latter appears in the screenshot below generated using IntelliMagic Vision.
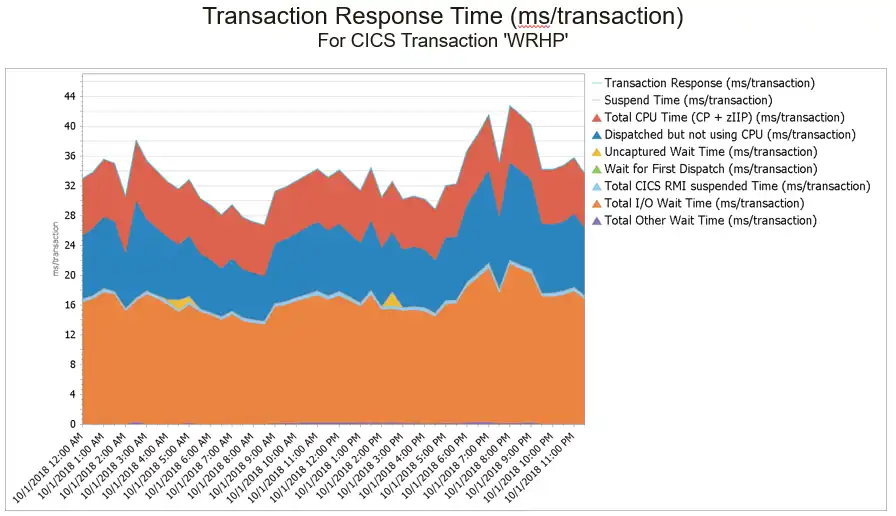
From here, we can drill down to examine the response time of a specific transaction over the indicated time interval, divided into the commonly-defined categories for CICS response times.
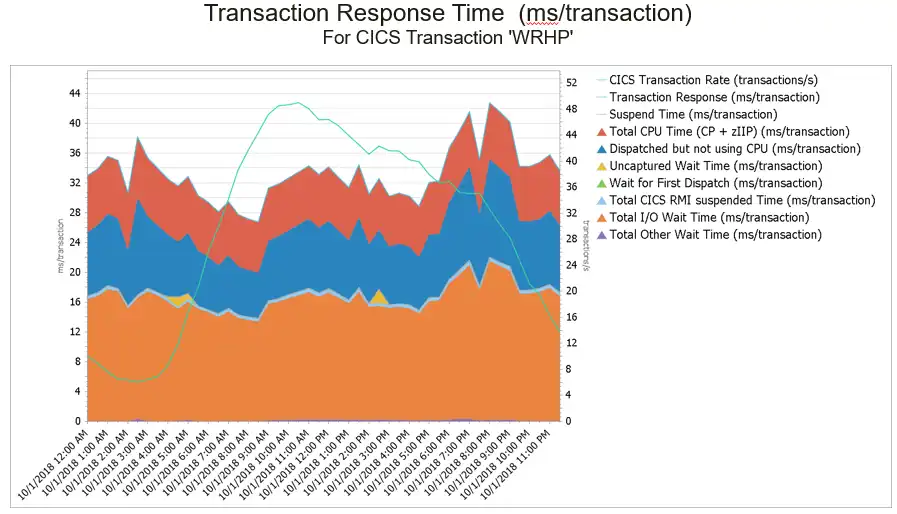
The ability to select other metrics for potential correlation can also facilitate analysis. In the following example, the report was customized to add “transaction rate” (the blue-green line) on the right axis (any variable could be selected).
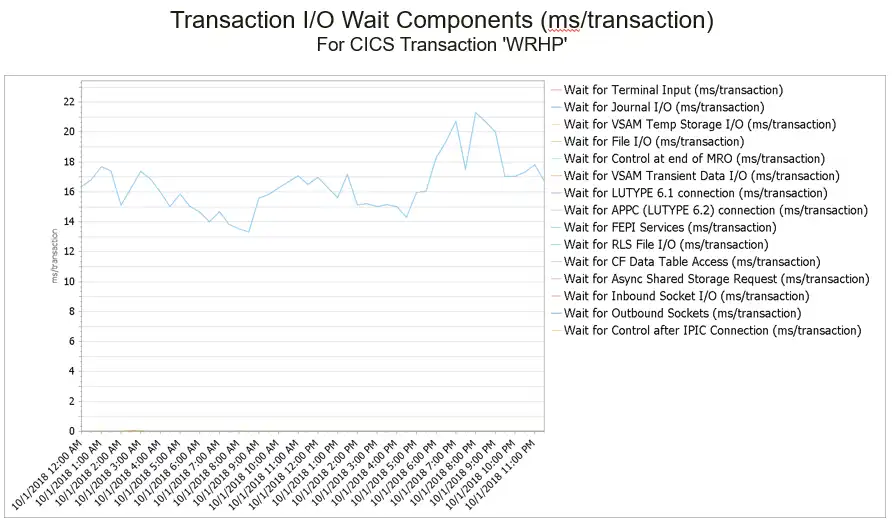
Further analysis into the “Total I/O Wait Time” category may be warranted and can be achieved with a single click. In this example, “Wait for Control at end of MRO” constitutes almost all the wait time.
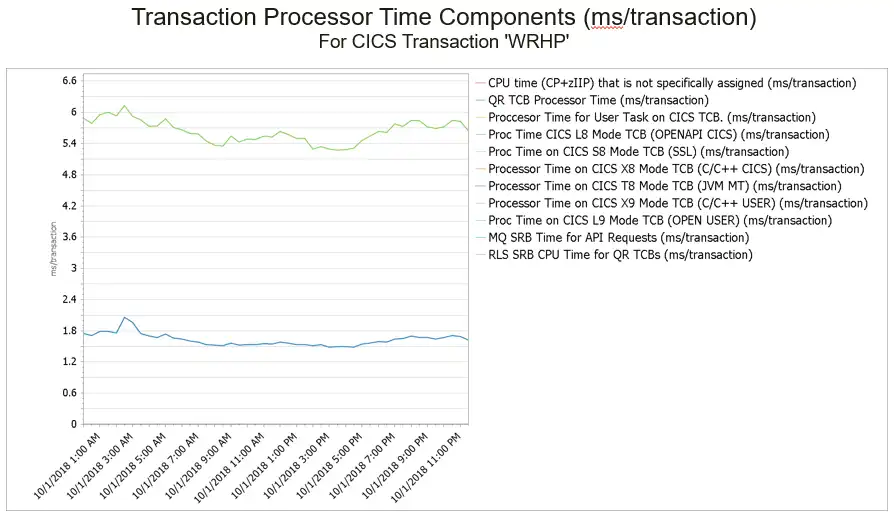
CICS also reports on the components of CPU in great detail, as reflected in the legend of this chart.
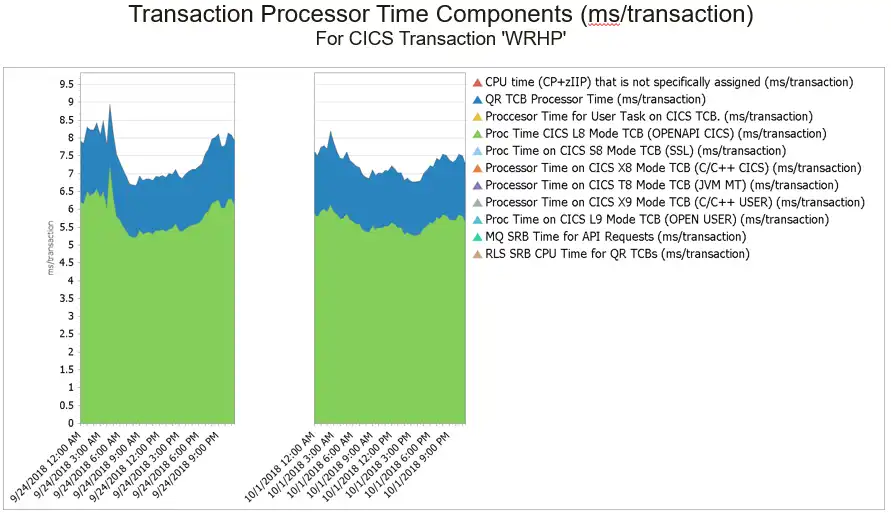
“Before and after” analysis (e.g., of the impact of an application release) on CPU per transaction can quickly be determined by converting this into an area chart and selecting any interval in the database for comparison (requiring only a few clicks).
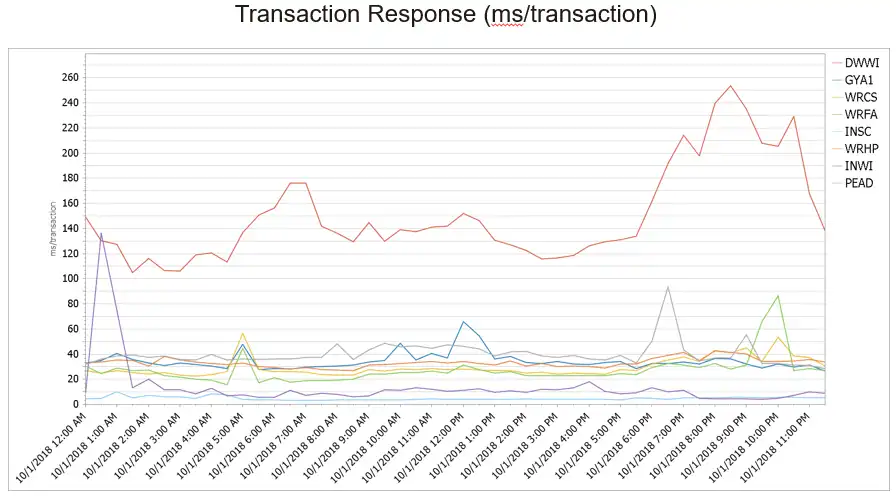
It may be advantageous to begin analysis from the perspective of response times for high volume transactions (as in this example).
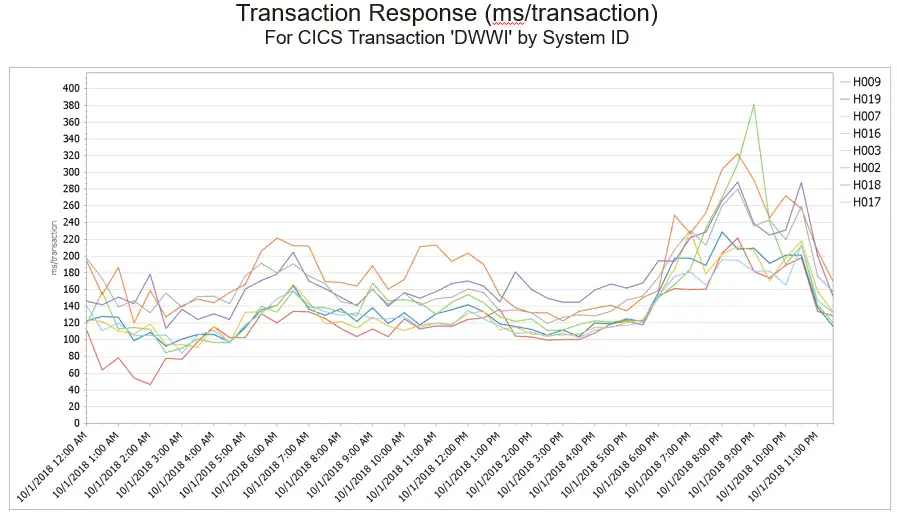
Analysis for a selected transaction could continue through drilldowns into response times by CICS regions and/or by z/OS systems (pictured below) to determine if response times varied significantly across the sysplex (in this case response times were generally similar).
Analysis could also begin from the viewpoint of CICS regions, with similar drilldowns including by transaction, response time categories and components, CPU time, z/OS system, etc. (not shown here due to space limitations).
Making CICS Data Manageable
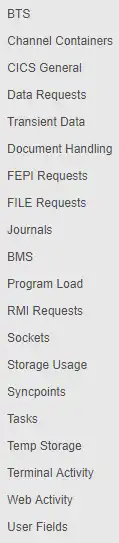 In addition to the time-based metrics previously considered, there are twenty other categories of metrics provided in the SMF 110-1 records, as seen in the column on the right.
Easy visibility to explore this data and context-sensitive drilldowns for detailed analysis make these metrics readily accessible and positions the analyst to quickly derive value from them.
Whether you’re searching for the right TV show or the response time of certain CICS transactions, you need an easy and effective way to filter out the noise and rapidly find what you’re looking for.
From high level overviews to detailed, intuitive drilldowns, IntelliMagic Vision takes the previously unmanageable quantity of CICS data and makes it manageable. Rather than sifting through page after page or report after report trying to identify the significant data points, your analysis can proceed in a direct and expeditious manner to find key insights and actionable information.
This is one of the key reasons why over the course of my decades-long career spent primarily as a performance analyst I found IntelliMagic Vision to be a game-changing tool enabling me to perform analysis at the highest level.
See more on IntelliMagic Vision’s CICS reporting here.
This article's author
 Todd Havekost
 Share this blog
Related Resources
What's New with IntelliMagic Vision for z/OS? 2024.2
February 26, 2024 | This month we've introduced changes to the presentation of Db2, CICS, and MQ variables from rates to counts, updates to Key Processor Configuration, and the inclusion of new report sets for CICS Transaction Event Counts.
Viewing Connections Between CICS Regions, Db2 Data Sharing Groups, and MQ Queue Managers
This blog emphasizes the importance of understanding connections in mainframe management, specifically focusing on CICS, Db2, and MQ.
Enhanced Analysis Through Integrating CICS and Other Types of SMF Data | IntelliMagic zAcademy
This webinar aims to enhance your understanding of how integrating SMF data enriches insights across various z/OS components.
Book a Demo or Connect With an Expert
Discuss your technical or sales-related questions with our mainframe experts today