
Ed Koch was mayor of New York City for 12 years. He was famous for stopping people on the streets and asking them, “How am I doin’?” I have met many IT professionals who have asked the same question about their disk storage systems.
“How are they doing? Are my users getting the best possible performance? Are we about to have a catastrophe? Do I need to order more? Am I ordering too much? Am I making the most use of what I have? Tell me my level of ‘risk’.”
Ed was defining the metric to measure how well he was doing by how people felt about how he was doing. A mayor should try to make people feel good, but there are other metrics as well, like a city’s financial solvency as just one example. When it comes to storage systems, what are the metrics that will tell us how well our storage systems are doing?
Disk storage systems provide hundreds of performance-related metrics. If interpreted correctly, these metrics can provide a lot of information, but not all of them are useful. In order to identify which of the metrics are key, one first needs to know what exactly the metric represents.
Arbitrary Metrics
I recall one storage hardware vendor who provided a pair of metrics related to adapter utilization. The metrics measured utilization for the front-end and utilization for the back-end of the adapter. It was not clear what exact resources were being measured. If this was a processor metric, I would have expected that over a certain utilization threshold, response time would degrade. I tested the metrics, and I didn’t find this to be true. Whether the utilization was 40% or 80%, I was seeing the same response time. I asked the vendor about it. The many people I spoke with were unable to explain exactly what the metrics were measuring, or what utilization levels would result in performance degradation. The vendor told me that to be safe, just make sure you keep the utilization under 50%. As a rule of thumb, this vendor actually suggested keeping all metrics they provided at under a 50% threshold. Vendors aren’t always able to communicate what their metrics represent and which ones are needed to determine if the systems are healthy; sometimes, they are unable to recommend useful thresholds.
IntelliMagic, through our decades of modeling experience, has sifted through the metrics that the vendors provide and investigated what they mean exactly and which ones are important. We even create brand new metrics by combining measurements, because not all important metrics are directly measured. In this way, we created a rich set of key metrics that answer the question, “How am I doin’?”
Metrics and Thresholds
Identifying the key metrics is only the beginning. Once the key metrics are identified, you need to know the threshold where the danger zone starts, so that the metric will tell you, “I’m sorry to inform you, but you are not doing well.” These thresholds need to be much more intelligent than mere linear thresholds on response time or other ‘symptoms.’ They need to be based on knowledge of the internal architecture of the storage systems, such that hidden issues are flagged too.
When we know the metrics and their threshold levels, we want to do more than just look at peaks. One peak incident does not necessarily mean that we have an unhealthy situation. We want to look at a certain period, such as a full day, and answer the question, “Is this a healthy situation or not?” And, if the situation is at risk, we need meaningful guidance as to what we need to do in order to restore stability.
When combined together, key metrics and automated thresholds based on analysis of how workloads interact with the hardware configuration provide the intelligence we need to understand the health of our storage environment. This knowledge of the overall health of our storage is critical. Even when response times are still good, we need to know about any small portion of our environment that might be at risk. An additional requirement to knowing “how you are doing” would be a user-friendly way to communicate the overall health. This communication should lead us to easily identify any area that might be at risk.
Key Metrics Dashboard
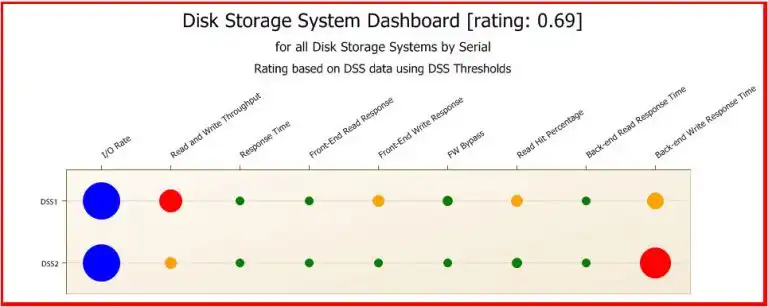
One of IntelliMagic Vision’s features is a visual dashboard that provides an instant overall health assessment using key metrics and intelligent thresholds. Drill downs act as guides to uncover any risk to your storage systems. The health assessment is based on any period that you have pre-defined, such as an entire day. The results are color-coded green, yellow and red, which provide visualized early warnings of risk, allowing you to take action before the storage is rendered effectively unavailable and before applications are severely impacted.
Below is an example of an IntelliMagic Vision dashboard showing two disk storage systems. We can see a red condition for throughput for the first storage system, and a red condition for back-end write response time for the second. Notice that front-end write response time has turned yellow for the first system. This is important to note because front-end response time directly affects the applications, but back-end response time is more hidden. In fact, it is normally invisible to the applications until it becomes so high that it causes massive delays for the applications (and then it’s too late).
Action needs to be taken before applications are impacted.
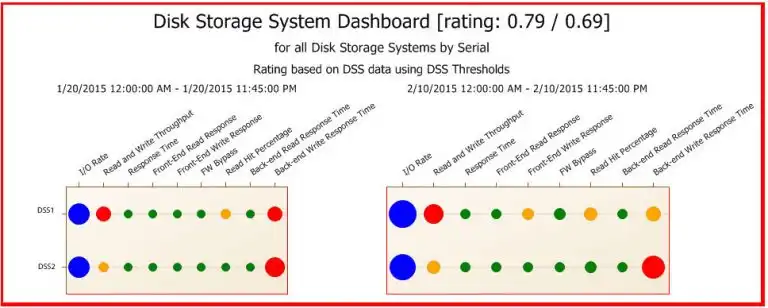
If an environment is showing red and yellow, it is good to know if this situation is something new or if it is the status quo. Obviously, health is not optimal, but how fast exactly is the situation deteriorating? Or is it perhaps already becoming better because of actions we took because we were alerted to these issues ?In the next chart, we had IntelliMagic Vision place two dashboards side by side to compare the situation to three weeks ago. We see that for the first storage system, back-end write response time has improved (red to yellow), but the front-end write condition is new (green to yellow). This needs our attention before it turns red. Also, we see that the back-end write response time for the second storage system has become worse: the red circle became bigger, so it may cause an impact to the end users soon.
In the next chart, we had IntelliMagic Vision place two dashboards side by side to compare the situation to three weeks ago, before the isses were as obvious. We see that for the first storage system, back-end write response time has improved (red to yellow), but the front-end write condition is new (green to yellow). Looking backwards, we can see that IntelliMagic Vision could have brought this to our attention before it turned red. Also, we see that the back-end write response time for the second storage system had become worse: the red circle became bigger, so it may cause an impact to the end users sooner.
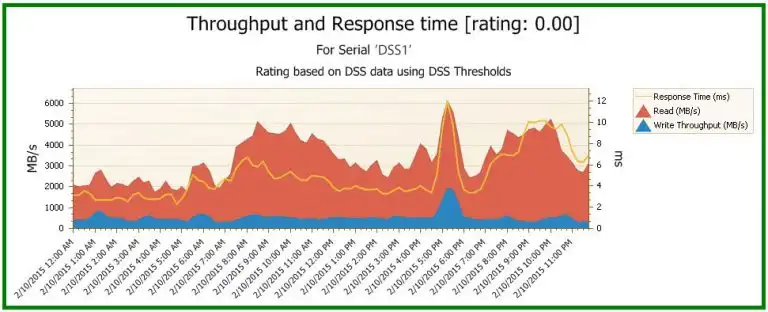
As we noted, the throughput for the first system is red, and for the second one, it is yellow. This means that based on our knowledge of what this particular storage configuration can do, the actual throughput is approaching the maximum that the systems can handle. Perhaps the high throughput is the root cause for the poor write response time? With IntelliMagic Vision, we can look into that.
Below, we have navigated to a dashboard included in IntelliMagic Vision that places throughput and response time on the same chart. We immediately see a strong correlation between peaks in throughput and peaks in higher response time. This suggests the high throughput is causing the issues. Other dashboards and views can now be used to determine if a re-balance will alleviate the condition or whether an upgrade or migration is necessary, which is a part of the embedded human intelligence within Intellimagic Vision.
Metrics that Matter
If you want to truly prevent performance related outages, you need know where you stand now, what happened in the past, and what to expect in the future. IntelliMagic Vision is designed to do this. All this just to let you answer the question, “How am I doin’?”
If you would like to see how IntelliMagic Vision’s dashboards use embedded expert domain knowledge to proactively identify risks in your SAN or z/OS environment, check out this SAN white paper, “Dashboards, Ratings, and Thresholds with IntelliMagic Vision” and this one for z/OS, “z/OS Dashboards with IntelliMagic Vision.”
This article's author
 Stuart Plotkin
 Share this blog
Related Resources
What's New with IntelliMagic Vision for z/OS? 2024.2
February 26, 2024 | This month we've introduced changes to the presentation of Db2, CICS, and MQ variables from rates to counts, updates to Key Processor Configuration, and the inclusion of new report sets for CICS Transaction Event Counts.
A Mainframe Roundtable: The SYSPROGS | IntelliMagic zAcademy
Discover the vital role of SYSPROGs in the mainframe world. Join industry experts in a concise webinar for insights and strategies in system programming.
What's New with IntelliMagic Vision for z/OS? 2024.1
January 29, 2024 | This month we've introduced updates to the Subsystem Topology Viewer, new Long-term MSU/MIPS Reporting, updates to ZPARM settings and Average Line Configurations, as well as updates to TCP/IP Communications reports.
Book a Demo or Connect With an Expert
Discuss your technical or sales-related questions with our mainframe experts today