
For many mainframe performance/capacity specialists, WebSphere Application Server (WAS) can be a bit of a mystery – a black box of resource consumption that’s hard to get your arms around.
There are many areas of WebSphere that can leave even a seasoned z/OS performance specialist scratching their head. Knowing what you want to see and where to look is one hurdle to overcome, but even then, how do you access that data? And more importantly, how do you visualize it in a way that makes sense? Things like:
- Getting a better understanding of your WebSphere workload
- Quickly seeing transaction rates, CPU/zIIP utilization and response times
- Spotting trends, patterns and unusual conditions
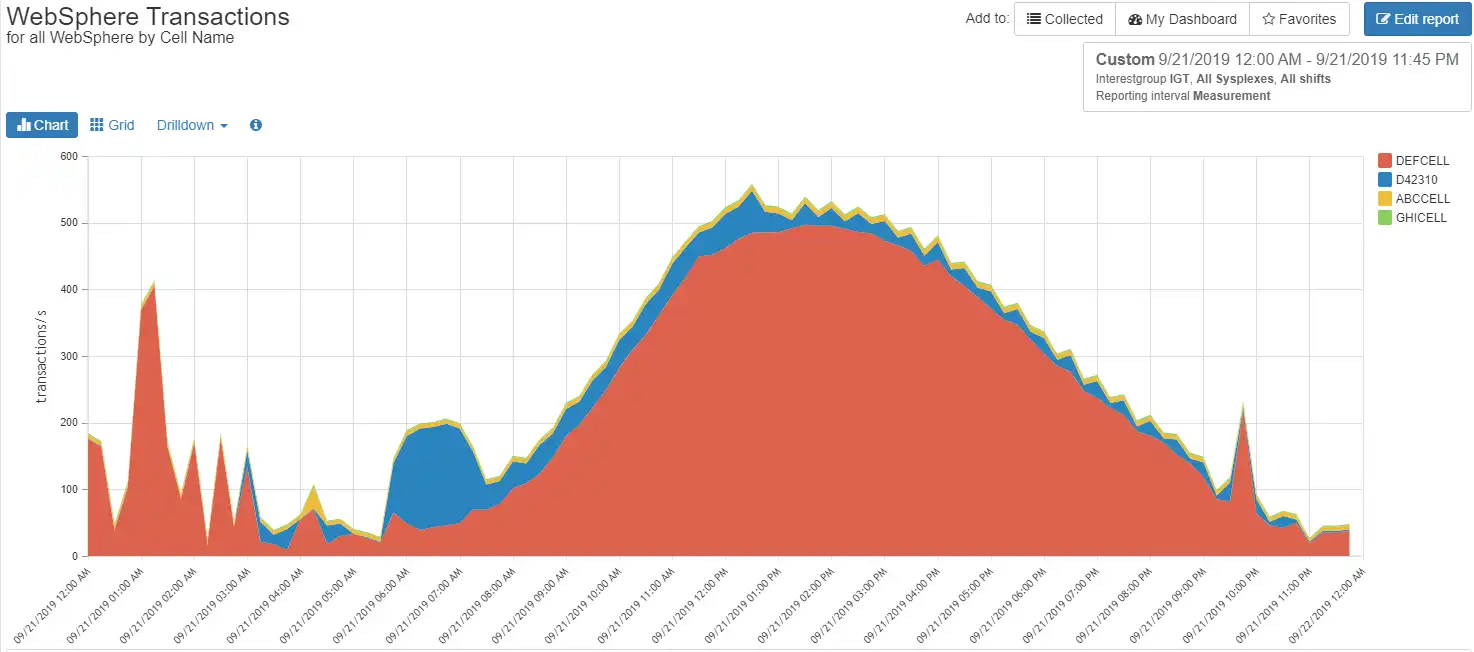
And what about when management has a question? Would you like to show management a chart like this when discussing peak utilization?
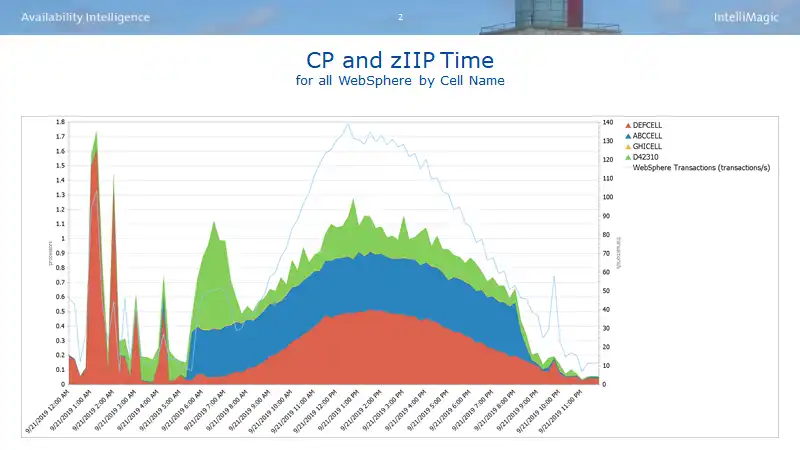 You can quickly see how overall WebSphere CPU and zIIP utilization changes throughout the day, by Cell, along with the transaction rate driving it (light blue line). Peak times are clear.
This blog is intended to show you how you can easily understand your WebSphere workload using only the SMF 120-9 data that you already have access to. I’ll also show you how you can visualize this data and enable you to share information with others in a powerful, visual way.
SMF 120-9 WebSphere Record – What’s it Good For?
IBM introduced the 120-9 record in response to customer demand for a lightweight, low overhead way to get basic metrics for use in performance management, capacity planning, and chargeback. When you combine the ability to view this data over time, produce compelling charts, drill down to more detail, and easily share the information with others, you have a powerful vehicle to help you:
- Provide input to capacity planning
- Understand workload trends and profiles
- Identify changes in applications and usage
- Quickly narrow the problem space when problems arise
- Understand resource consumption down to the URI level (for our purposes, think of a URI as being a WebSphere transaction)
Let’s look at some examples.
(note: the data here has been anonymized – your data will have resource names and pathnames that are much more meaningful to you!)
WebSphere CPU Utilization
Before we had the 120-9 record, reporting of WebSphere CPU utilization from SMF was largely limited to the granularity of your WLM service class and report class definitions. Those are useful, but often we need increased granularity for trending and capacity planning. With the 120-9 data, we can now report CP and zIIP time by Cell, Cluster, Server, Transaction Class, and all the way down to the URI.
CPU Utilization by Cell:
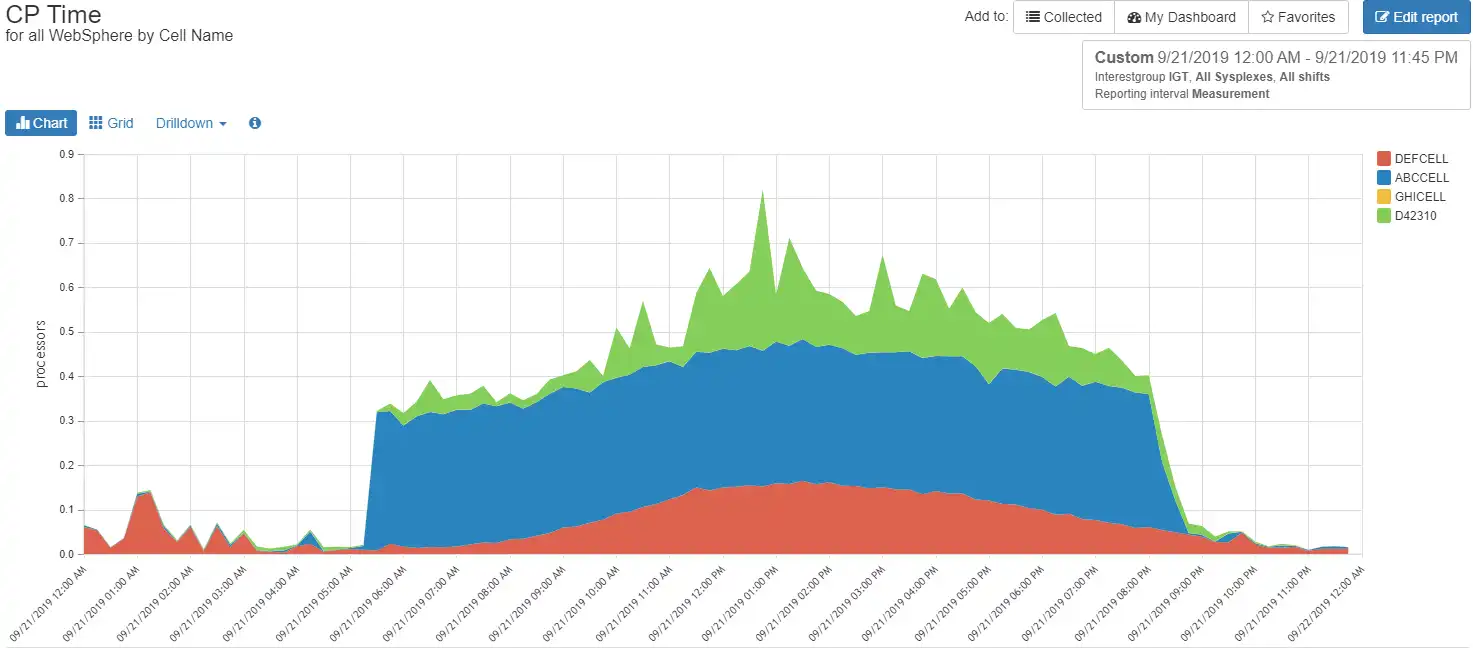 General-purpose CP utilization for the day, by Cell. You can watch for spikes, track over time for trends, or look for a starting point to reduce MSUs.
CPU Utilization by Cluster:
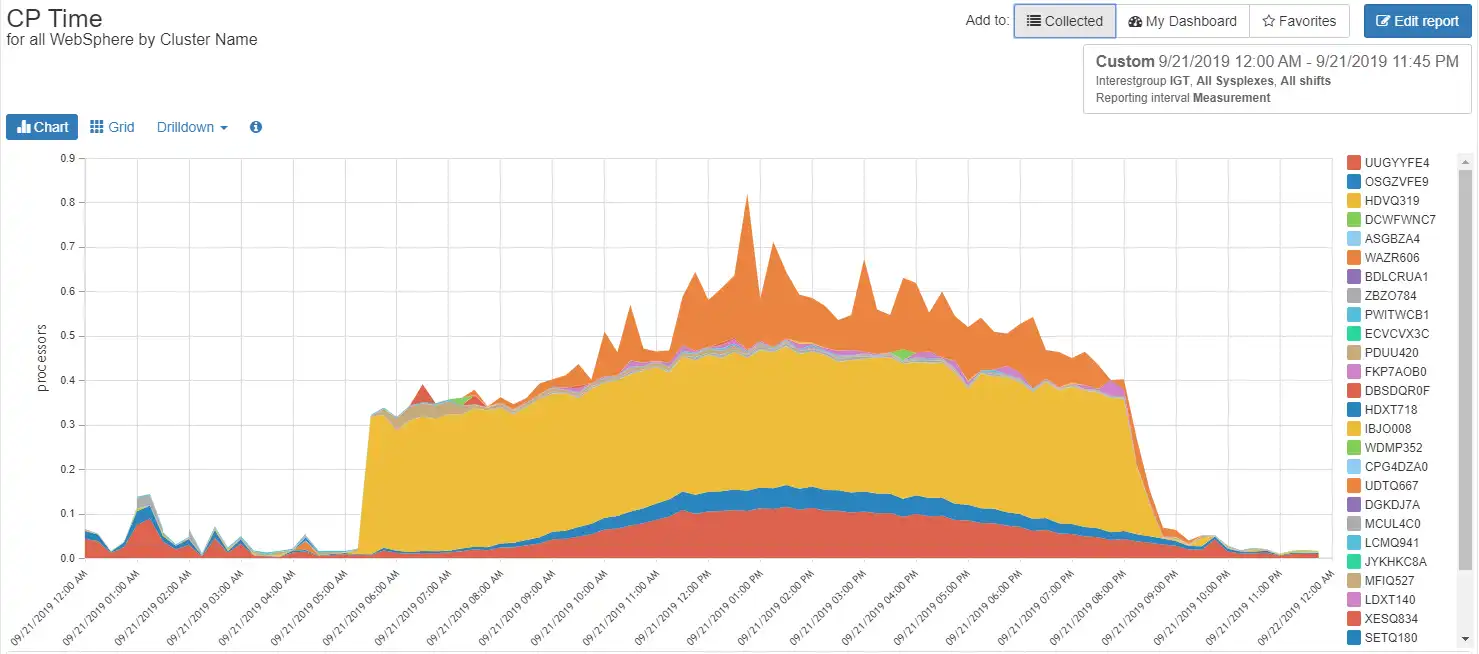 This is the same chart, broken down by Cluster rather than by Cell. You can do the same thing at Server level. Better granularity gives you more insight into patterns, problems or opportunities.
CPU Utilization by URI:
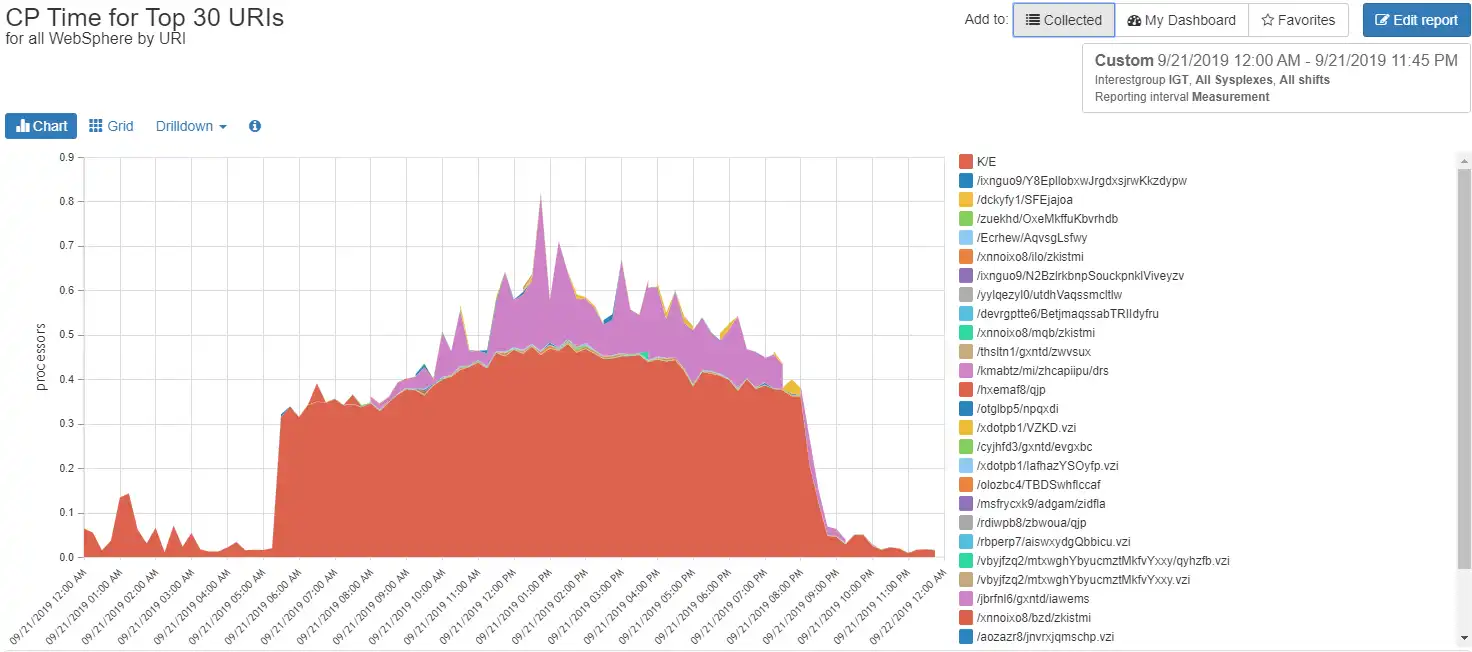 Getting down to the URI level helps you understand which applications are the key resource consumers.
CPU Utilization by Transaction Class, over multiple days:
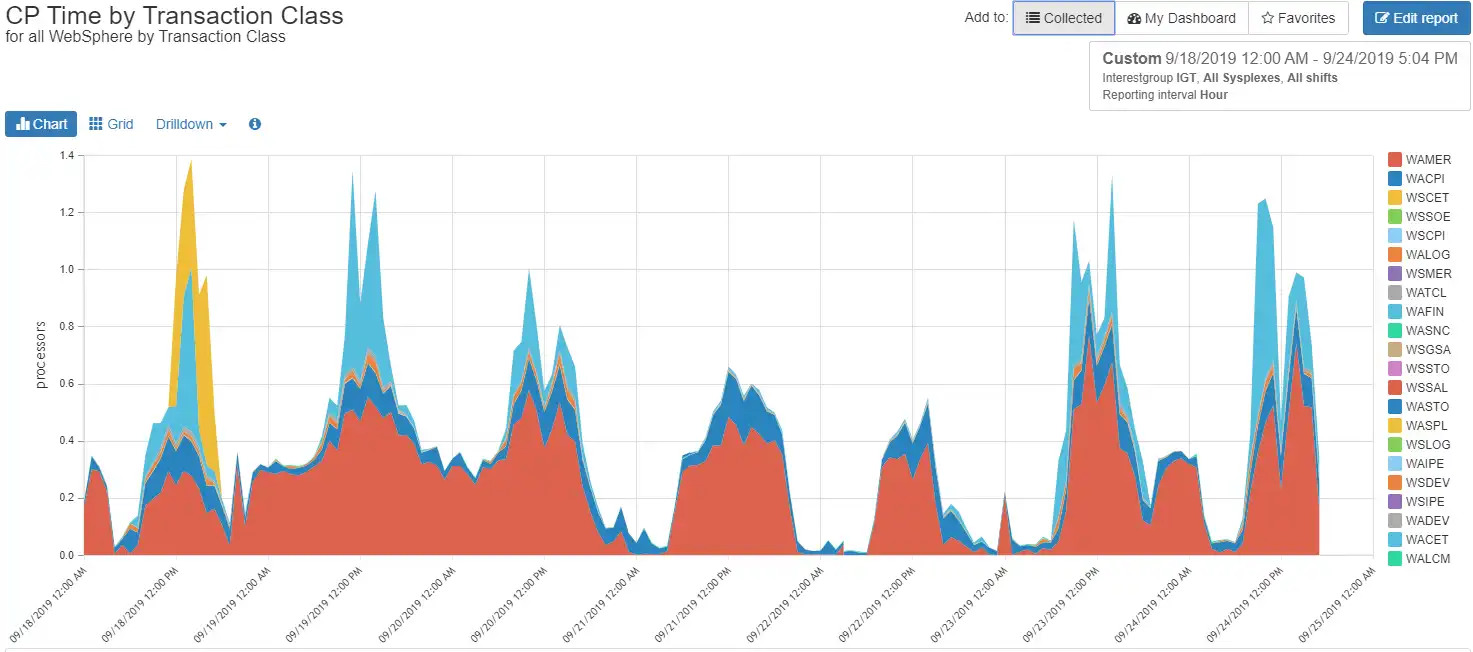 Want to see utilization by Transaction Class instead – or over multiple days? This chart shows you both. Looking at longer periods of time, or direct comparisons of before/after changes, helps you see trends and differences.
All of these reports are pre-built into IntelliMagic Vision, and as with all reports in IntelliMagic Vision, you have tremendous flexibility to choose different times, date ranges, comparisons, trending, filter data, and easily share reports with other members of your team.
WebSphere Transaction Rates
The same granularity of reporting is also available for transaction rates.
WebSphere Transaction Rates by Cell:
 Transaction rate patterns are key to understanding your workloads, and a great way to generate discussion with business analysts and anyone responsible for capacity planning input.
Transaction Rates by URI Level
I could show you Node, Server, or Transaction Class charts next, but let’s skip on down to the URI level:
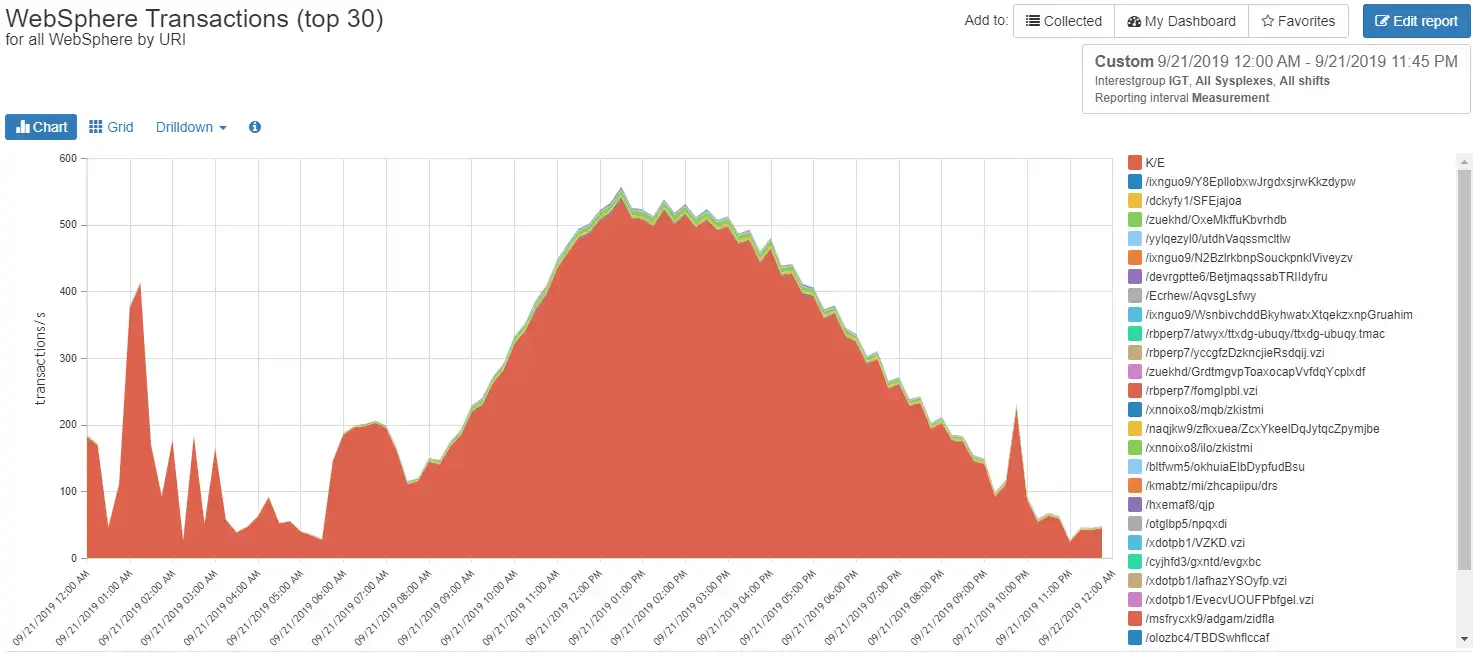 This makes it pretty clear which application dominates the transaction volume, doesn’t it?
WebSphere Response Times
The same granularity of reporting is available for transaction response times – are you beginning to see a pattern here?
Response Times by Server:
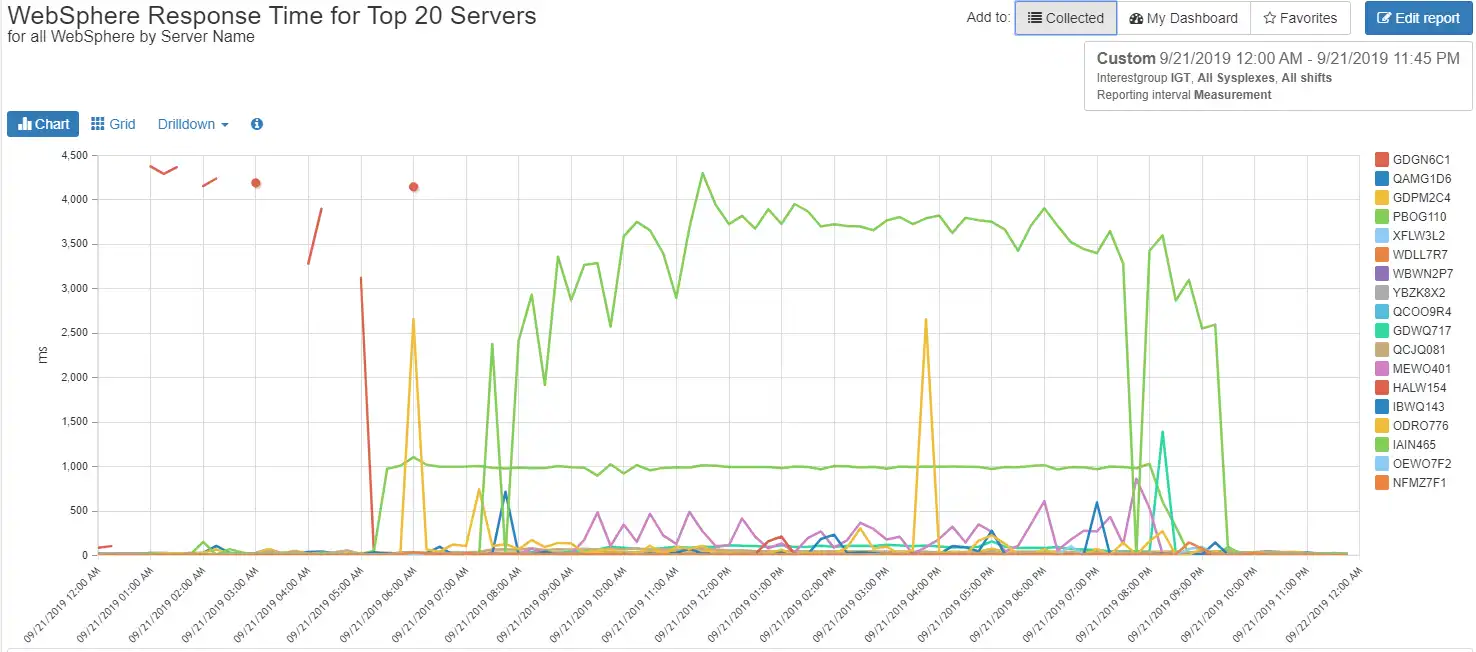 Why does one server have higher response times? You can drill down to the URI level, check the pattern for this server over time, check your WLM goal attainment to see if it’s even an issue – in short, you now have data to investigate things like this!
Response Time Components
We also get a breakdown of the components of response times, which can help you troubleshoot problems.
Transaction rates, response times, and response time components for all transactions:
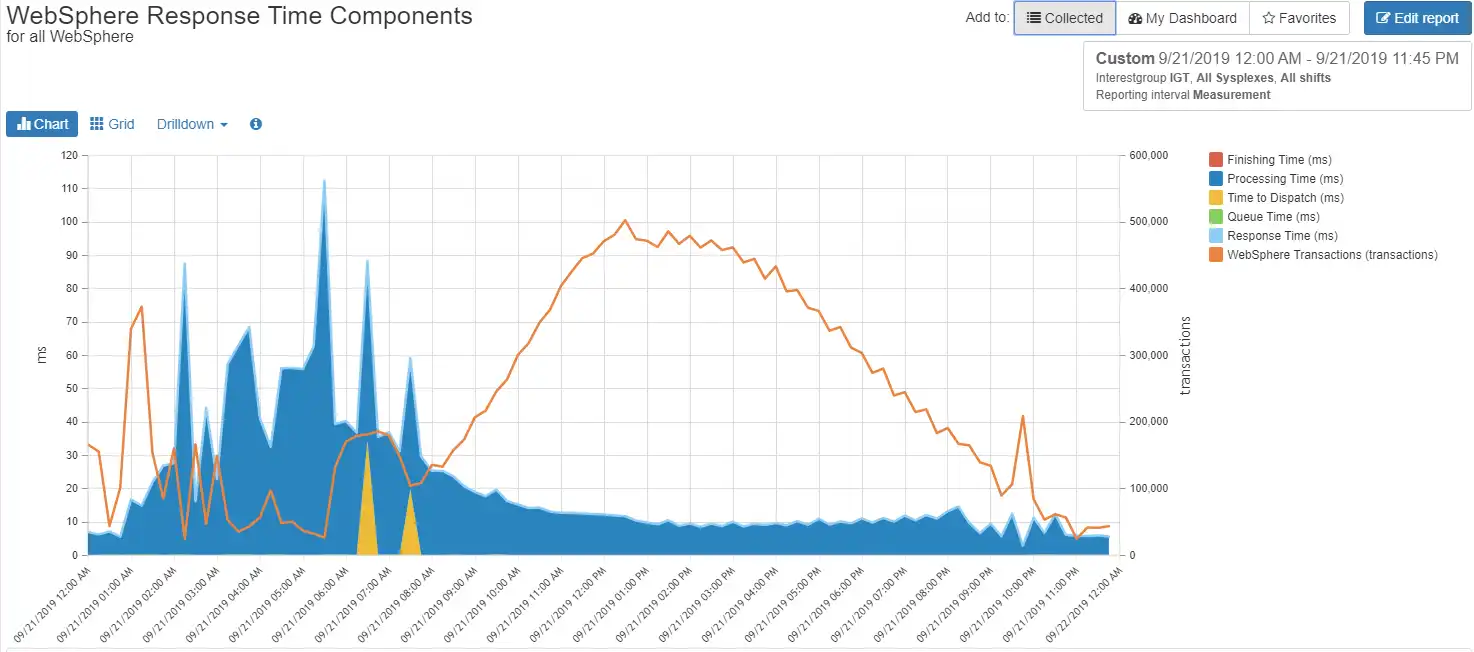 This shows your overall WebSphere environment, for detecting broad trends and issues. The orange line represents transaction rates on the right Y axis.
Top 20 URI’s by Response Time
Or let’s say you want to see the Top 20 URI’s by Response Time:
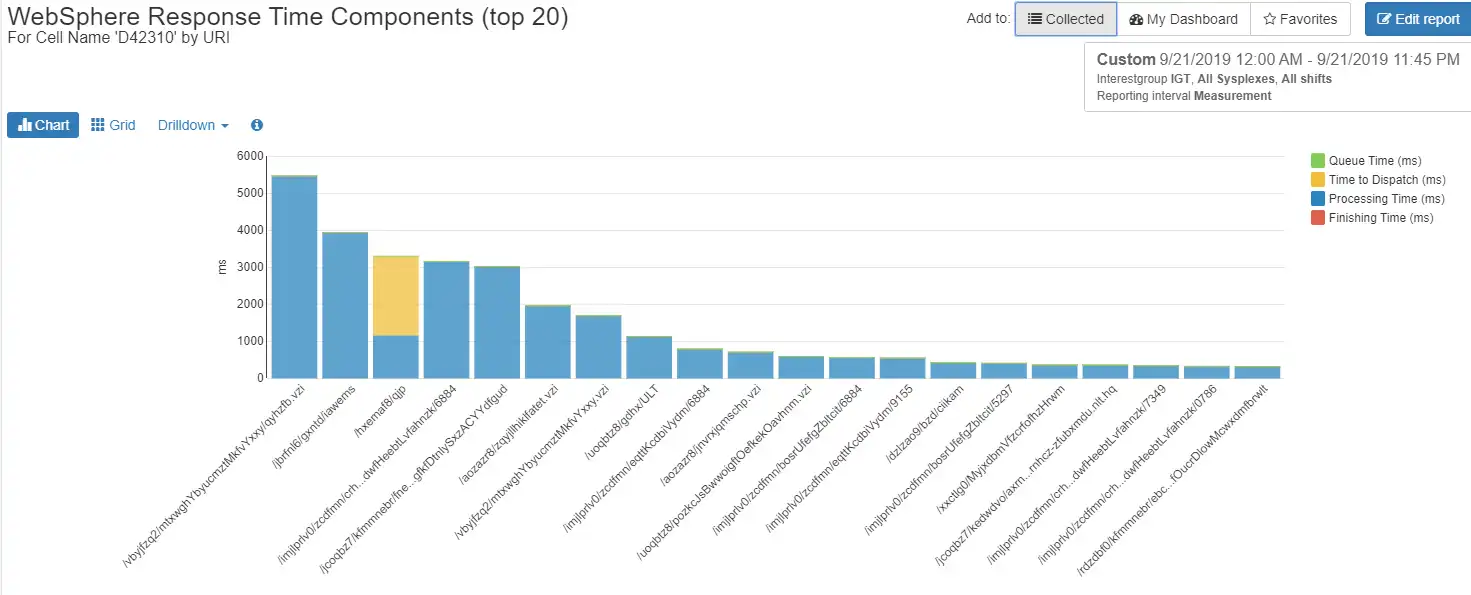 Top 20 URIs for a given Cell, in order of response time. Lets you quickly see which requests might be having performance issues.
Specific URI Over Time
You may want to look at a specific URI over time once you’ve detected an issue:
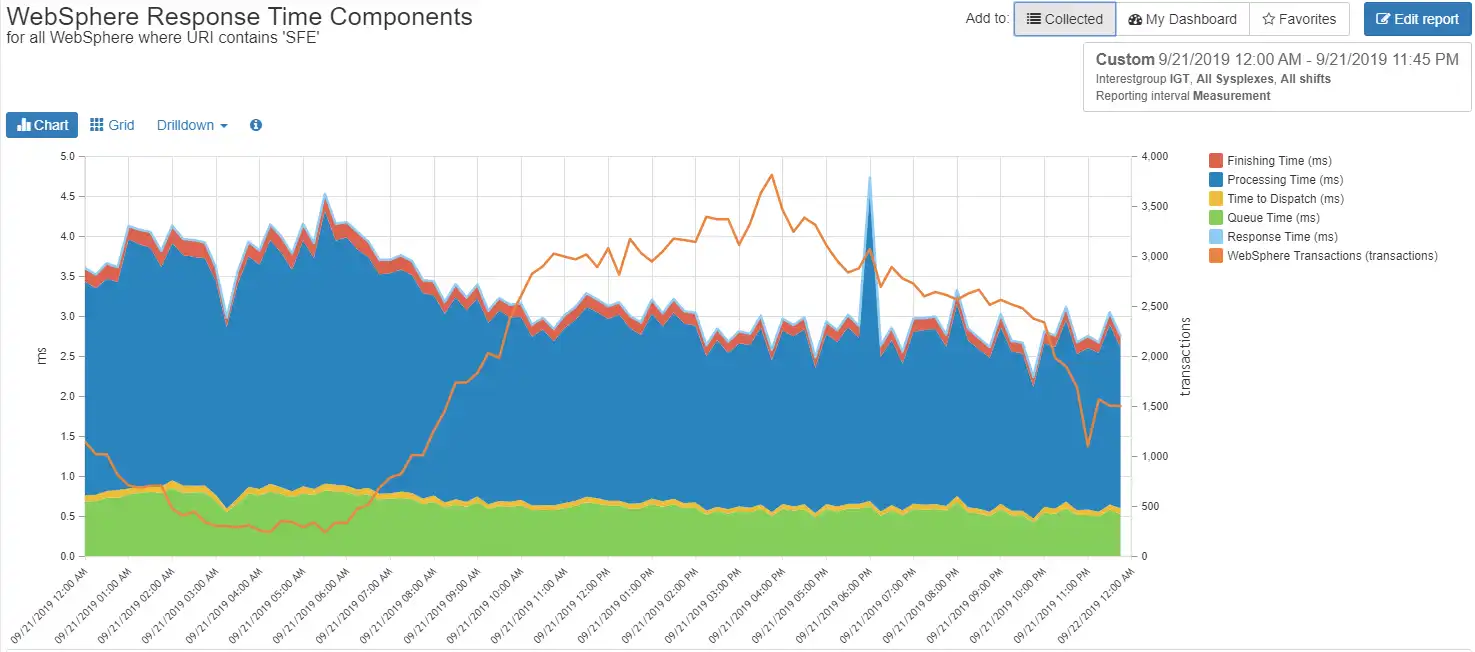 Response time components for a specific URI will give you a solid starting point to investigate problems, along with other available SMF data. Going deeper than this will require other tools, and probably involve other teams in your organization, but now you have data to share with them that effectively narrows the problem space and points them in the right direction.
Additional SMF 120-9 WebSphere Metrics
Other 120-9 data, available in either tabular or chart format, can also help you understand your workloads and narrow the problem space in the event of issues. Minor Code Count, Failed Transactions, Concurrent Transactions, Request Size for input and Response Size for output are all at your fingertips:
![]() Non-zero Minor Code Counts or Failed Transactions are obvious problems. Request Size and Response Size can be useful for tuning/debugging.
Non-zero Minor Code Counts or Failed Transactions are obvious problems. Request Size and Response Size can be useful for tuning/debugging.
Related data in z/OS, CICS and Db2 records
Analysis of WebSphere workloads entails much more than just 120-9 data. To complete the picture, you need a performance management database with data at many different levels: hardware, z/OS, WLM, address space, CICS, Db2, MQ, network, dataset and more.
Although beyond the scope of this blog, IntelliMagic Vision provides the capabilities you need to get a holistic view of your system, as well as drill-down to investigate specific issues. All using the same easy-to-use browser interface and features.
Understanding WebSphere Workloads Like Never Before
There’s an old saying “you can’t manage what you can’t measure.” The SMF 120-9 records give us a great way to measure and understand our WebSphere workloads like never before. IntelliMagic Vision makes it easy. Ask for a demo or begin a trial today.
This article's author
 Dennis Moore
 Share this blog
Related Resources
What's New with IntelliMagic Vision for z/OS? 2024.2
February 26, 2024 | This month we've introduced changes to the presentation of Db2, CICS, and MQ variables from rates to counts, updates to Key Processor Configuration, and the inclusion of new report sets for CICS Transaction Event Counts.
Expanding Role of Sub-Capacity Processors in Today's Mainframe Configurations | Cheryl Watson's Tuning Letter
In this reprint from Cheryl Watson’s Tuning Letter, Todd Havekost delves into the role of sub-capacity processors in mainframe upgrades, providing insights on transitioning to a more efficient CPC.
Why Am I Still Seeing zIIP Eligible Work?
zIIP-eligible CPU consumption that overflows onto general purpose CPs (GCPs) – known as “zIIP crossover” - is a key focal point for software cost savings. However, despite your meticulous efforts, it is possible that zIIP crossover work is still consuming GCP cycles unnecessarily.
Book a Demo or Connect With an Expert
Discuss your technical or sales-related questions with our mainframe experts today