 Joe Hyde -
Assessing Flash Effectiveness
How’s your Flash doing? Admittedly, this is a bit of a loaded question. It could come from your boss, a colleague or someone trying to sell you the next storage widget. Since most customers are letting the vendors’ proprietary storage management algorithms optimize their enterprise storage automatically you may not have had the time or tools to quantify how your Flash is performing.
The Back-end Activity
First, let’s use the percentage of back-end activity to Flash as the metric to answer this question. Digging a little deeper we can look at back-end response times for Flash and spinning disks (let’s call these HDD for Hard Disk Drives). I’ll also look at the amount of sequential activity over the day to help explain the back-end behavior.
Below is 5 weekdays worth of data from an IBM DS8870 installed at a Fortune 500 company. Although it’s possible to place data statically on Flash storage in the IBM DS8870, in this case, IBM’s Easy Tier is used for the automatic placement of data across Flash and HDD storage tiers. Let’s refer to this scheme generically as auto-tiering. For this IBM DS8870, Flash capacity was roughly 10% of the total storage capacity.
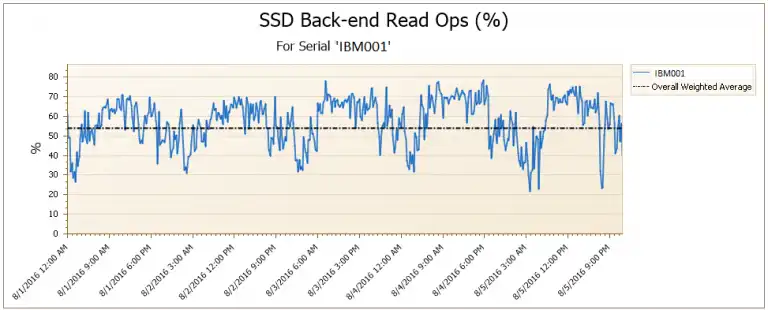
I chose to chart back-end read operations because this is the first order benefit on adding Flash storage to your disk storage system; namely, lowering read miss service time accessing data from Flash as compared with HDD with its inherent mechanical delays of seek and rotational positioning. This chart shows the overall average of roughly 53% for the percentage of reads serviced by Flash, but it is lower during the night time than what we’d classically call “first shift” (e.g., 8 AM-5 PM).
Distribution of I/O Workload on Flash Throughout the Day
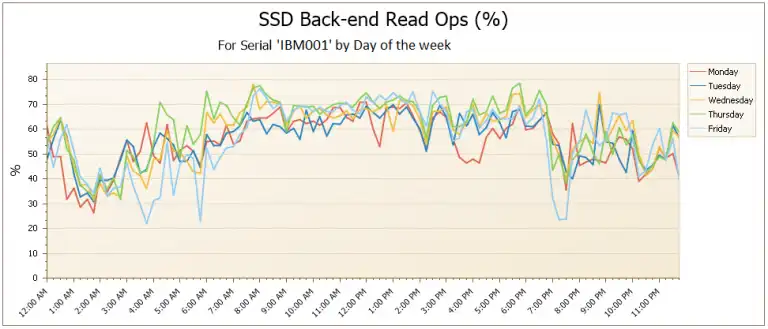
Here’s another easy way to display the data using IntelliMagic Vision and try to answer the question how your Flash is doing. Each day of the week is plotted by time of day on the x-axis. Roughly 7 AM to 6 PM the percent of Flash reads on the back-end is in the low to mid 60’s percentage.
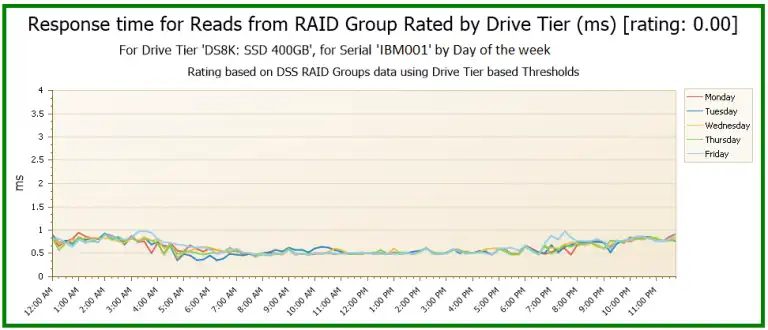
I’ll use this “average by day of the week” charting scheme to take a deeper dive into how the Flash is performing in this environment. Here we see a fairly stable 0.5ms of response time during the first shift with it increasing off shift (5 PM to 8 AM) in the 0.8ms to close to 1.0ms. One might conclude the less you use the Flash, the slower it is.
Distribution of I/O Workload on HDD Throughout the Day
Let’s look at the back-end read response of the HDD in this box.
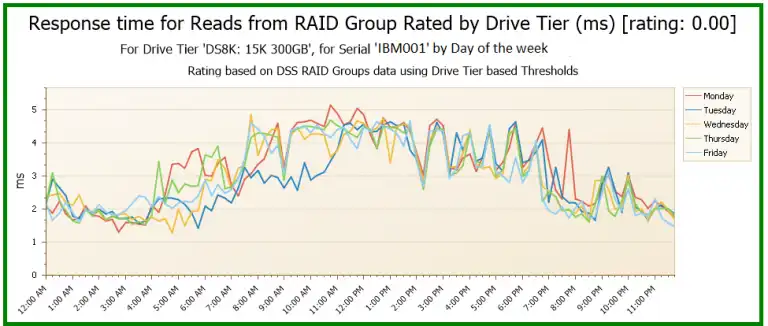
The response time curve over time of day for the HDDs has the opposite bend compared to the curve for the Flash – higher during first shift and lower during off shift.
The Effect of Sequential Activity on HDDs
The 15K RPM disks in this chart show roughly a 4ms read response time during the day and close to 2ms or even a little better off shift. The daytime performance is representative of an expected latency (2ms) plus a modest seek and data transfer time. The night time performance looks to be taking advantage of the HDD’s rotational positional optimization and a change in workload to something perhaps more sequential in nature.
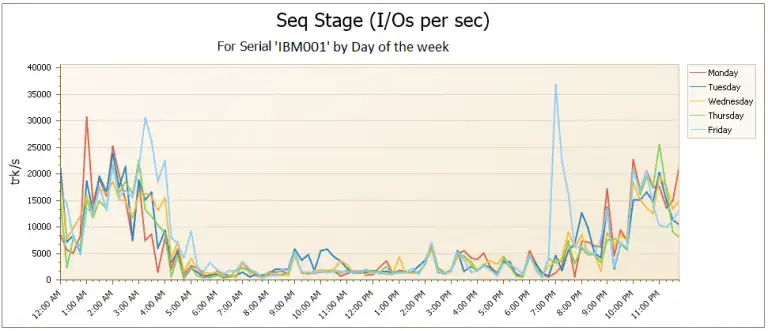
The sequential stage activity over time shows a close correlation of sequential activity lowering the average response time for the HDDs while increasing Flash response times.
Conclusion: Workload Impacts the Effectiveness of your Flash
The benefits of sequential pre-stage for HDDs to reduce seek and latency have no advantage in the Flash world. In fact, increasing the back-end I/O concurrency to take advantage of spinning disk performance just shows increased queuing delays in the Flash. On the surface, it looks like a negative, but the reason for the pre-stage is to stay ahead of the actual read requests on the front-end of the box.
By checking a few charts using IntelliMagic Vision, one can answer the question about how Flash is performing. In this case, with auto-tiering enabled and Flash accounting for 10% of the storage capacity more than half the reads are to Flash. Additionally, two-thirds of the reads use Flash at an 8x response time improvement on the backend when Flash is needed most – during first shift.
How’s your Flash doing? Contact us if you would like to discuss how your Flash is doing with one of our experts.
This article's author
 Joe Hyde
 Share this blog
Related Resources
Should I Disable SVC Write Cache for Flash?
It has been suggested that in order to maximize throughput for large sequential operations on SVC volumes residing entirely on IBM Flash systems, you should consider disabling the write cache.
How Much Flash Do I Need Part 2: Proving the Configuration
Modeling how current and future workloads will handle your storage configuration is especially useful before making a costly Flash purchase.
How Much Flash Do I Need? Part 1
Flash has many benefits, but it's still costly. This blog demonstrates how it is possible to determine how much Flash is important to add, and how much would be a wasted spend.
Book a Demo or Connect With an Expert
Discuss your technical or sales-related questions with our mainframe experts today