
Finding the root cause of z Systems performance issues may often feel like falling down a dark and endless rabbit hole. There are many paths you can take, each leading to further possibilities, but clear indicators as to where you should really be heading to resolve the problem are typically lacking. Performance experts tend to rely on experience to judge where the problem most likely is, but this may not always be adequate, and in the case of disruptions, time is money.
Performance experts with years of experience are more likely able to resolve problems faster than newer members of the performance team. But with the performance and capacity skills gap the industry is experiencing, an approach is needed that doesn’t require decades of experience.
Rather than aimlessly meandering through mountains of static reports, charts, and alerts that do more to overwhelm our senses than assist in root cause analysis, performance experts need a better approach. An approach that not only shines a light down the rabbit hole, but tells us which path will lead us to our destination.
Root Cause Analysis in z Systems Performance – Where to Begin?
Perhaps the most crucial step to uncovering the root cause of a z Systems performance disruption is determining where to begin. You may have a hunch or underlying assumption about the source of a problem, but a mistake at this critical first step may plunge you deep into the rabbit hole for hours, only to discover that you had wasted all that time.
IntelliMagic Vision begins the root cause analysis process with a high level “Warnings and Exceptions” table which gets us started right where it matters most. The example below is for Coupling Facilities.
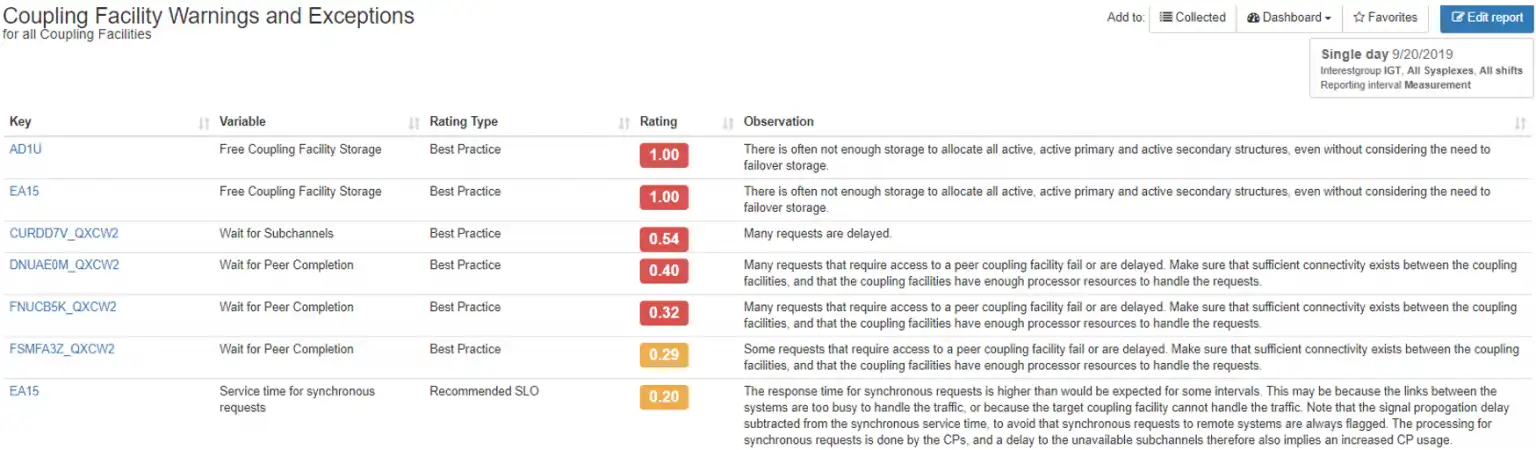
This view alerts us to all CF components that have exceptions (highlighted red), indicating likely disruptions, and warnings (highlighted yellow) about potential issues we may not even know about.
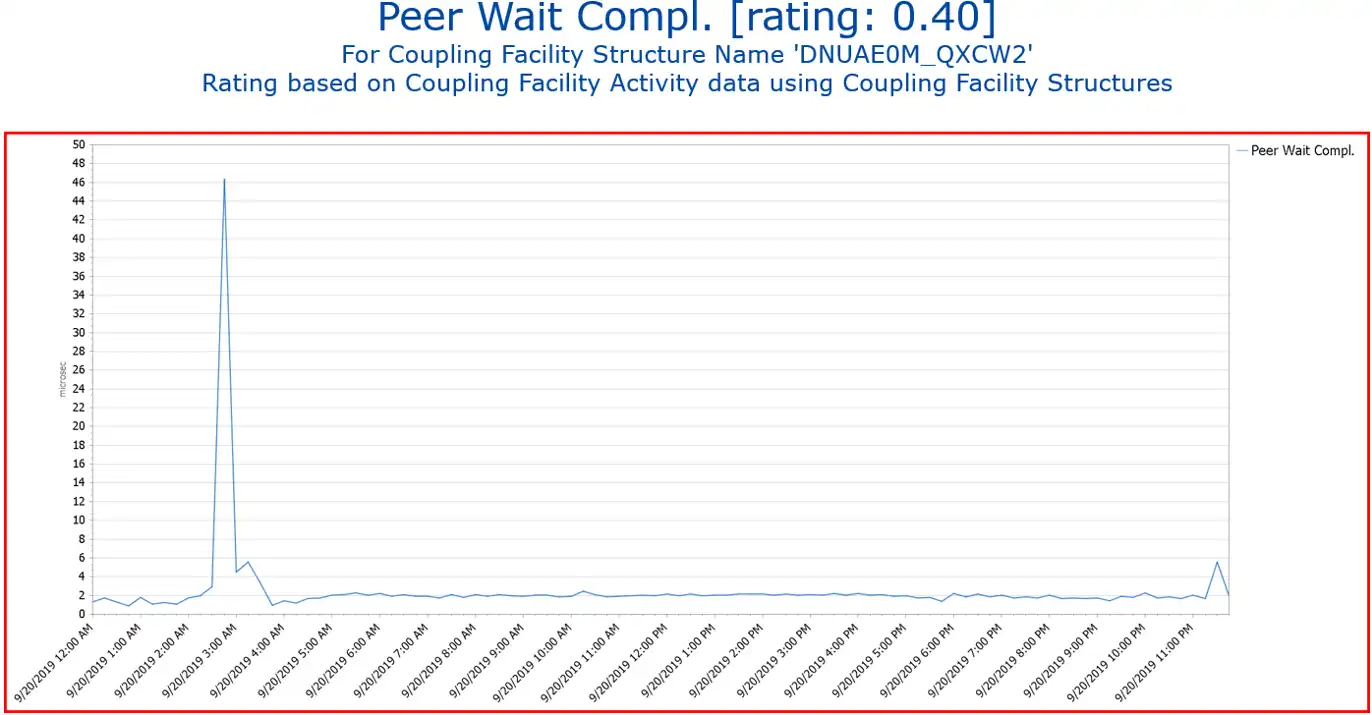
In addition to the prioritized exception table, we are offered Observations for what is likely causing the issue and what we can do about it. For example, the Observations for the “Wait for Peer Completion” report, says, “Many requests that require access to a peer coupling facility fail or are delayed. Make sure that sufficient connectivity exists between the coupling facilities, and that the coupling facilities have enough processor resources to handle the requests”
We are immediately shown what all current and upcoming issues are from this single view, and specifically what is causing them. Much of the root cause analysis is done in the first step.
By clicking on any of the reports, we are taken to the report with the exception or warning. Let’s drill down to the Wait for Peer Completion report.
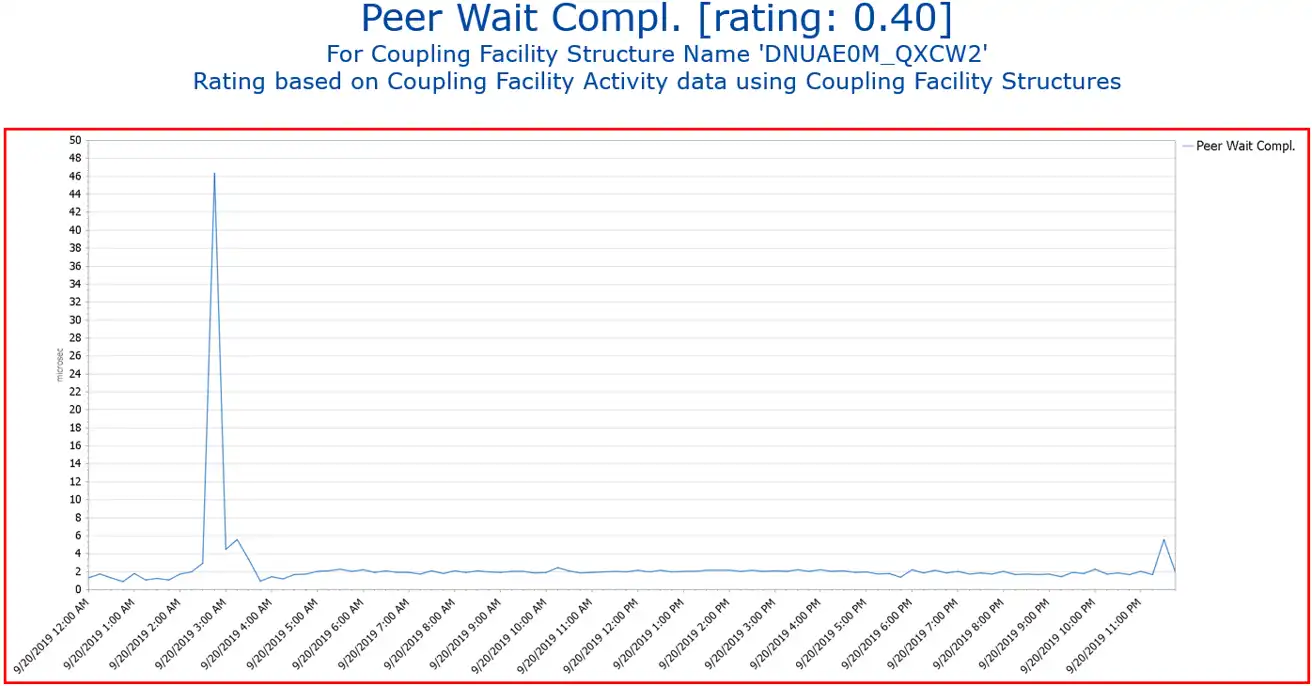
In this view we can see the Peer Wait Completion for a coupling facility structure, and indeed, the response time spiked early in the morning and is significantly exceeding the threshold.
From Overall Health to Specific Issues
Another way to determine the root cause of performance issues is to begin at the Coupling Facility Health Insights Reports, such as the Health Insight for Coupling Facility by Structures. Rather than always needing to return to the exception dashboard to resolve issues, it’s important to be able to see issues while examining overall health and performance. This view below represents all of the structures in the environment and gives a good indicator of the overall health.
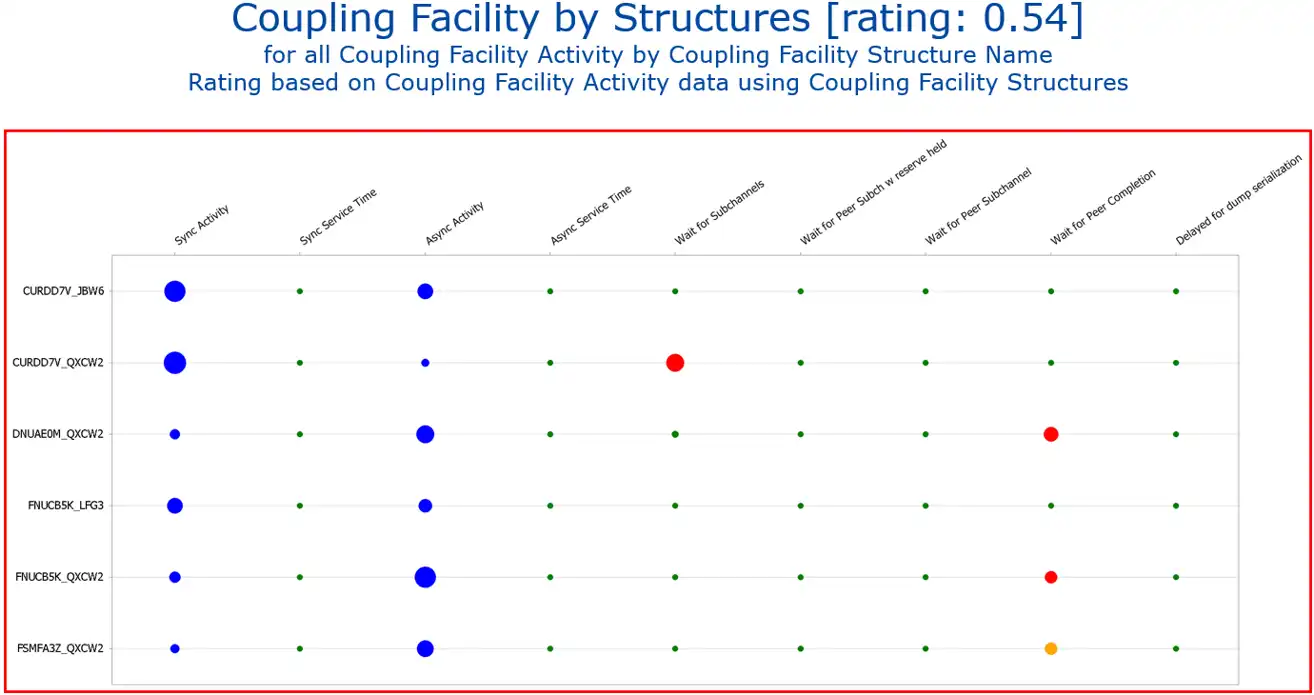
Using the basic color scheme of green means good, yellow is a warning, and red is an exception, we immediately see that there are performance issues occurring right now. The color of the icons, as well as the frame surrounding the report, comes from the rating, in this case 0.54. We do not need to interpret the rating at this stage because the color scheme does that for us. (Blue icons indicate metrics that don’t warrant a rating.)
Looking at the key metrics above the rated icons, we see that there is clearly an issue in Wait for Peer Completion for several Structures.
The rated health insights report turned some lights on in this rabbit hole, and the red bubbles tell us exactly which paths to go down – clicking on the red bubble takes us to the next step.
The Paths Begin to Multiply
The reason root cause analysis is so tricky is because of the sheer number of possibilities. z/OS Systems performance analysis has continued to grow in complexity while the old tools and methods for monitoring and managing them have remained static and stagnant.
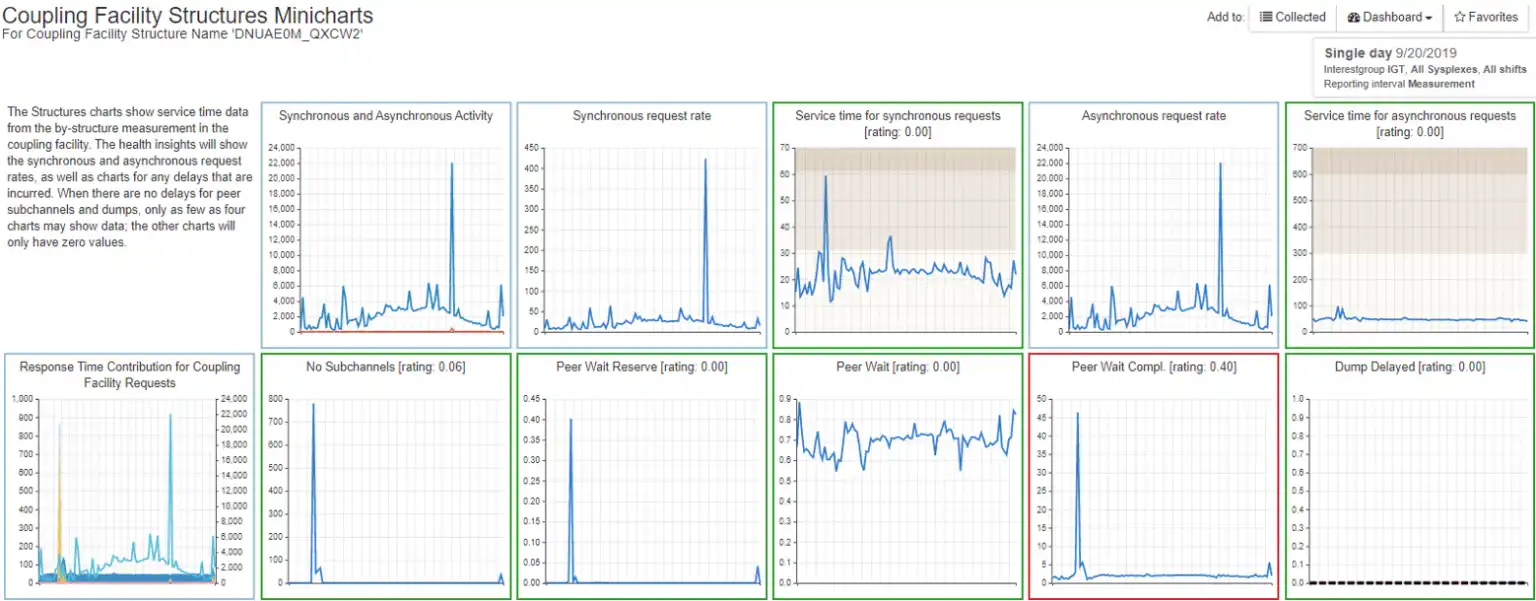
After clicking on the red icon in the previous chart, we see a set of minicharts representing all of the various components and key metrics of the structure. Like the overview dashboard, many of these charts are rated to tell us where to investigate further.
Drill Downs Result in Root Cause Discovery
We can continue with the root cause analysis by drilling down into the chart with the red border. You can see that we navigated to the same report that we saw in the initial exception report.
During the time period seen at the bottom of the chart, this structure crossed the exception threshold for a significant enough amount of time to generate the red border and high rating.
And thanks to the recommendations from IntelliMagic Vision, we know that to resolve this problem. We need to make sure that sufficient connectivity exists between the coupling facilities, and that the coupling facilities have enough processor resources to handle the requests. A z/OS Systems performance expert may take this knowledge for granted, but a novice to the industry may greatly benefit not only from quick drill down capabilities, but from recommendations within the field descriptions.
Optimize z Systems Performance Root Cause Analysis – Eliminate the Rabbit
Root cause analysis can be a painful process when you’re running blindly down a rabbit hole of data. With the right tools and a modernized approach to monitoring and managing your infrastructure, most of your time isn’t spent finding the problem but in resolving the problem. Or even better, preventing problems altogether. This lets you get back to what’s important in your job and away from constant fire-fighting.
Reporting on Coupling Facility Health and Performance
This white paper demonstrates how to effectively monitor the coupling facilities in your environment and automatically highlight any developing problems.
This article's author
 Jerry Street
 Share this blog
You May Also Be Interested In:
What's New with IntelliMagic Vision for z/OS? 2024.2
February 26, 2024 | This month we've introduced changes to the presentation of Db2, CICS, and MQ variables from rates to counts, updates to Key Processor Configuration, and the inclusion of new report sets for CICS Transaction Event Counts.
A Mainframe Roundtable: The SYSPROGS | IntelliMagic zAcademy
Discover the vital role of SYSPROGs in the mainframe world. Join industry experts in a concise webinar for insights and strategies in system programming.
What's New with IntelliMagic Vision for z/OS? 2024.1
January 29, 2024 | This month we've introduced updates to the Subsystem Topology Viewer, new Long-term MSU/MIPS Reporting, updates to ZPARM settings and Average Line Configurations, as well as updates to TCP/IP Communications reports.
Book a Demo or Connect With an Expert
Discuss your technical or sales-related questions with our mainframe experts today