
Easy to Use Storage Capacity Forecasting Tool with Advanced Analytics
With traditional storage burn rate and capacity planning tools, forecasting when you’re going to run out of storage is time consuming and challenging. By utilizing an interactive GUI interface with an advanced AI-based statistical analytics engine, IntelliMagic Vision for SAN provides a simple but powerful means to forecast your storage capacity at multiple levels, be it at the storage array or at the different storage pools and storage tiers that you have configured in your environment.
In this video we explain how you can use IntelliMagic Vision’s storage capacity forecasting feature to effectively predict your future capacity needs.
Video Transcript
Hi, I’m Tim Chilton, Senior Consultant at IntelliMagic, and I’d like to spend the next few minutes giving you a brief overview of our storage capacity forecasting feature. We have an entire set of reports dedicated to capacity forecasting at multiple levels, be it at the storage array or at the different storage pools and storage tiers that you have configured in your environment.
DSS Capacity Forecasting and Planning
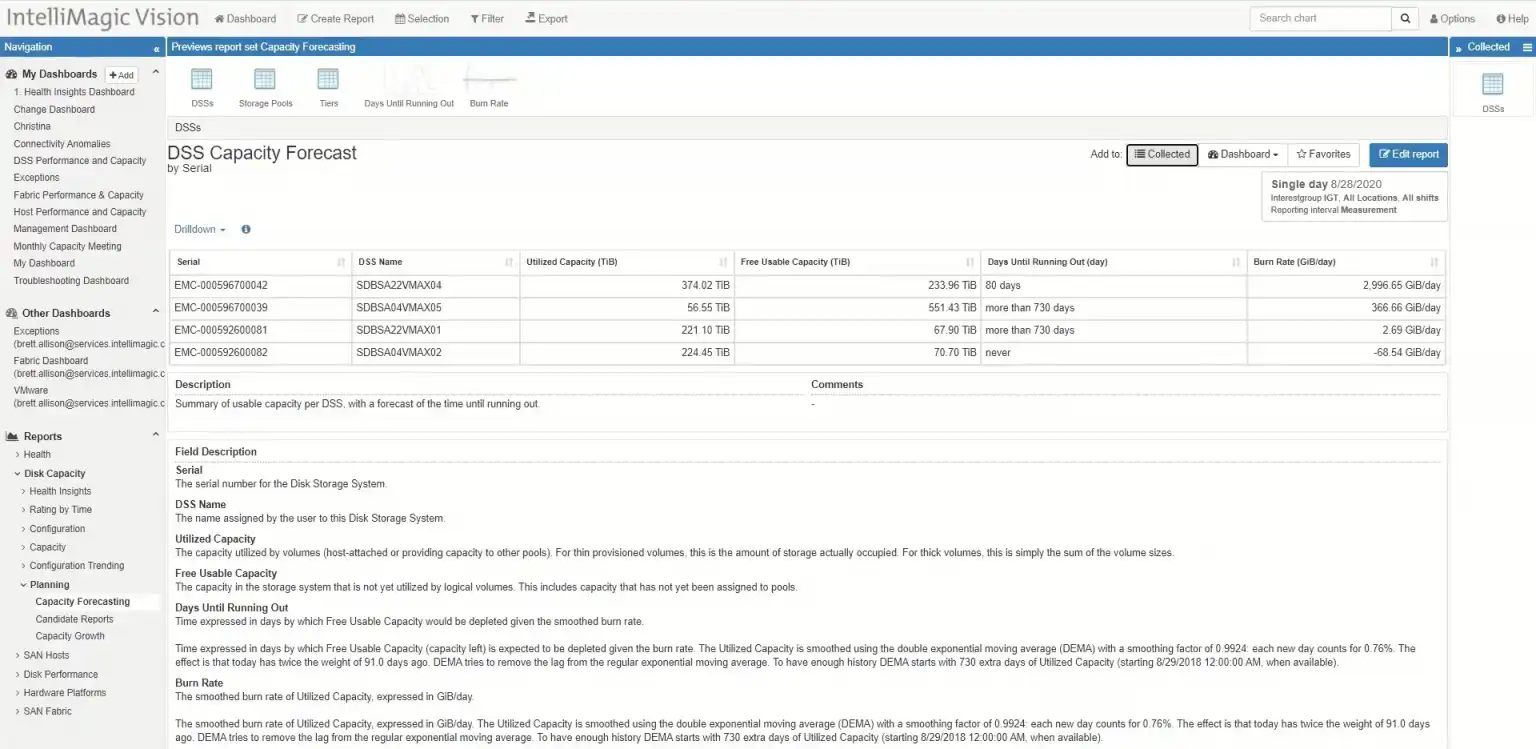
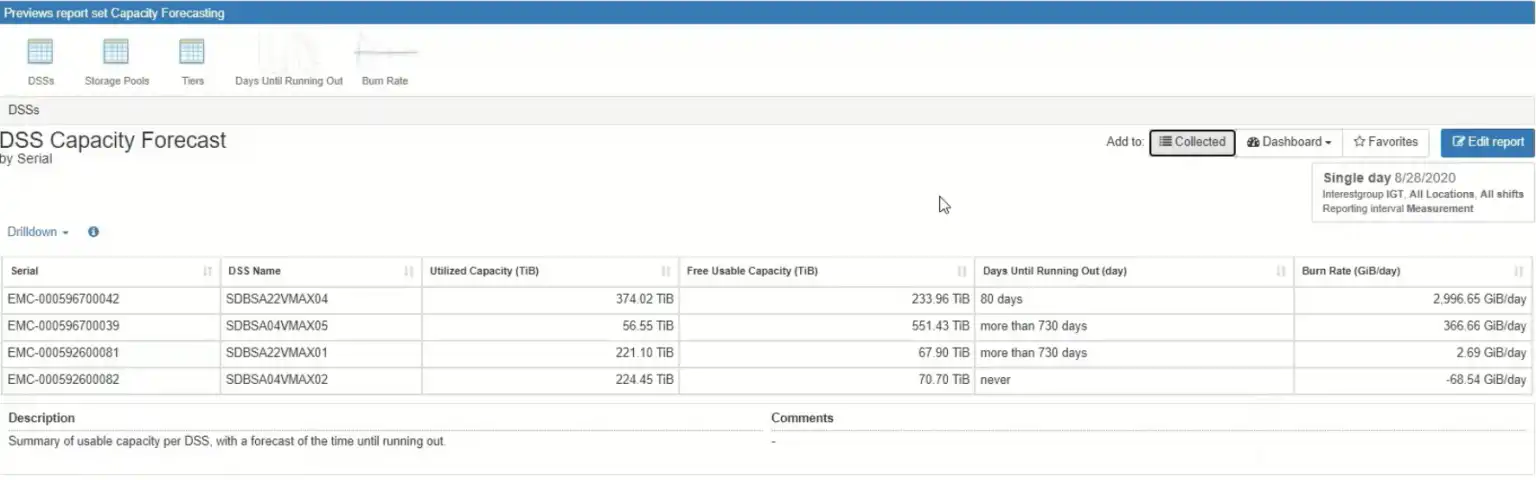
When you look at storage capacity at the storage array level, we give you the serial number of the array, its name, its utilized and reusable capacity, its burn rate, and a predicted number of days until the array is running out of data. And this prediction is done using a sophisticated algorithm that looks at consumption for the past 730 days, but gives more weight to the most recent data. This allows both historical organic burn rate, as well as the most recent burn rates to be considered during the prediction.
If the number of days until the array runs out of data is greater than 730 days, we just indicate this as greater than 730 days. If it’s less than 730 days as in this one here with 80 days until running out of data, we indicate the current predicted days until it’s out of storage. And if you have a negative burn rate, in other words, if you’re getting free usable space back, then you’ll already, obviously never run out of space at that burn rate, so we indicate it as “never.”
Negative Storage Burn Rates Show as “Never” Under “Days Until Running Out”
In this example, the array with the highest burn rate and the smallest amount of days until running out is VMAX04 here with 80 days until it’s predicted to run out of space. From here, we can drill in to see which of the configured storage pools are contributing to that high burn rate.
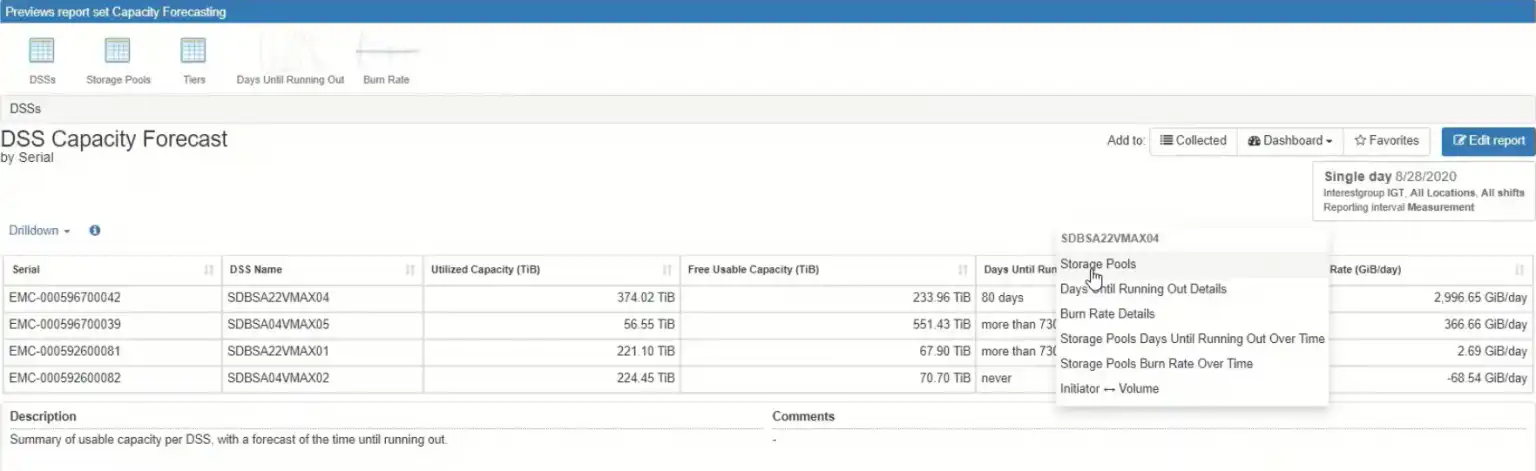
Drill Downs Enable Instant Root Cause Analysis and Next-Level Reporting
And you see there’s only one storage pool configured. So its days until running out and its burn rate will match that of the DSS.
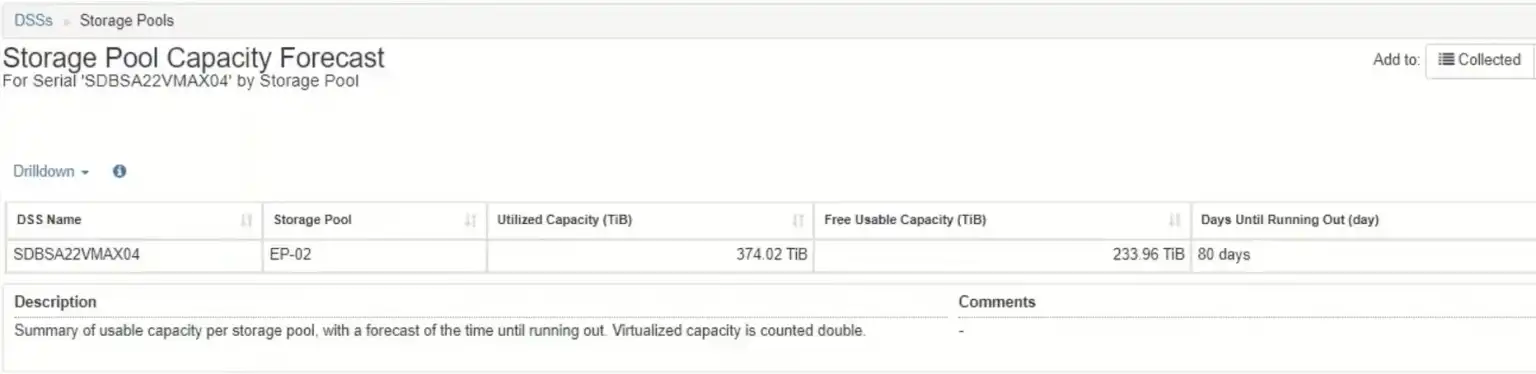
Storage Pool Capacity Forecast
If you’d like to see more detail into how capacity is being consumed in this particular storage pool, you can drill into the “Days Until Running Out Details” chart.
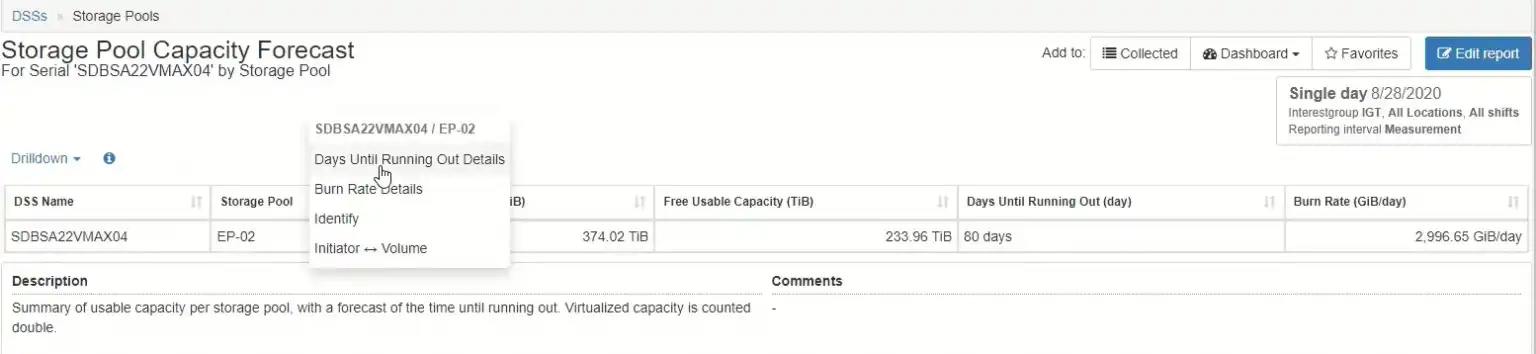
Drill Downs from Storage Pool to Further Burn Rate Details
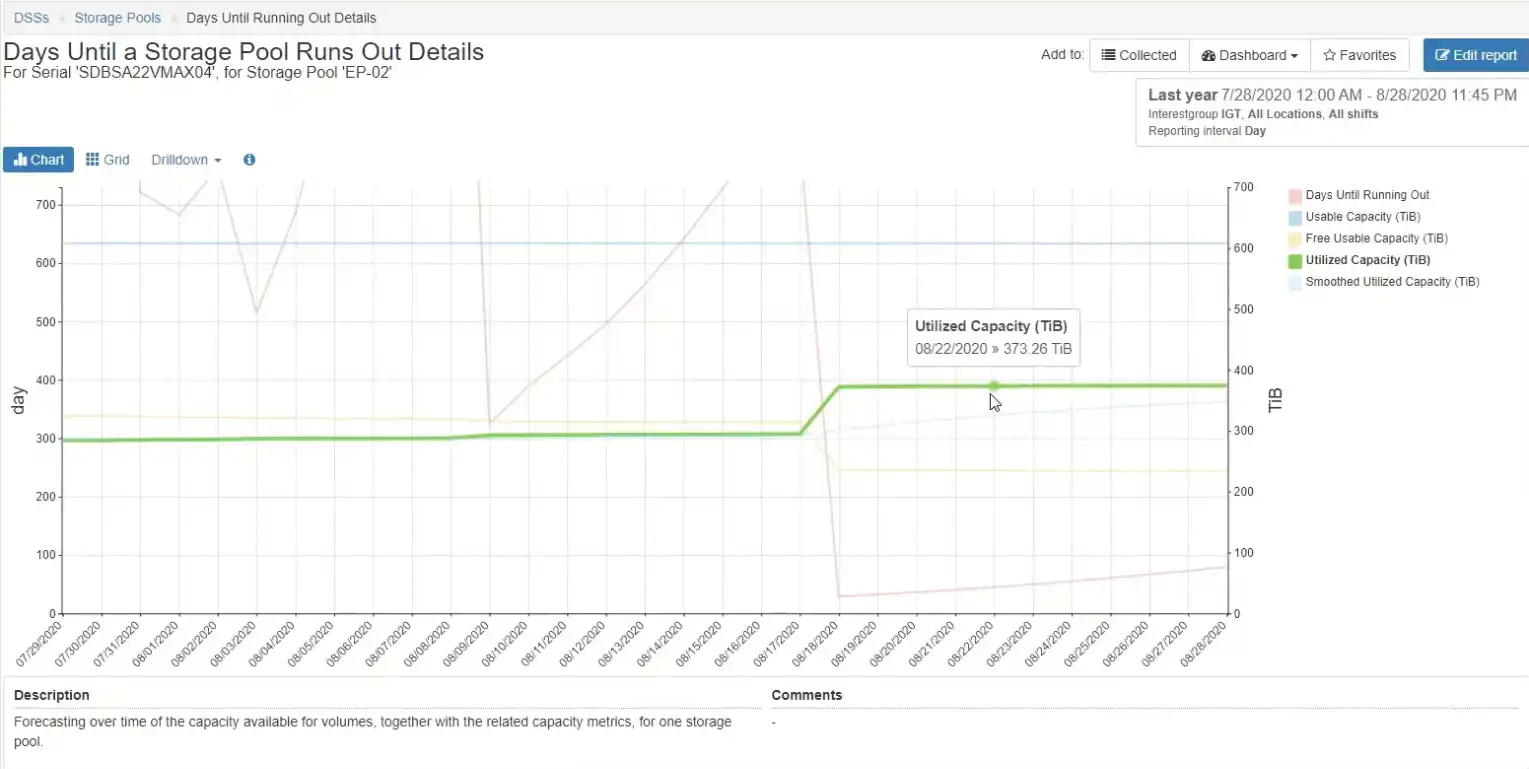
This chart has a lot of densely packed information, so I’ll walk you through the chart itself. First, you have a flatline for the usable capacity, which is to be expected unless you’ve recently added capacity to the storage pool. The yellow line shows you the free usable capacity, and you notice that there’s a sharp decrease in the amount of usable capacity between the 17th and the 18th.
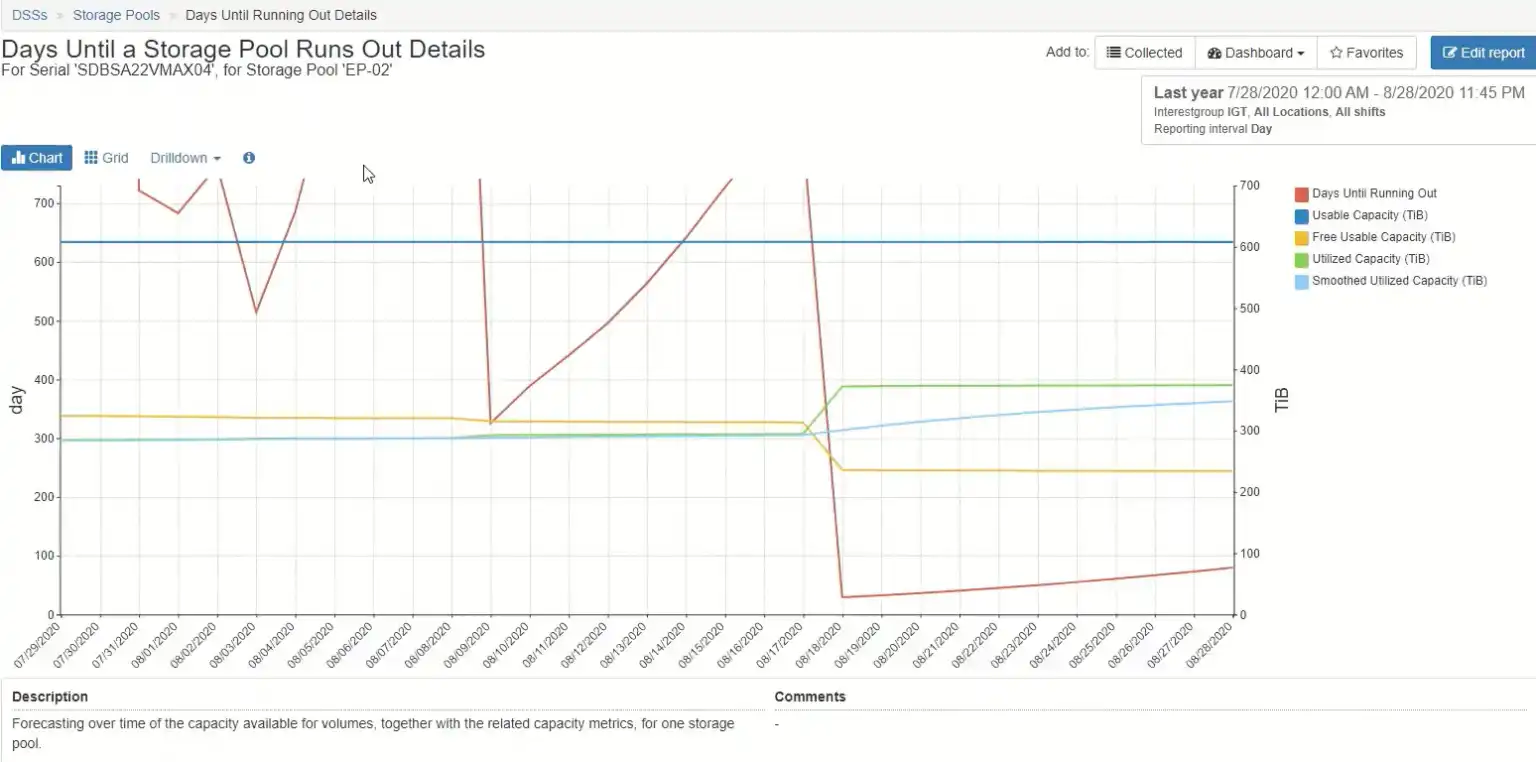
Days Until Storage Pool Runs Out with Usable and Utilized Capacity
The green line shows you the related increase in utilized capacity during that same time period.
The light blue line is your smooth utilized capacity.
But the more important line on this chart is your days until running out, the red line.
And you’ll notice that for most of this chart, you’re well above 730 days until time is running out until you reach this part here where the utilized capacity went up sharply.
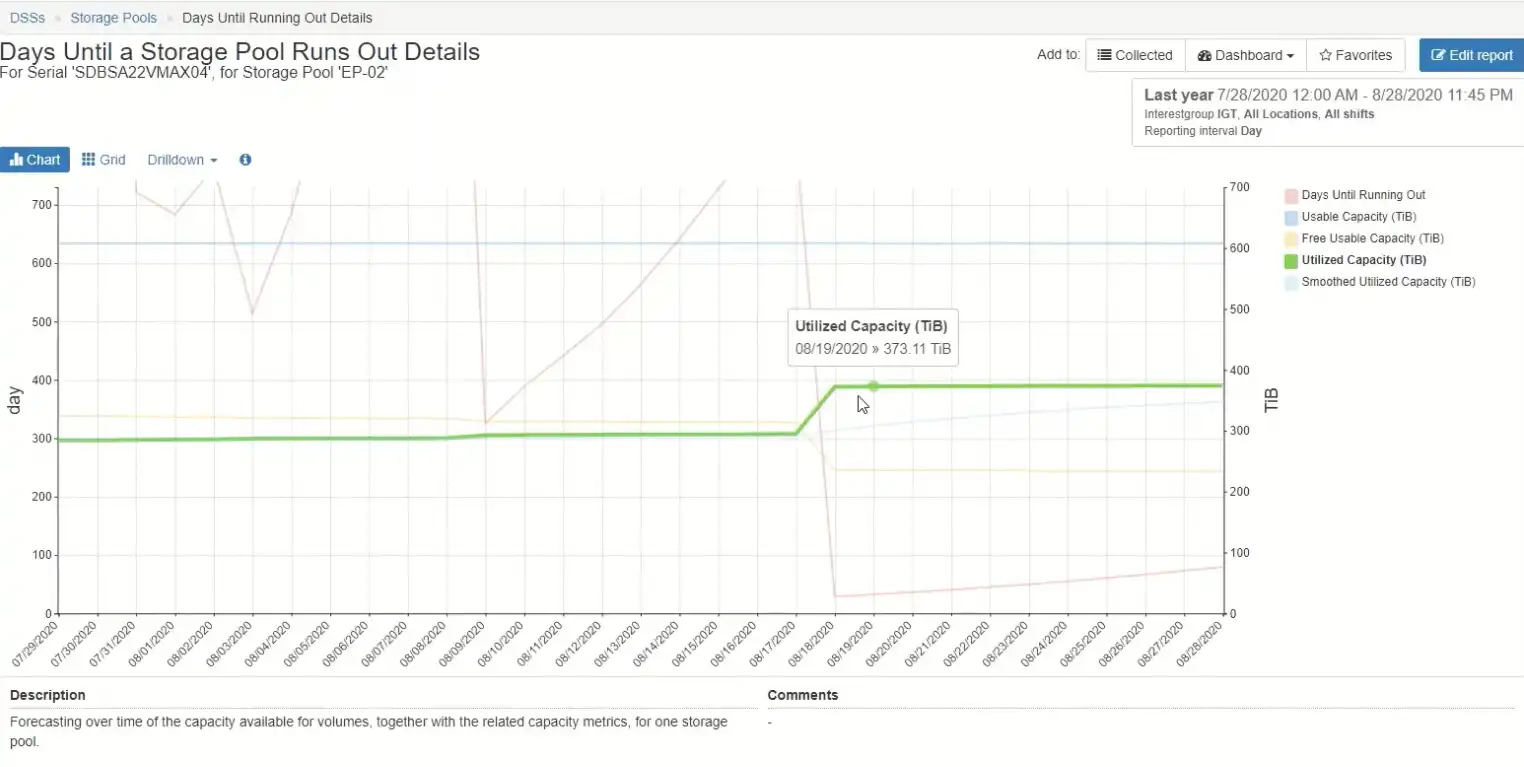
Utilized Capacity Spike
That caused, based on that high burn rate during that period of time, your days until running out to go down as low as 29.14 days.
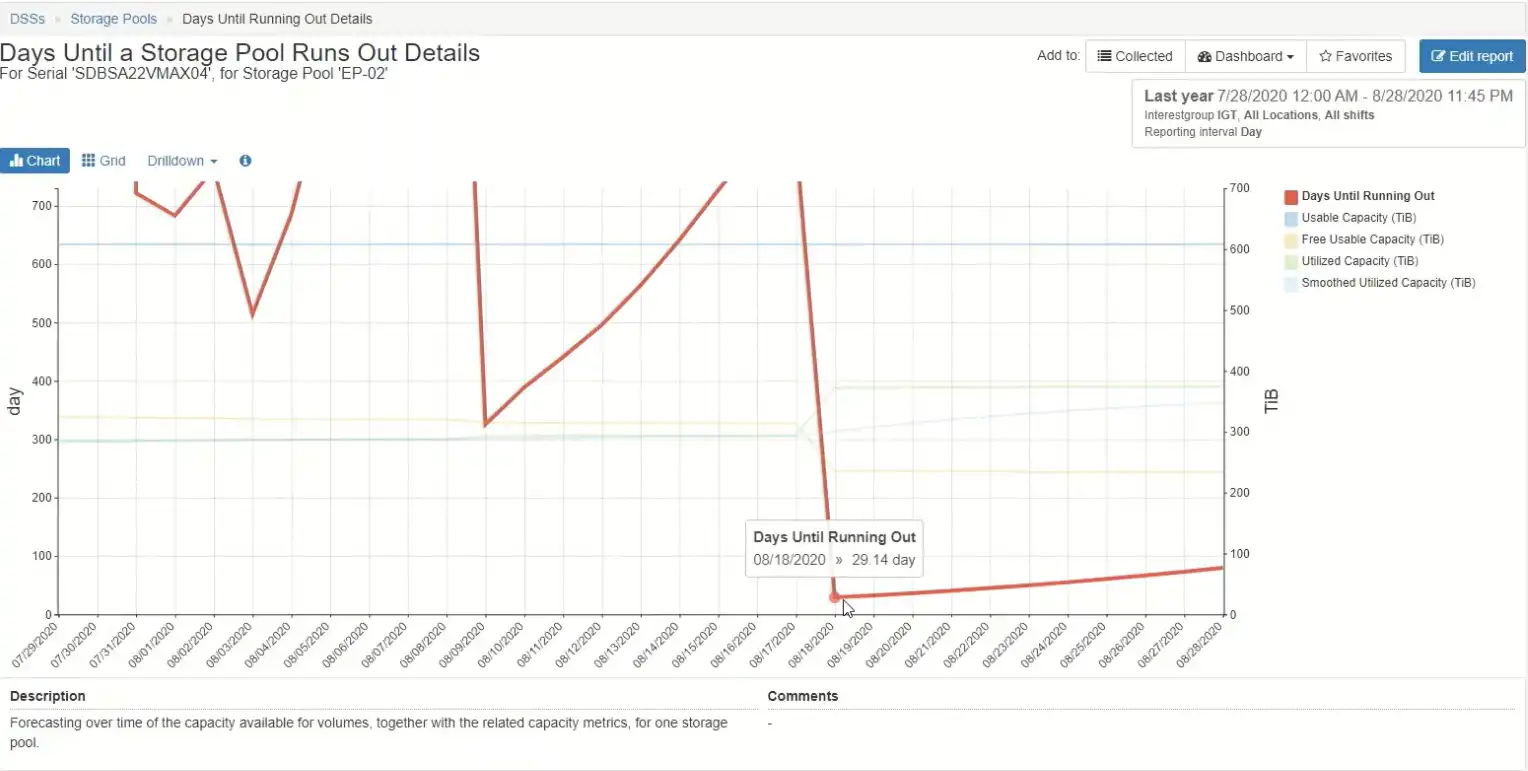
Spike in Utilized Capacity Drop in Days Until End of Usable Storage
And then as your utilized capacity outlay period has ended and you’re on a more organic growth period, you’ll see the dates until running out slowly go up until it levels out to the same organic growth pattern that you’re seeing here in utilized capacity.
Steady Utilized Storage Capacity
And bear in mind that IntelliMagic vision gives you the ability to start at the storage pool level, or you can look at capacity for the different tiers that you may have configured in your environment, just depending on what angle you want to come at, looking at your storage capacity forecasting is. So that was just a really quick overview showing you some of the capabilities of our storage capacity forecasting feature. I hope you found this video interesting and a good use of your time. Thanks a lot and have a great day.
Related Resources
Should There Be a Sub-Capacity Processor Model in Your Future? | IntelliMagic zAcademy
In this webinar, you'll learn about the shift towards processor cache efficiency and its impact on capacity planning, alongside success stories and insights from industry experts.
Overcoming Capacity Management Challenges for Accurate Burn Rates and Forecasting
Discover how to overcome capacity management challenges for more accurate capacity forecasting and burn rates.
How to Accurately Forecast Storage Capacity Burn Rates
Accurately predicting storage utilization and consumption rate can be a challenge, especially in dynamic environments. Letting AI handle the manual report generation ensures up to date storage consumption predictions.
Request a Free Trial or Schedule a Demo Today
Discuss your technical or sales-related questions with our availability experts today