
[This is an abbreviated version of an article I wrote for Cheryl Watson’s Tuning Letter 2020 No. 1. Follow this link to read the entire article on “Learning From SMF – MQ Statistics” republished with Watson & Walker’s permission.]
Brief Introduction to MQ and MQ SMF Data
IBM MQ is an enterprise messaging middleware product that enables chunks of data (“messages”) to be sent asynchronously between loosely coupled applications which may reside locally or on separate platforms across a network. MQ manages and organizes these messages into “queues”.
In a messaging environment, each program that makes up part of an application performs a well-defined, self-contained function in response to a specific request. To communicate with another program, a program puts a message on a predefined queue. The other program retrieves the message from the queue, and processes the requests and information contained in the message. We can think of message queuing as a highly flexible style of program-to-program communication.
Of course, this just scratches the surface of how MQ operates. Readers not familiar with MQ and interested in more information are encouraged to consult the IBM MQ Product Overview manual, which provides a general overview of MQ, as well as a section specifically about MQ on z/OS.
MQ Statistics (SMF 115) and Accounting (SMF 116) Data
There are two primary types of MQ SMF records, MQ Statistics (SMF 115) and MQ Accounting (SMF 116). Statistics records report metrics at the MQ queue manager (or “subsystem”) level, including by buffer pool for buffer-related metrics. Statistics records are produced periodically at a time interval specified by the STATIME parameter, or at the SMF global accounting interval if you specify zero for STATIME. These records are lightweight and have negligible CPU cost, so sites typically generate MQ Statistics records on an ongoing basis.
MQ Accounting records provide a much greater level of detail, including data by queue name, connection type, and connection (address space) name. This results in a volume of SMF data that leads many sites to only generate this data on a periodic basis.
Readers familiar with Db2 SMF data may recognize this organization of MQ SMF data into Statistics (at the subsystem level) and Accounting (by connection type and name). (To further highlight the similarities, the SMF record layouts and field names for Log Manager data in the Db2 SMF 100 and MQ SMF 115 records are almost identical.)
Interpreting and Deriving Value from MQ Statistics SMF 115 Records
The scope of this article is to introduce the types of insights available through MQ Statistics SMF 115 records. A future Tuning Letter article will examine MQ Accounting SMF 116 data.
Visibility into MQ Statistics data can help profile your workload, and may also point to issues with queue manager components such as buffer pools, logging, and virtual storage. Investigating other types of problems will often require detailed data only found in the MQ Accounting records.
This article will explore MQ Statistics data from SMF 115 records using examples from these MQ components:
- Buffer Manager
- Message Manager
- Log Manager
- Storage Manager
Other MQ components that also produce SMF data and may be of interest for additional analysis include Data Manager, Coupling Facility Manager, Db2 Manager, Topic Manager, and Lock Manager.
MQ Buffer Manager
As is the case for Db2, responsive performance from MQ relies on data residing in memory, so the MQ queue manager uses buffer pools to minimize I/O activity. Thus, buffer pool management is an important aspect of managing MQ performance.
MQ has a Deferred Write Process (DWP) that is activated when a buffer pool reaches 85% full. When that condition is reached, DWP will start to write the oldest data from the buffer pool out to disk, freeing up buffer pool pages for application activity. This asynchronous activity will continue until the buffer pool usage drops below 75% full. This is particularly undesirable for short-lived messages.
If the rate of data being put onto the buffer pool exceeds the rate that DWP can write to disk and the buffer pool usage reaches 95% full, then synchronous writes occur, which can increase the elapsed time that an application takes to PUT a message. And in any case, messages that have remained in a buffer pool for three checkpoints will be written to disk, no matter what the utilization of the pool may be.
These processes suggest that Buffer Manager metrics of interest will include percent buffer pool utilization, frequency with which the Deferred Write and Synchronous Write thresholds occur, and occurrences when a queue manager reads data from disk (indicating that it was previously destaged from a buffer pool).
As an example, Figure 10 shows the IntelliMagic Vision Health Insights screen that assesses the Buffer Manager metrics against best practices thresholds, initially by Queue Manager.
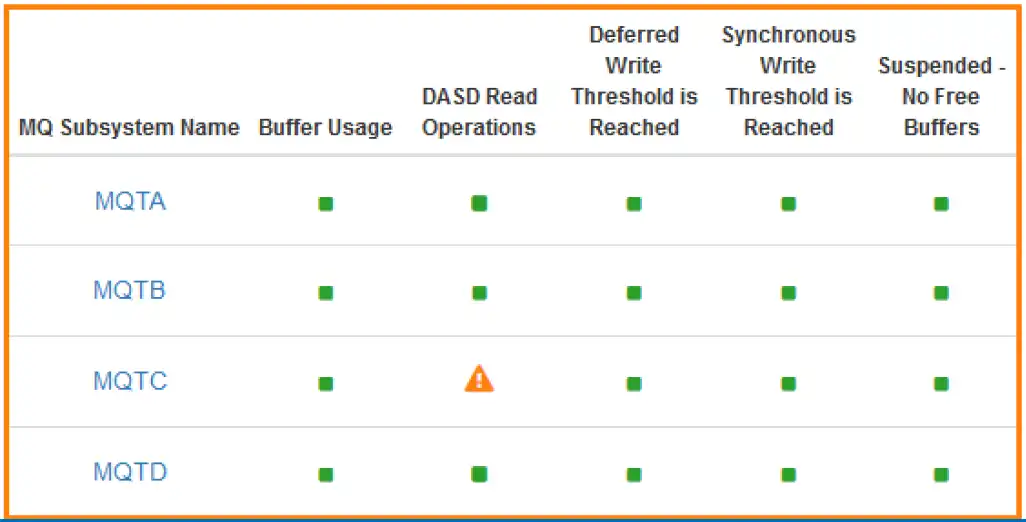
Figure 10: MQ Buffer Manager Health Insights by Queue Manager
And Figure 11 shows how you could then drill down by buffer pool within that Queue Manager.
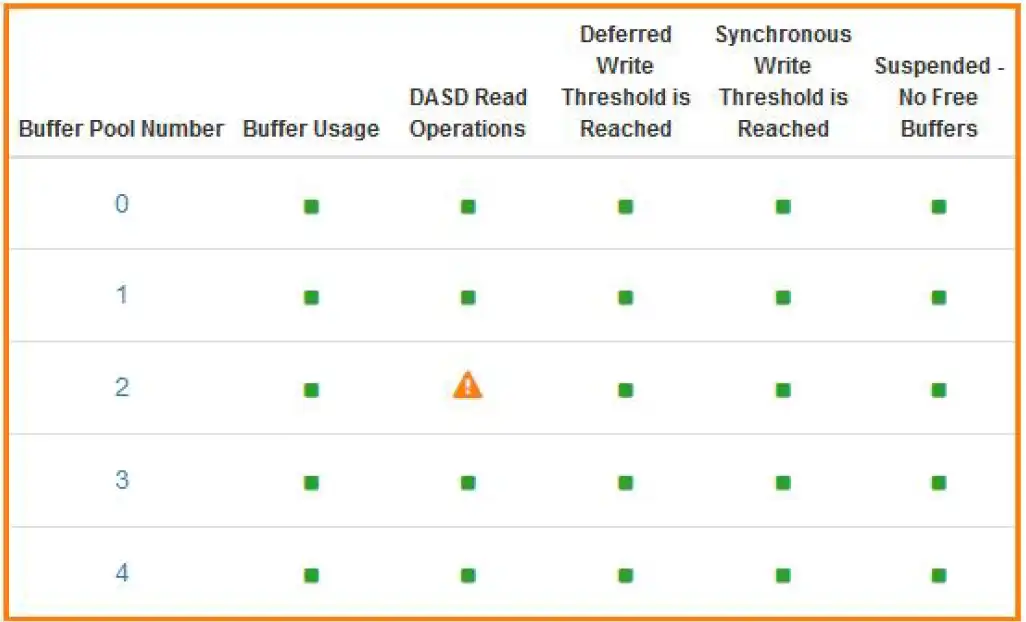
Figure 11: Health Insights – Drilldown by Buffer Pool for MQTC
Views of buffer pool utilizations over time can indicate when these values are approaching the previously mentioned thresholds. In Figure 12, buffer pool 4 is periodically “flirting” with the 85% threshold that would trigger asynchronous destaging, and may warrant the definition of additional buffers.
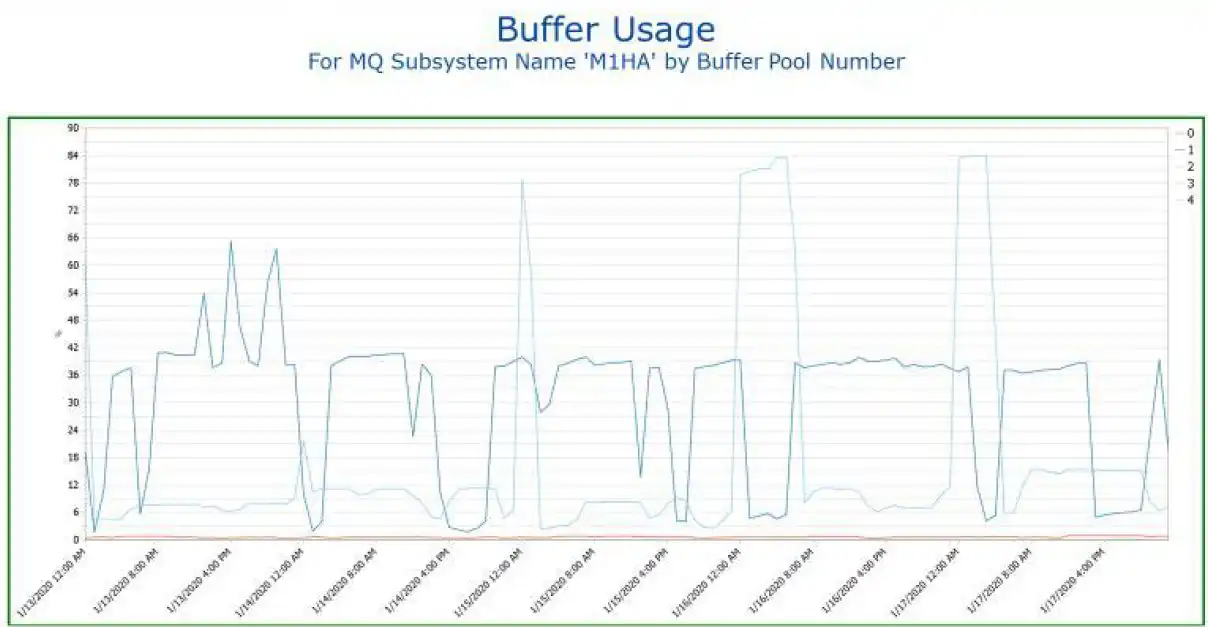
Figure 12: Buffer Usage
Learning From SMF – MQ Statistics
Though we just scratched the surface of the available MQ Statistics SMF 115 metrics in this introductory article, I hope it has helped illustrate the vast potential of learning provided by mainframe SMF data, and piqued your interest in exploring MQ Statistics data more deeply.
To learn more about how to take full advantage of this critical data source, read the full article from Cheryl Watson’s Tuning Letter on “Learning From SMF – MQ Statistics.”
MQ Accounting - Learning From SMF
This article is designed to introduce you to the types of insights that are available through SMF data with a focus on the SMF 116 MQ Accounting data. After reading, you will have a better understanding of how MQ functions.
This article's author
 Todd Havekost
 Share this blog
Related Resources
What's New with IntelliMagic Vision for z/OS? 2024.2
February 26, 2024 | This month we've introduced changes to the presentation of Db2, CICS, and MQ variables from rates to counts, updates to Key Processor Configuration, and the inclusion of new report sets for CICS Transaction Event Counts.
Viewing Connections Between CICS Regions, Db2 Data Sharing Groups, and MQ Queue Managers
This blog emphasizes the importance of understanding connections in mainframe management, specifically focusing on CICS, Db2, and MQ.
What's New with IntelliMagic Vision for z/OS? 2024.1
January 29, 2024 | This month we've introduced updates to the Subsystem Topology Viewer, new Long-term MSU/MIPS Reporting, updates to ZPARM settings and Average Line Configurations, as well as updates to TCP/IP Communications reports.
Book a Demo or Connect With an Expert
Discuss your technical or sales-related questions with our mainframe experts today