
Work Smarter, Not Harder with z/OS Performance Management
In 1992, I was assigned my first weekend of on-call support for MVS Operations. I was handed the team PC that had a 2400 baud modem and a pager. On Saturday night, my pager went off about a batch job that had abended. I dialed in (a process for sure), and after several phone calls and frustration I decided that I had to drive in to work through a blizzard to work on it from a workstation at the office.
A few years later, we had faster connectivity and our own PC’s. Support was a lot easier from home, but we were still tied down to a PC. Even today, many mainframe performance analysts are required to have a laptop that they carry from place to place to support z/OS systems. Wouldn’t it be nice to ditch that old laptop and do effective support from any connected device?
Besides just breaking free from the PC, there are certain capabilities and reporting features that make a z/OS performance analyst much more effective. Through all my years of being a performance analyst for z Systems, I’ve gone through it all – from coding my own static reports, to using automated, GUI-based systems and interactive reports.
In my experience, every mainframe performance analyst for z/OS systems needs the following 10 essential features to make their job easier and more efficient.
Feature #1: An Online, Interactive Web Reporter
A lot has changed since 1992. In today’s world there is no reason that performance analysts shouldn’t be able to perform their jobs from anywhere with an internet connection or cellular signal. Several performance management solutions, such as IntelliMagic Vision, make the process secure and easy.
Cloud-based web reporters provide a robust interface to the superior analysis that Windows-based reporters have long provided, but do not require each user to install and maintain additional software on their PC’s. All a user needs is a URL link, and they can access their reporting solution with the browser of their choice.
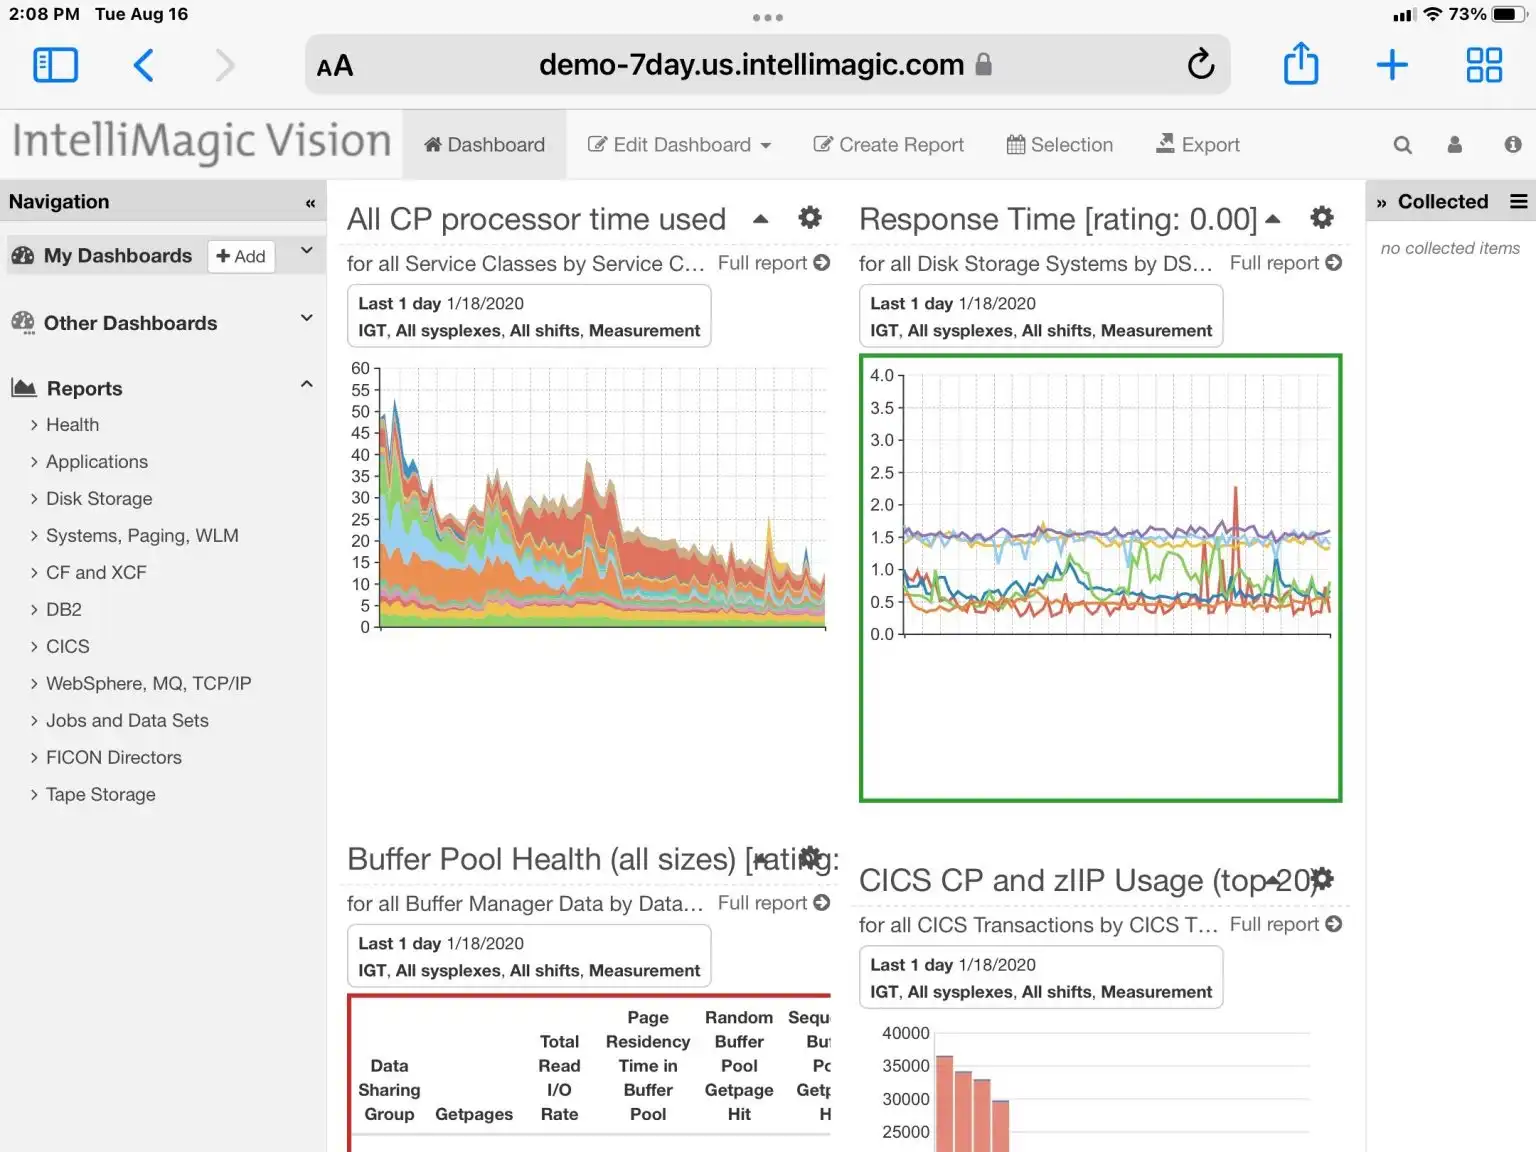
I personally like to use Safari from my iPad when I want to get away from my physical desk every now and then. Here’s a screenshot of My Personal Dashboard (a customizable and interactive dashboard made up of my key reports) taken from my iPad.
#2: Early Warning System
Going back in time again, we had to react to problems. When I was finally paged about something, impact was already happening. An effective mainframe performance management solution should provide you with early warnings before issues occur.
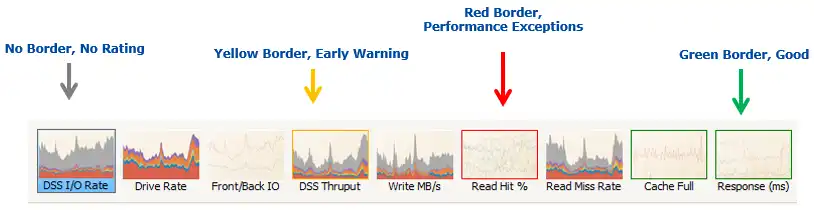
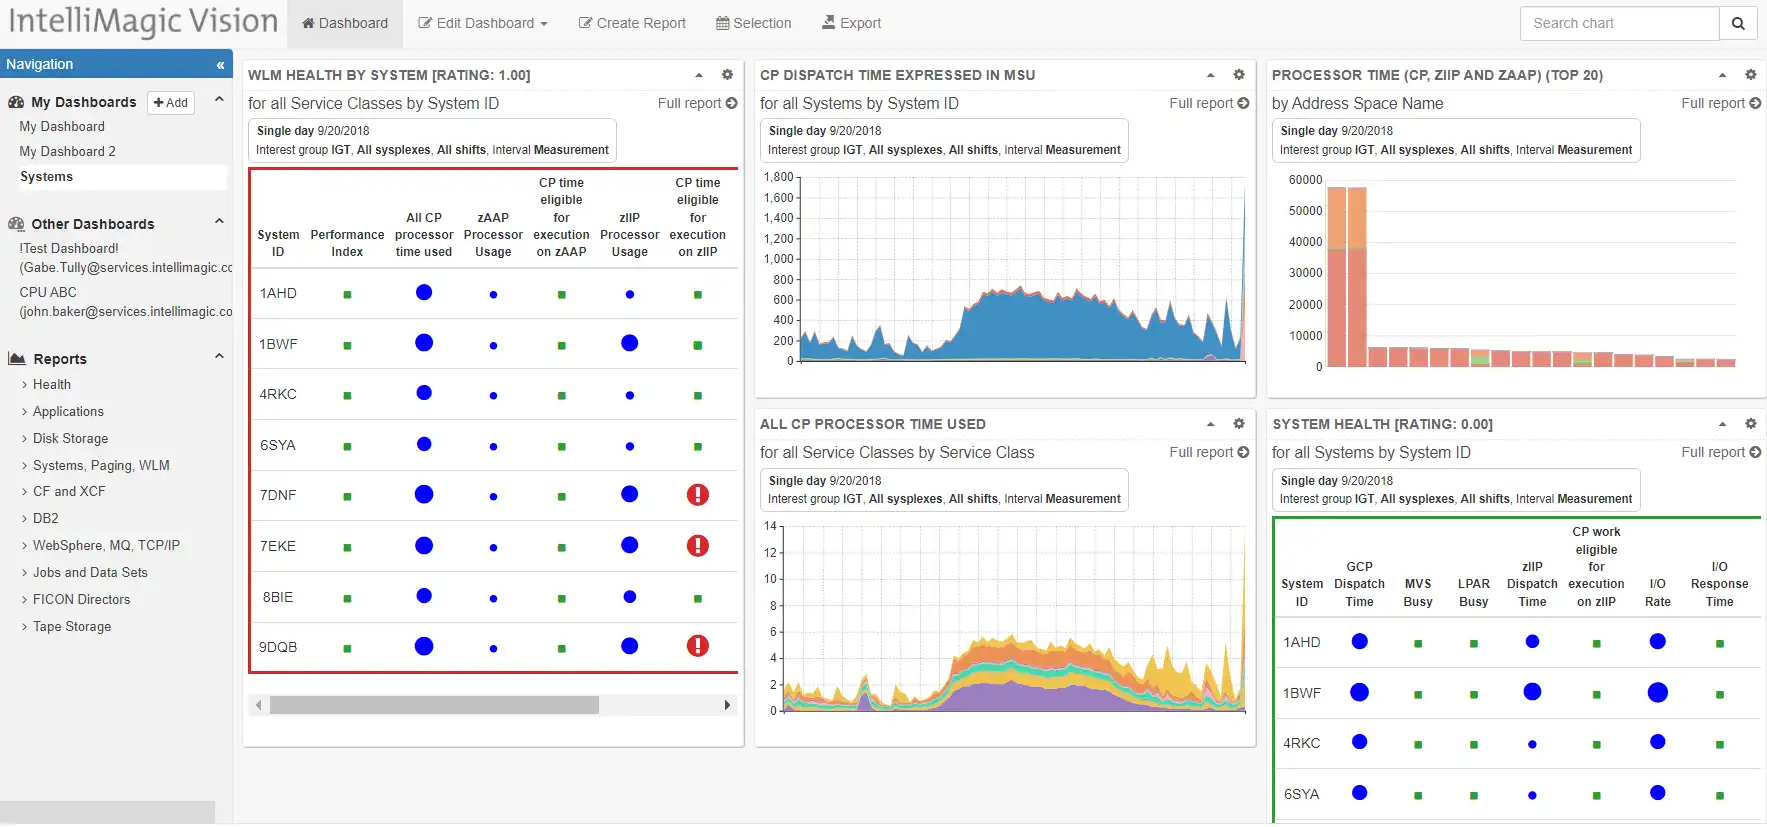
IntelliMagic Vision provides that early warning system and has many reports that show if all is ok (green), if a metric has suddenly changed to cause an exception (red), or if there is a warning to an issue you might not know about (yellow).
These rated reports can be automatically generated if they go yellow or red, or you can easily spot them when looking at the Web Reporter.
#3: Interactive Data Navigation
Interactive data navigation is an essential feature for every performance analyst when performing root cause analysis. Static reports that require manual coding or expert level understanding to know where to investigate further is no longer the only option for z/OS performance analysts, and it’s usually not the most effective either!
With the ability to start at a high level overview covering your entire end-to-end z/OS infrastructure and drill down to the root cause within a few clicks, guided by the built-in ratings and recommendations, resolving service disruptions becomes much more streamlined.
Drilling down to more granular analysis is very simple using the IntelliMagic Vision Web Reporter. I can even use my Smartphone to view interactive reports and drill down from high level charts to specific areas of concern.
Read our blog, Root Cause Analysis for z Systems Performance, to see how easy it can be.
#4: Customizable Reports
Being able to customize a report – any report – live, within the GUI, is one of the most powerful tools available to a performance analyst. Built-in customization not only saves an analyst time by eliminating the need to code each report view, it allows them to personalize their analysis journey based on their in-the-moment findings and observations to quickly drill into key areas or uncover key insights or root causes.
I absolutely love the way you can customize reports within IntelliMagic Vision. Here is a screen shot of all the options in just one of the reports. I started here with the CPU per service class report.
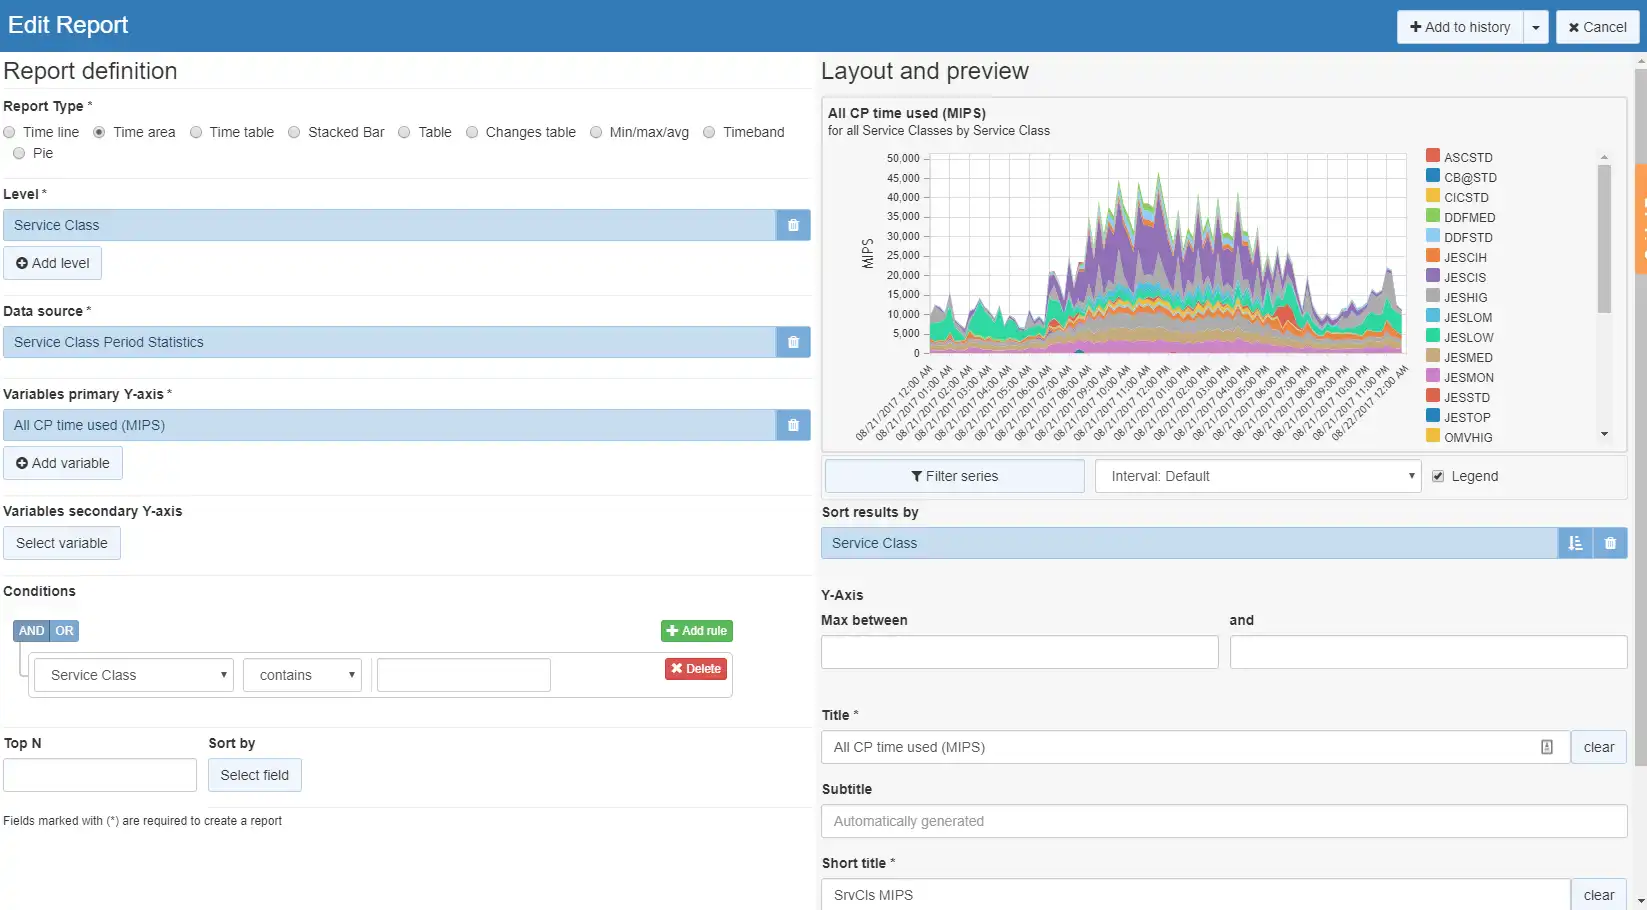
Really digest how many things you can customize using this screen. Once you get the report how you like it in the preview, you can save it to your collected pane, your favorites, or as a Dashboard frame.
#5: Global Filtering
Live filters are a crucial feature in a modern performance management solution that enables quick analysis and customization. Global filters go one step further and apply across every report in the toolset.
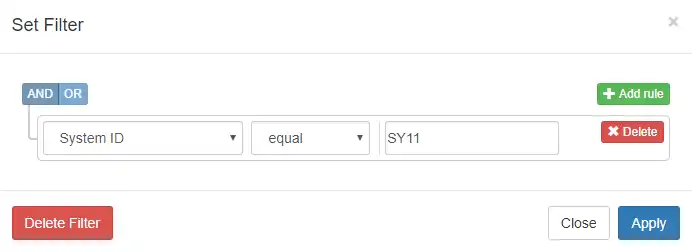
I typically use global filters to look at one particular LPAR, but the filters can be as complicated or as simple as you need for your analysis.
When you turn the global filter on in IntelliMagic Vision, every report that isn’t locked from filtering (even the thumbnail previews) is filtered by that System ID (when applicable) until you turn the global filter off. Looking at one LPAR is only one example of an unlimited number of global filters that you can use.
#6: Historical Reporting and Analysis
One of the most powerful tools in a performance analyst’s toolbox is the ability to interact with the current data and compare the history to understand the context of the issues.
In many situations, just looking at a performance exception (even one that is rated), is not enough to determine what the problem is, or if it’s even a problem at all. That’s where trending and comparisons come in.
By being able to interact with the current data and compare the metrics with the previous day, week, month, day of the week, or any other interval that is relevant to me, I can see if this performance exception is indeed a serious spike that needs my immediate attention, or if it’s just something that occurs every day at the same time. And of course, finding recurring patterns in the data can be very useful.
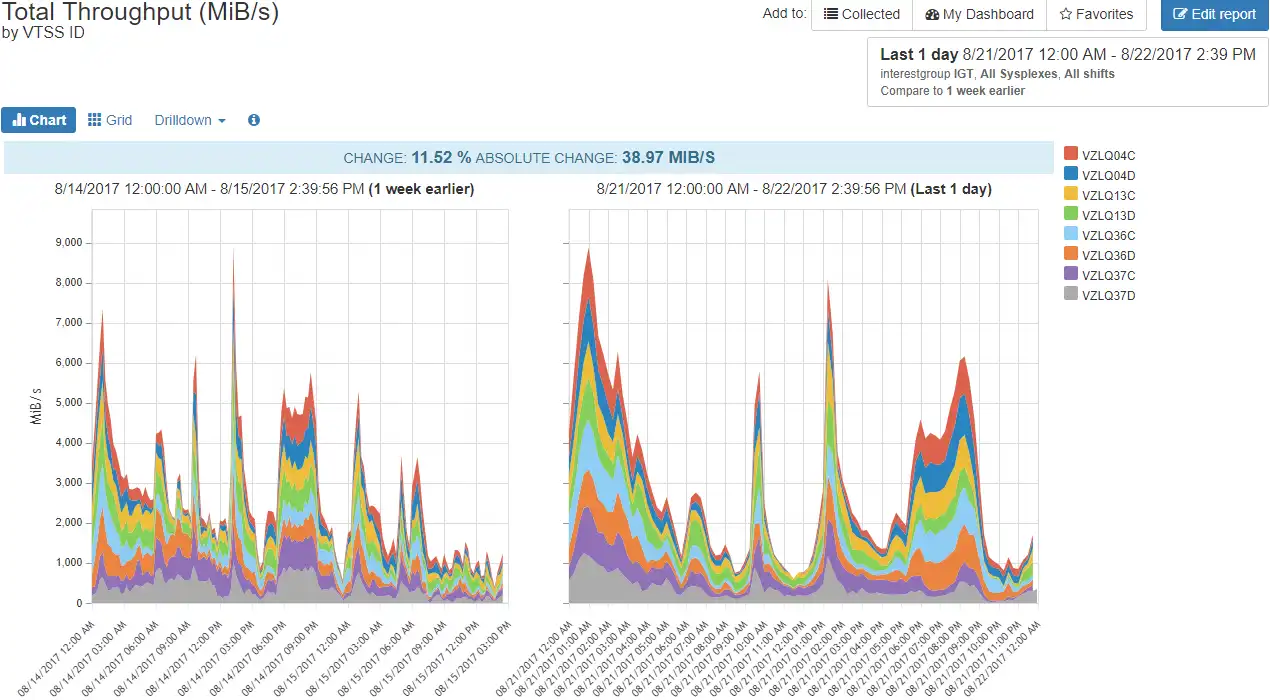
In this example, you can see that throughput has increased by simply comparing to the previous week. The comparison chart even quantifies both the absolute change in the value of the metric and the % change.
#7: Report Collections
Every company’s workloads and requirements are different. Every company has unique challenges. But, there are many times within a shop that you repeatedly end up looking at a specific set of reports. That might be a daily set of reports that analyze your loved workloads, or it might be a set of “go-to” reports that you look at first when you get a call about a specific application.
In either case, the ability to build report collections for your private use or for shared use amongst your colleagues is an essential feature for any performance analyst.
One use case for a dashboard would be to build a collection of reports that looks at the daily workload profile at a high level. Reviewing the workload profiles daily will help you easily spot changes in the peaks and valleys of your performance data.
Another use case for a dashboard would be to build a collection of reports that analyze specific applications. If you get a call about an application concern, you would then go to that dashboard to start your analysis.
#8: Easy Report Sharing and Exporting
Back in my MVS Operations days, when we were still tied to a PC at our office desk, it was not easy if I wanted to pull a report to analyze further, share with my colleagues, or discuss with my manager. Usually it meant a lot of manual data analysis, exporting the raw data into an Excel sheet, and numerous hours trying to add context and highlight the important issues I wanted to discuss.
Thankfully, that’s no longer the case. With a solution like IntelliMagic Vision, I have numerous options to share my graphical reports with my colleagues or export them for additional analysis.
- URL report sharing for any report simply by copying the URL of the report I’m looking at and sharing with anyone in my organization
- Email report sharing for any report or set of reports I’ve collected or saved to “My Favorites”
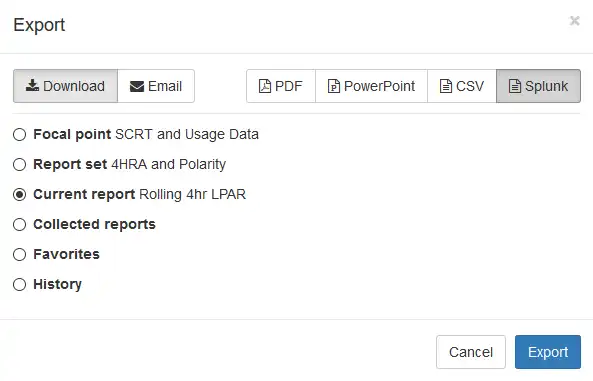
- Report downloads and exports as PDF, PowerPoint, CSV, or even Splunk format.
With the flexibility of the Web Reporter, all I need to do to share a report is copy the URL and send that to anyone in my organization with a login to IntelliMagic Vision. That URL will then show them the exact same dashboard or chart I’m looking at, even with all the customizations and variable changes I’ve applied.
Having this type of quick and painless report sharing would save hours for a z/OS performance analyst, not to mention the headache of trying to get all their reports organized and sent before a deadline.
#9: Automated Report Analysis
Automated report analysis ensures you are not limited to relying on your memory (which is already too busy as it is).
Modern z/OS performance management/monitoring solutions must have easily set up automation to alert you, your team, or anyone else about a variety of things as an essential feature. Bonus points are offered if, in addition to alerting options surrounding the change of ratings from safe to warning/exception, the reporting solution provides alerts to significant workload changes or anomalies from the norm for areas you’re interested in. (At IntelliMagic, we call this Change Detection).
Any modern analysis tool should offer a variety of alerting options such as within the reporter, sending emails to a single email or addressee list, etc. You can be alerted if a rating goes from good to bad.
#10: Built-in Recommendations and Actionable Insights
Alerts from z/OS are common. Some come with software packages, some are part of the operating system, and some are written by Systems Programmers or your Developers. z/OS performance analysts are no stranger to a constant barrage of alerts, but what do those alerts really tell you?
I wrote in a previous blog, Do Not Settle for Bad z/OS Alerts, that although alerts are intended to benefit your business, they almost always result in a lot more work just to understand if the alert is valid and important; not to mention that there is always much more analysis to perform to understand the root cause.
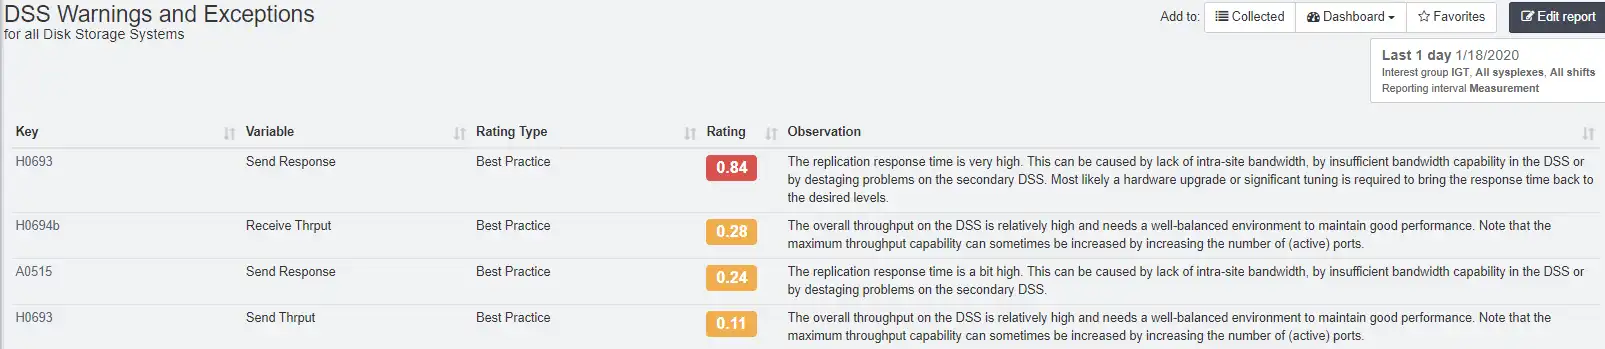
For an alert to actually be meaningful and helpful, rather than just alerting you to a missed threshold (usually without any context), it should provide you with all the necessary information for you to be able to determine if this is a serious issue that requires your immediate attention, or if it’s simply something you should keep your eye on, but you can probably get to tomorrow morning.
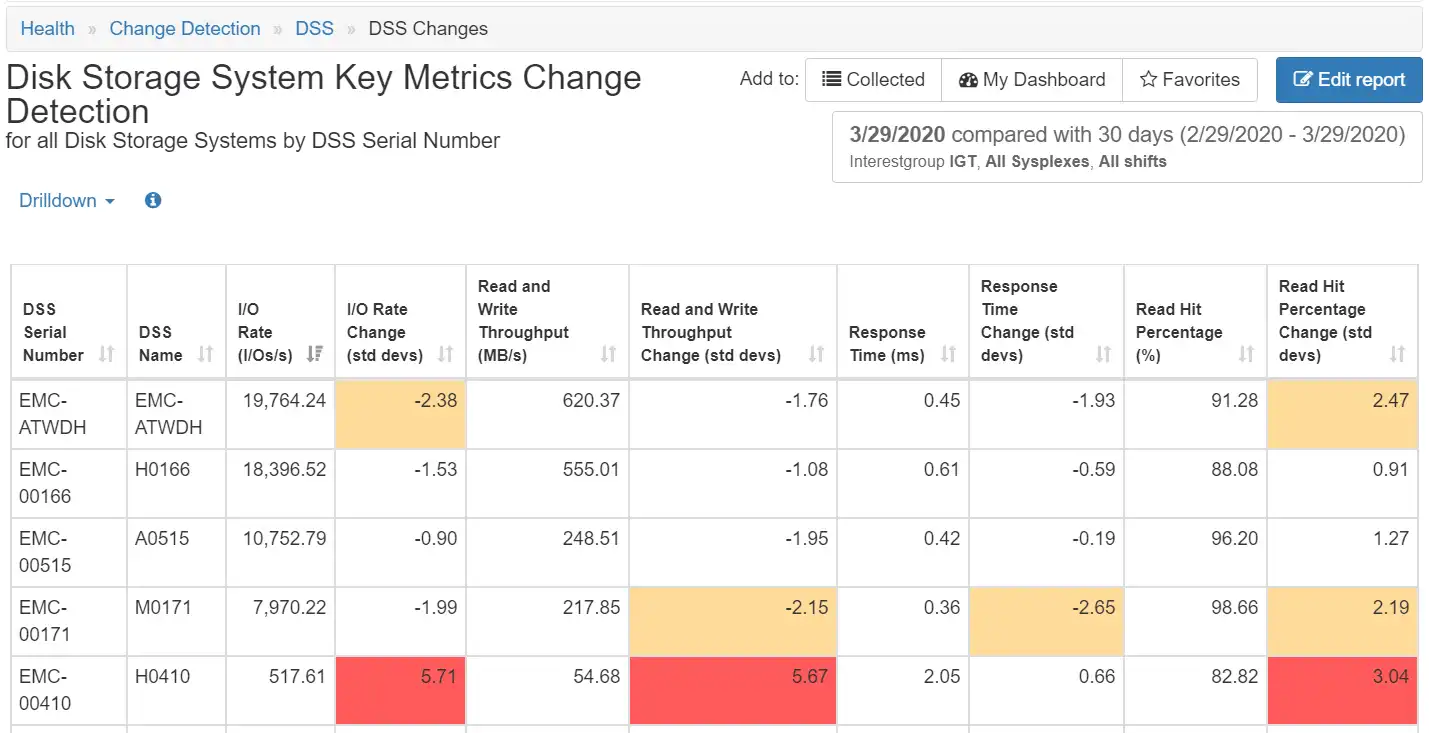
Below is an example of an Exception Table in IntelliMagic Vision. The information in the columns helps determine the severity of the problem and provide observations to further analyze the issue.
Break Free from the PC with These Essential z/OS Performance Analysis Features
So, imagine this scenario. You are watching your son’s soccer game. Your team is winning by many goals, and the sun is shining. But suddenly you get that call from work that you dread. The z/OS system at work is running poorly, and applications are suffering. Do you have to leave the game and head home to your laptop, or worse, to the office to troubleshoot? No, because you happen to have your iPhone with you, so you just punch up the IntelliMagic Vision Web Reporter.
Since you are collecting and processing data every hour, you can easily see the problem that has been driving Operations crazy for the past few hours and determine the root cause. You work on the issue during halftime, send a quick email to operations with a fix, collect the orange peels, and cheer your son on to victory in the second half. No one knows that you were actually working in the stands, so the other parents won’t criticize you for pulling out your laptop at the game!
(This blog was originally published in 2018. It was updated in August, 2022)
This article's author
 Jerry Street
 Share this blog
Related Resources
What's New with IntelliMagic Vision for z/OS? 2024.2
February 26, 2024 | This month we've introduced changes to the presentation of Db2, CICS, and MQ variables from rates to counts, updates to Key Processor Configuration, and the inclusion of new report sets for CICS Transaction Event Counts.
Expanding Role of Sub-Capacity Processors in Today's Mainframe Configurations | Cheryl Watson's Tuning Letter
In this reprint from Cheryl Watson’s Tuning Letter, Todd Havekost delves into the role of sub-capacity processors in mainframe upgrades, providing insights on transitioning to a more efficient CPC.
Why Am I Still Seeing zIIP Eligible Work?
zIIP-eligible CPU consumption that overflows onto general purpose CPs (GCPs) – known as “zIIP crossover” - is a key focal point for software cost savings. However, despite your meticulous efforts, it is possible that zIIP crossover work is still consuming GCP cycles unnecessarily.
Book a Demo or Connect With an Expert
Discuss your technical or sales-related questions with our mainframe experts today