
This blog continues the theme of how performance analysis is enhanced by having integrated visibility into SMF data types produced by components across the z/OS platform. Removing the common barrier of siloed tooling and giving infrastructure teams insights into data types across disciplines through a common, intuitive, integrated interface boosts cross-team collaboration and analytical effectiveness.
One such area where analysis and collaboration can greatly benefit from visibility into data types across disciplines is with Db2 IFCID 199 and SMF 42 data. Db2 IFCID 199 data captures buffer pool and database statistics at the dataset level. This data is very informative on its own, but additional insights can be gained into I/O activity and response time data at the Db2 buffer pool and database levels when it is integrated with dataset performance data from SMF 42.6 records.
Scenario 1: Cache Hit and Response Time Profiles by Db2 Database
Figure 1 shows total I/O rate by Db2 database, broken out by types of I/Os as provided by the SMF 42 data. Note the very different I/O profiles between the two most active databases (represented by the first two bars from the left). I/Os to the first database are overwhelmingly synchronous read cache hits (in green), while a significant portion of I/Os to the second database are sequential (in red).
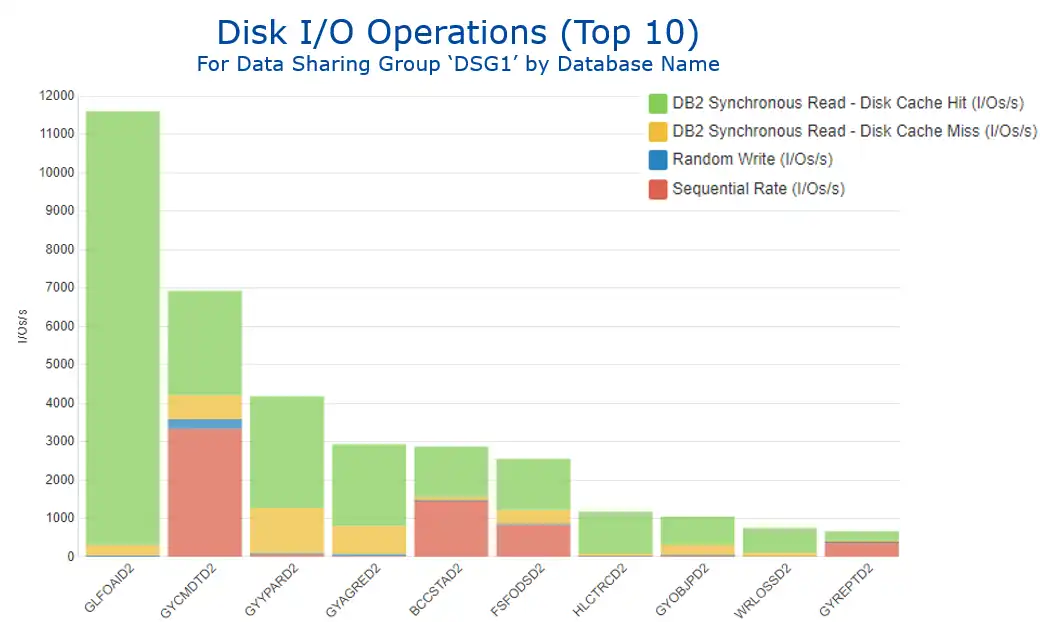 Figure 1: Disk I/O Operations by Database Name
These very distinct I/O profiles are clearly reflected in the view of response times by the standard z/OS components seen in Figure 2. The I/Os for database 1 that are almost exclusively cache hits translate into minimal disconnect time (in yellow), while database 2’s prominent sequential workload generates a sizable connect time component (in green).
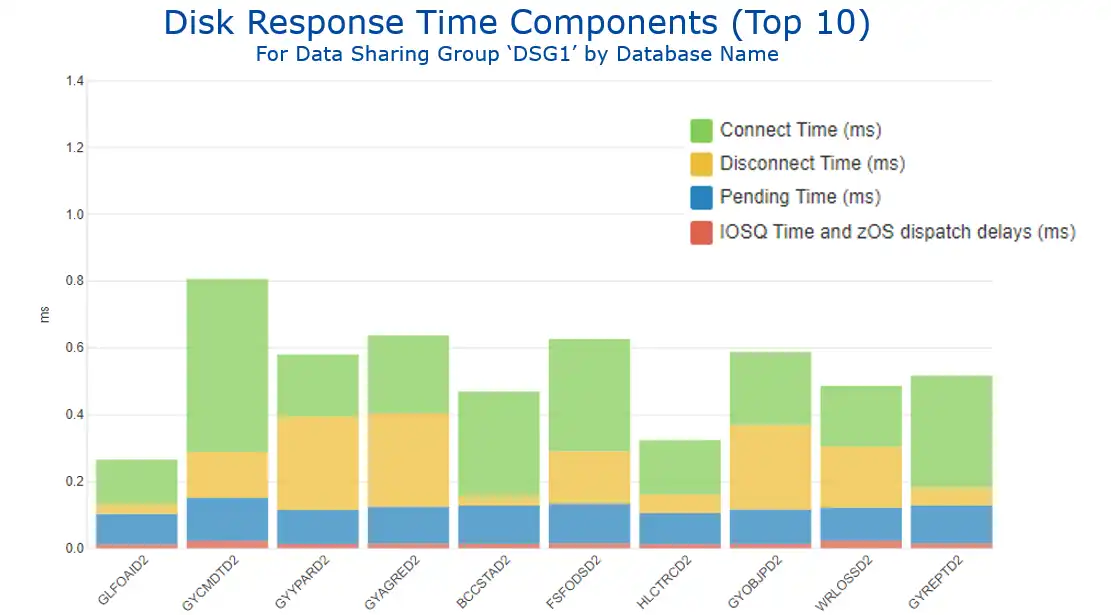 Figure 2: Disk Response Time Components by Database Name
Further analysis of the sequential I/O profile for database 2 by page set shows very different time of day profiles for the two page sets responsible for almost all the sequential activity (see Figure 3).
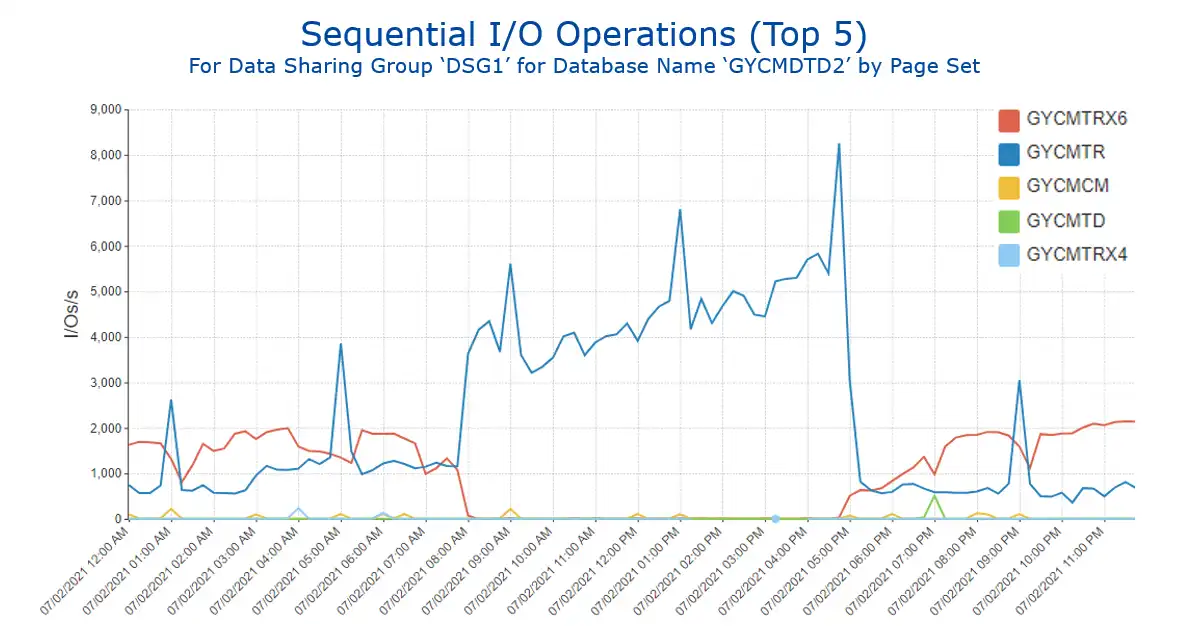 Figure 3: Sequential I/O Operations for Selected Database by Page Set
Understanding of I/O profiles by Db2 database are enhanced by insights provided from integration with SMF 42 data.
Scenario 2: I/O Characteristics by Db2 Buffer Pool
These IFCID 199 and SMF 42 data sources can also provide valuable insights when viewed at the buffer pool level, indicating the performance characteristics of the I/Os that occur when a Db2 getpage cannot be satisfied from a buffer and thus a sync read occurs. Db2 Statistics data (SMF 100) provides sync I/Os by buffer pool, but integration with SMF 42 data indicates the disk cache characteristics of those I/Os.
Viewing the I/O profile for the buffer pool with the highest level of I/O activity (BP21) over the course of a week shows a significant decrease in the middle of the week (Figure 4).
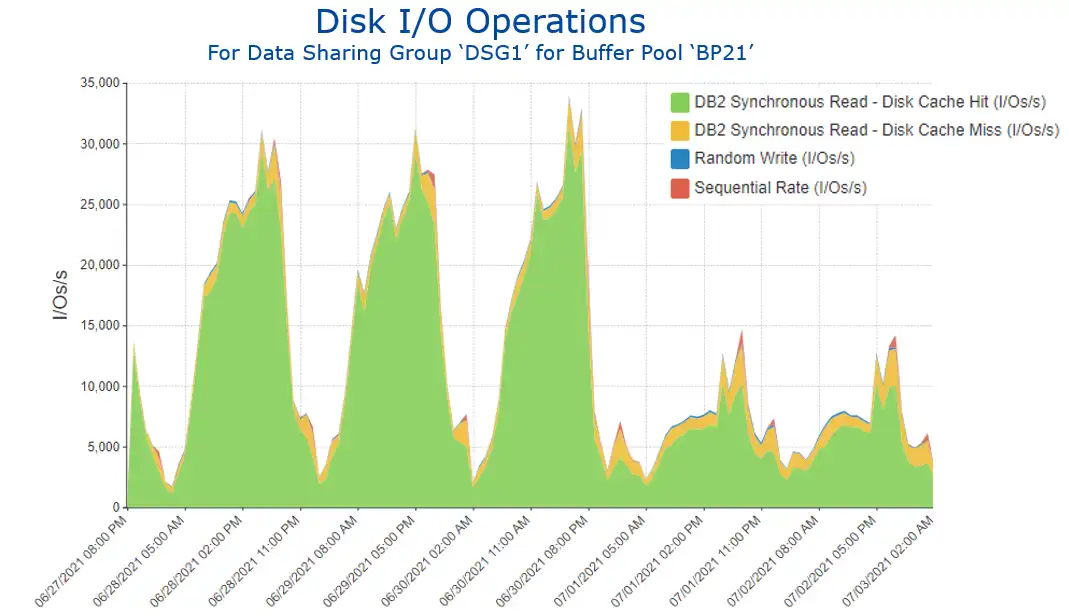 Figure 4: Disk I/O Operations for Buffer Pool ‘BP21’
Drilling into this data (Figure 5) identifies the page set (in red) that greatly benefitted from a SQL tuning change. [Note: The SQL change that generated these significant benefits involved denormalizing tables to avoid running summarization calculations on child rows.]
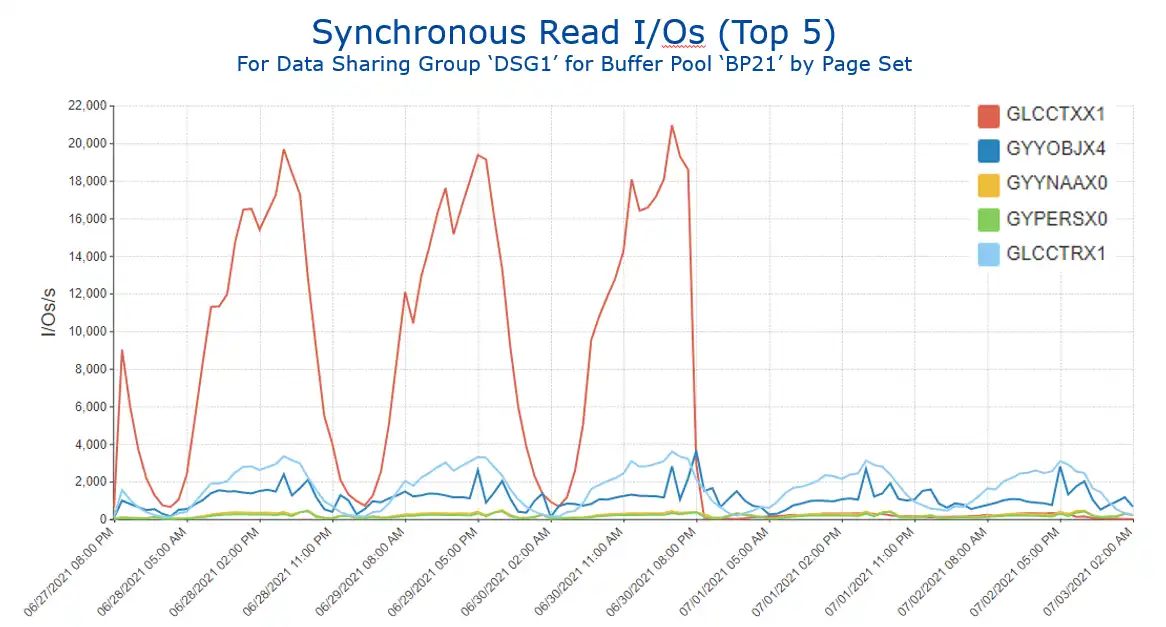 Figure 5: Synchronous Read I/Os for Buffer Pool ‘BP21’ by Page Set
Buffer pool analysis benefits from insights into I/O characteristics provided by SMF 42 data. The next section expands on this theme.
Scenario 3: “Getpage Efficiency”
Another powerful way to leverage this integration of the Db2 IFCID 199 and SMF 42 data is visibility into what we might call “getpage efficiency.” Figure 6 shows this metric for 4K buffer pools with the highest getpage activity, reflecting the three possible outcomes when a getpage requests data:
- The getpage is resolved with a buffer pool hit (in red), the ideal situation.
- It results in an I/O, but the I/O is resolved with a disk cache hit (in blue).
- The least desirable outcome, when satisfying the getpage requires an actual disk I/O (in yellow).
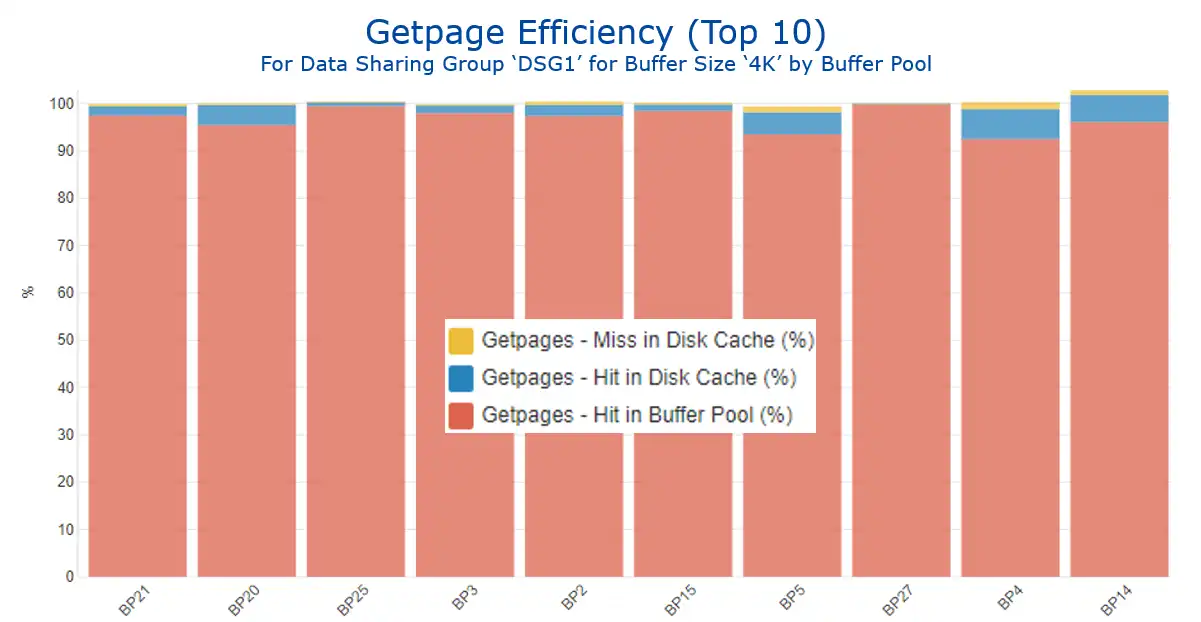 Figure 6: Getpage Efficiency for Buffer Size ‘4K’ by Buffer Pool
This data can be leveraged to help inform buffer pool tuning methodologies, since disk cache hits are an indication of a “second tier” of access. The page did not reside in the Db2 buffer pool long enough to be accessed there, but it was accessed “soon enough” thereafter such that it was still present in the disk cache. So, cache hit volumes (as shown in Figure 7) can be an indicator helping to identify buffer pools that could potentially benefit from being enlarged.
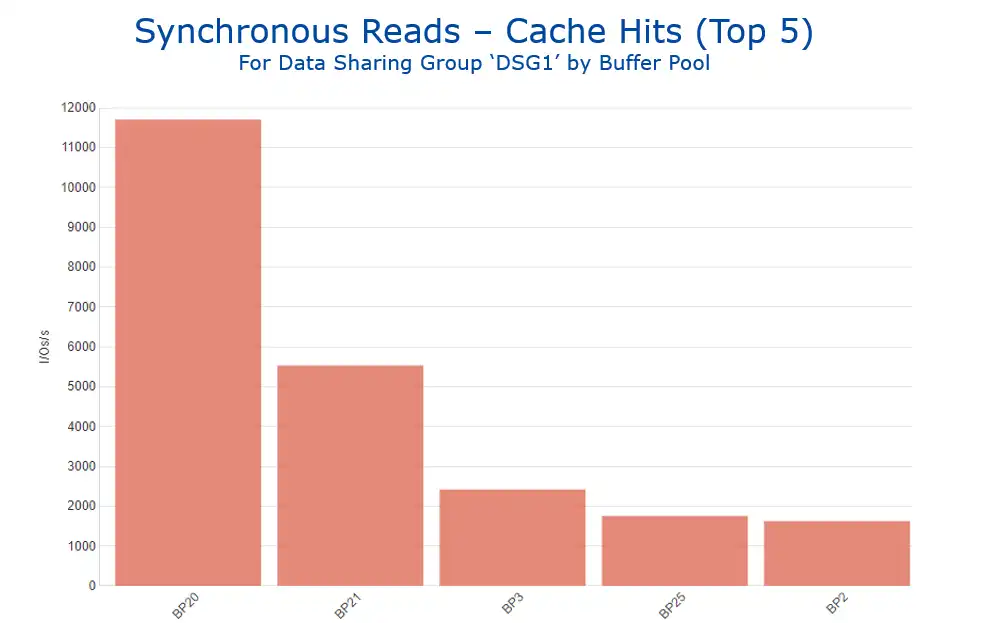 Figure 7: Synchronous Reads – Cache Hits by Buffer Pool
Analysis Enhanced through Viewing Multiple Types of SMF Data
This use case illustrated how having a common interface across Db2 IFCID 199 and SMF 42 data types enhanced analysis by enabling Db2 and storage teams to gain insights into I/O and cache activity and response time data at the Db2 buffer pool and database levels.
Subsequent blogs in this series will continue to provide examples of real-life scenarios where visibility into insights derived from multiple types of SMF data enhances analysis by providing a more complete perspective into the operation of a z/OS environment.
The below video demonstrates the navigation involved in creating these views using IntelliMagic Vision.

This video shows how analysis is enhanced as dataset performance data from SMF 42.6 records provides disk cache and response time data at the Db2 buffer pool and Db2 database levels when integrated with Db2 Statistics IFCID 199 data.
More Integrated Visibility Resources
- Leveraging XCF Message Activity for CPU Efficiency
- Troubleshooting WLM Missed Goals with CICS Transaction Data
- Address Space and Db2 Accounting Data
- Dataset Performance (42.6) and Db2 Buffer Pools & Databases (SMF 102/IFCID 199)
- Db2 GETPAGE Efficiency – Dataset Performance (42.6) and Db2 IFCID 199
- Elapsed Time Profiles by Correlation ID: CICS Transaction (110.1) and Db2 Accounting (101) Part 1
- Analysis of CPU By Plan: CICS Transaction (110.1) and Db2 Accounting (101) Part 2
- Insights You Can Gain from Integrated Visibility Across Types of SMF Data
This article's author
 Todd Havekost
 You May Also Be Interested In:
What's New with IntelliMagic Vision for z/OS? 2024.2
February 26, 2024 | This month we've introduced changes to the presentation of Db2, CICS, and MQ variables from rates to counts, updates to Key Processor Configuration, and the inclusion of new report sets for CICS Transaction Event Counts.
Viewing Connections Between CICS Regions, Db2 Data Sharing Groups, and MQ Queue Managers
This blog emphasizes the importance of understanding connections in mainframe management, specifically focusing on CICS, Db2, and MQ.
What's New with IntelliMagic Vision for z/OS? 2024.1
January 29, 2024 | This month we've introduced updates to the Subsystem Topology Viewer, new Long-term MSU/MIPS Reporting, updates to ZPARM settings and Average Line Configurations, as well as updates to TCP/IP Communications reports.
Book a Demo or Connect With an Expert
Discuss your technical or sales-related questions with our mainframe experts today