The Best of Both Worlds for your Infrastructure Data Intelligence
Many companies are investing in Splunk® as a modern way to analyze machine-generated big data. Splunk provides a data analytics infrastructure that can load data from any source. Splunk is a versatile platform for data mining and it provides a development platform to create reports and dashboards from raw data. In theory it is an excellent place to integrate all of your IT infrastructure and application data, but this is not without its challenges.
Splunk is optimized to parse and process unstructured log files and lets the user create any type of report. But since it does not contain built-in knowledge of your IT infrastructure, deriving deep insights in your data is largely up to the user. As a Splunk user you have to provide context and insights into your data. If you use Splunk to read infrastructure measurement data from your distributed infrastructure, or raw SMF and RMF data from your z/OS mainframe, it will not provide any interpretation out of the box.
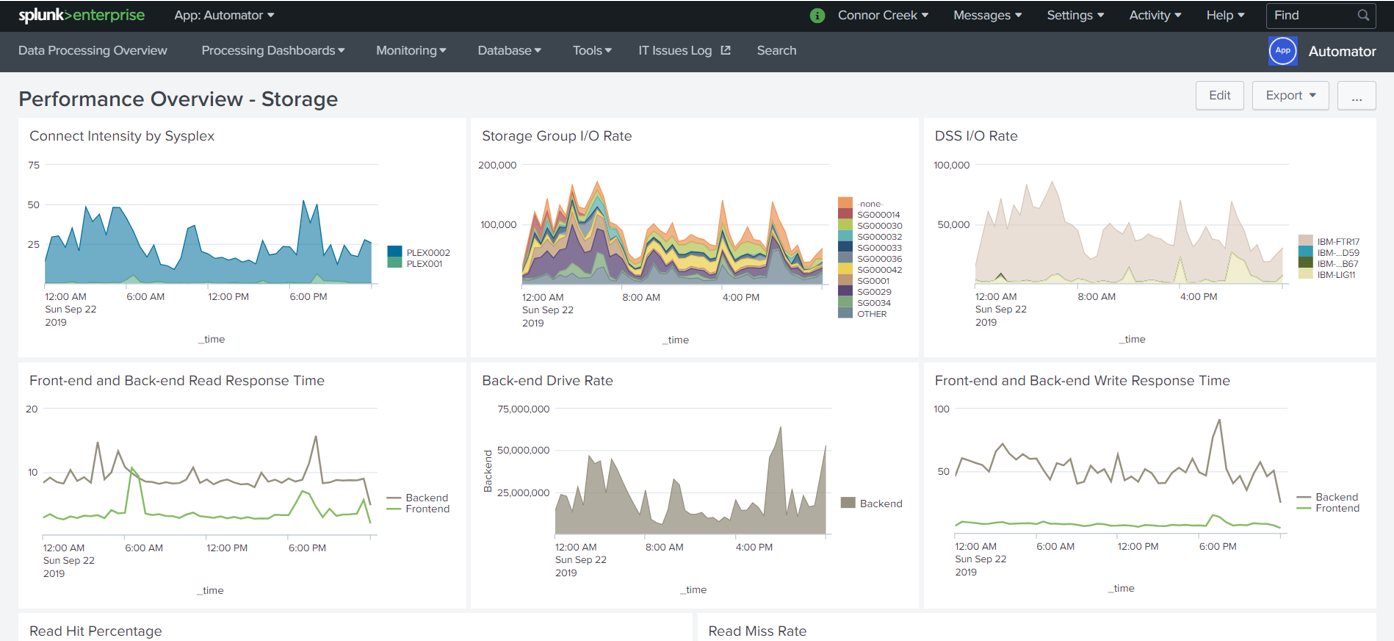
IntelliMagic Storage Performance Dashboard in Splunk created with IntelliMagic Vision data
This is where IntelliMagic Vision comes in: with its deep knowledge of storage, SAN, and mainframe infrastructures, it is designed to bring out both in-depth insights and relationships within your data. By turning raw data into rich information based on embedded expert knowledge, IntelliMagic Vision enriches your data which can then be sent to Splunk if so desired. This way you can benefit from the enhanced data to create in-depth and meaningful insight within Splunk.
Creating your own reports is not a sustainable long-term strategy
While it is technically feasible to import raw distributed performance data or z/OS SMF data into Splunk and create your own reports, it is not a sustainable long-term strategy for mature IT Operations environments. Conceptually, SAN performance or SMF data are just other types of data that can be forwarded to Splunk. Splunk has built-in parsing capabilities that can be applied to a variety of data types. You can convert the fields in the data into “value pairs” that can be more readily processed and charted by Splunk’s display capabilities. However, the interpretation and integration of the data is completely left to the user.
Creating and maintaining your own reports takes a huge investment of effort for IT performance teams to implement. This effort is actually greater than the effort required to develop a catalog of SAS-based static reports using well-known antiquated products.
IntelliMagic Vision: the long-term strategy
With IntelliMagic Vision, this effort is done for you, and the solution remains current with platform changes and significant improvements over time.
IntelliMagic Vision will perform the following tasks
- For z/OS: Normalize the raw SMF data (for instance: combining LPARs into the CECs they share)
- For SAN: Collect VMware, Fabric Switch and Storage data, normalize, enrich, assess and rate the data.
- Sift through the vast quantity of data and identify which of the hundreds of metrics are important to analyze
- Analyze the data and identify “good” and “bad” values for these metrics
- Develop a set of reports to display this data
In the long run it will be extremely difficult for teams to deliver world-class availability and performance relying on in-house developed Splunk capabilities. They will be living with the limitations of what a single team can develop as they “moonlight” in this role (while doing their primary performance jobs).
IntelliMagic Vision empowers your performance and capacity teams by providing
- Artificial intelligence based on domain expertise and mathematical modeling providing accurate and proactive identification of performance and configuration issues
- Broad scope of support allowing you to cover the majority of your infrastructure in a single interface
- User interface flexibility allowing user to customize reports and dashboards to suite job role
- Drilldown capabilities allowing user to identify root cause quickly and easily
- Advanced visualization allowing the user to display data in countless ways and customize views to fit user requirements
- Data integration across multiple SMF records and SAN infrastructure platforms
- External integration with Splunk allowing users to automatically send user selective interpreted performance data from IntelliMagic Vision to Splunk leveraging the best of both worlds.
In addition to the extensive manpower costs of developing this in-house processing and reporting capability, Splunk costs can quickly rise when importing more records because it is licensed by the volume of data ingested. SAN infrastructure and SMF data can be voluminous, so processing data through Splunk will generate significant software license costs. Leveraging IntelliMagic Vision to send only the refined and interpreted data to Splunk can significantly reduce your Splunk costs.

Conclusion: You need IntelliMagic Vision together with Splunk
Splunk is a great product to integrate log files, but all of the intelligence needed to analyze platform specific performance and configuration data is not in Splunk and would take an enormous effort to add.
Therefore, IntelliMagic Vision is the right solution. IntelliMagic Vision has the intelligence and interpretation required to optimize your Splunk investment while maintaining deep analysis capabilities for SAN and mainframe. It makes it possible to send data to Splunk and to integrate mainframe and SAN infrastructure performance and configuration data with the rest of the IT environment. By sending only the interpreted data to Splunk, you can reduce your Splunk license costs for the SAN and Mainframe infrastructure allowing you to use that money to bring in other sources into Splunk.
Experience how IntelliMagic Vision and Splunk work together
Related Resources
Avoid Islands In Your Data Lakes
Executives have been asking for a holistic view of the enterprise applications and infrastructure for years. The result has been a slew of overly complex, hard to maintain, expensive, and siloed IT management solutions.
AI: Too Much of a Good Thing
Solution providers will continue to entice us with bigger and better real-time analytics. Some of these should be employed, but first try to understand the logic you may be activating when you implement.
IntelliMagic Vision Introduces Automated Change Detection
May 18, 2020 | IntelliMagic Vision provides Automated Change Detection for hundreds of important metrics in the z/OS infrastructure. This includes important changes in hardware, middleware and other z/OS components.