Mainframe Systems Performance and Availability Management

    Optimize z/OS Systems performance management using AI-driven analytics to proactively monitor and manage your z/OS environment, prevent disruptions, reduce costs, and preserve the reliability and availability that mainframes are known for.


    Monitor IBM z Systems, Processors, and Network


    Lower MLC Costs and Optimize Systems Performance with Built-In Health Insights and AI

    performance and high utilization icon

    Optimize and Lower IBM Software Costs

    Utilize the same unrivaled insights into CPU consumption and drivers of software costs used by Watson & Walker to reduce your costs.  


    risk and compliance icon

    Proactively Analyze and Prevent Risks

    Utilize built-in health insights and artificial intelligence to proactively identify risks, ensure availability, and optimize your z/OS Systems environment.


    expedite learning icon

    Expedite Learning and Enhance Domain Expertise

    Detailed built-in explanations, guided drilldown options, and end-to-end z/OS support facilitates easy system understanding and knowledge transfer. 


    Optimize z/OS Mainframe Systems Management with Availability Intelligence

    Health Insights with Explainable Artificial Intelligence

    zOS Health Insights with Explainable AI

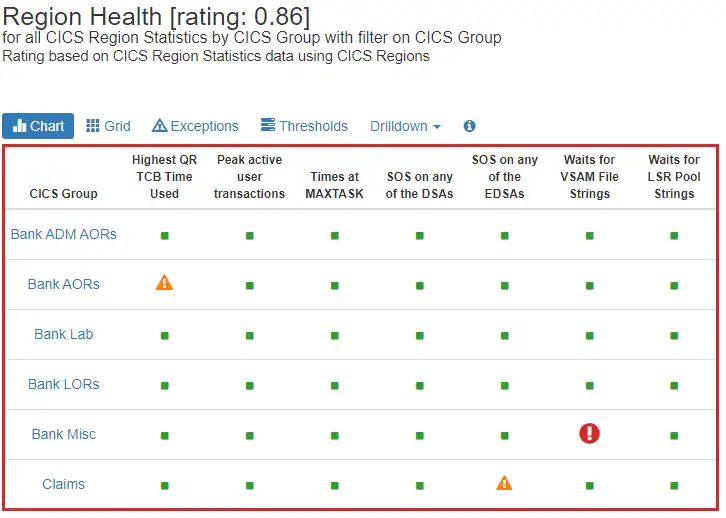
    Prevent potential risks to availability and performance with built-in artificial intelligence automatically assessing more than 700 key z/OS metrics and using thresholds derived from built-in expert domain knowledge.

    The easily consumable view to the right assesses the overall health of all CICS regions, leveraging user defined CICSGROUPs to enable exceptions from among hundreds of regions to be quickly identified and proactively addressed.

    Compare LPAR and FICON Topology Time Intervals
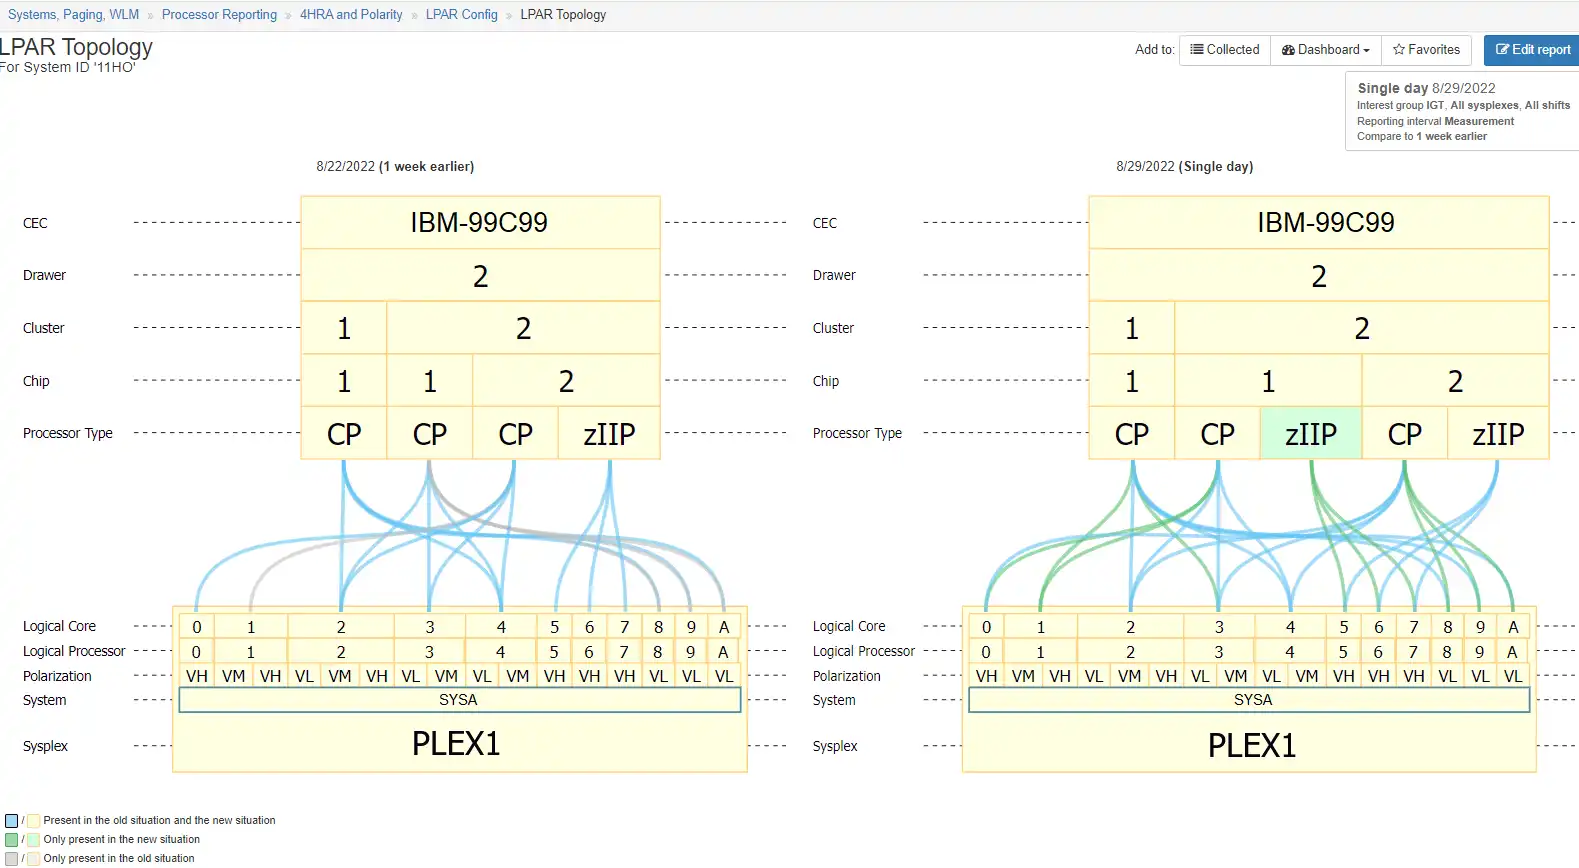
    Compare LPAR topologies between two selected time intervals separated by one week

    Figure 1: Comparing two views, with the benefit of color coding changes, gives the user an easy to understand identification of configuration changes.

    z/OS topology's (FICON and LPAR) are incredibly complex and difficult to visualize. Traditional methods of viewing these topology's have involved manually printing the topology out on paper and pasting it to physical walls in order to understand the configuration and spot errors.

    IntelliMagic Vision's interactive LPAR and FICON topology viewers allows analysts to interact with, drill down into, and compare time intervals for their FICON and LPAR topology's - crucial for spotting errors and changes that may impact costs.

    Context Sensitive Drill Downs

    Context Sensitive Drill Downs

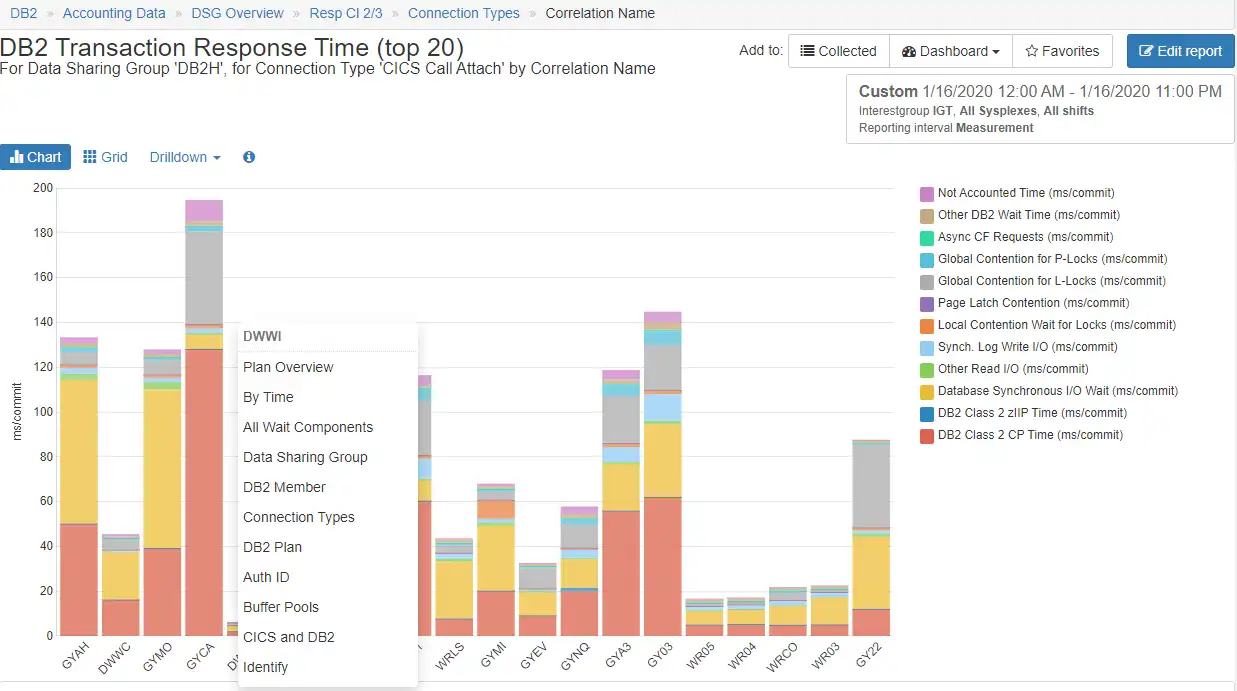
    Context sensitive drill downs enable an analyst to identify alternative analytical paths based on the data currently being displayed and quickly investigate each hypothesis with just a few clicks, greatly reducing lost time when exploring what ends up being a “dead-end” path.

    When dealing with massive SMF data volumes, this capability to focus analysis on the desired subset of data becomes especially valuable.

    Intuitive Visibility into SMF Data

    Intuitive Visibility into SMF Data

    In contrast to approaches today that require coding programs or mastering tooling siloed by technology to access various types of SMF data, a common, intuitive user interface eliminates effort spent mining data and instead frees up staff to focus entirely on high-value analysis.

    This single interface used across the entire z/OS platform greatly expedites learning, promotes collaboration, and enhances analytical effectiveness.

    Dynamic Report Customization

    Dynamic zOS Report Customization

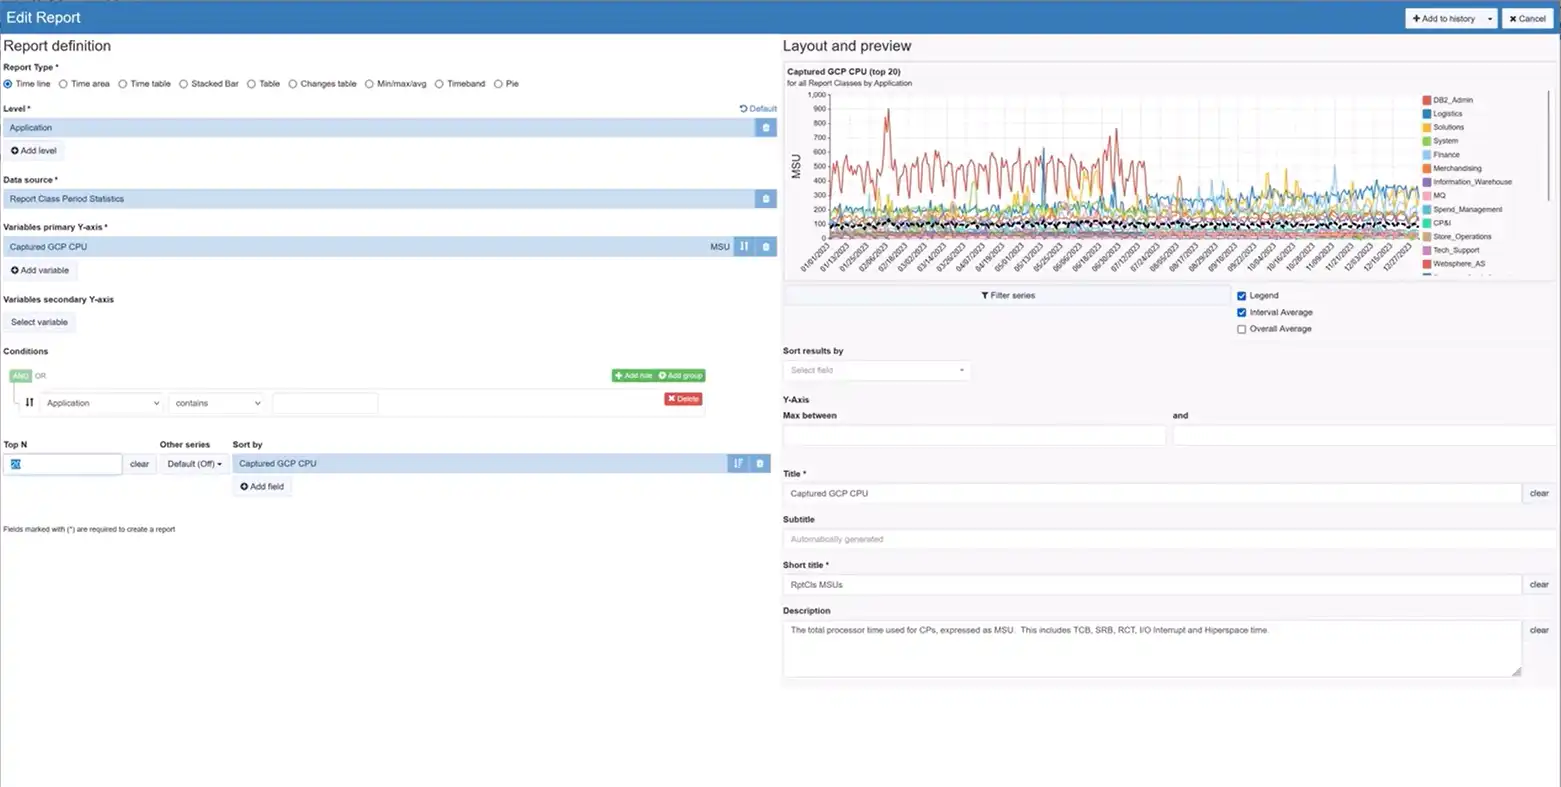
    Advanced report customization capabilities facilitate quick ad hoc analysis without requiring programming or complicated steps and enable data to be viewed in the manner best suited to the current inquiry.

    In this example, transaction rate is added to a response time chart to evaluate possible correlation. Numerous intuitive customization options including report type, summarization level, filtering, and interval comparisons.

    Advanced z/OS Anomaly Detection and Statistical Analysis

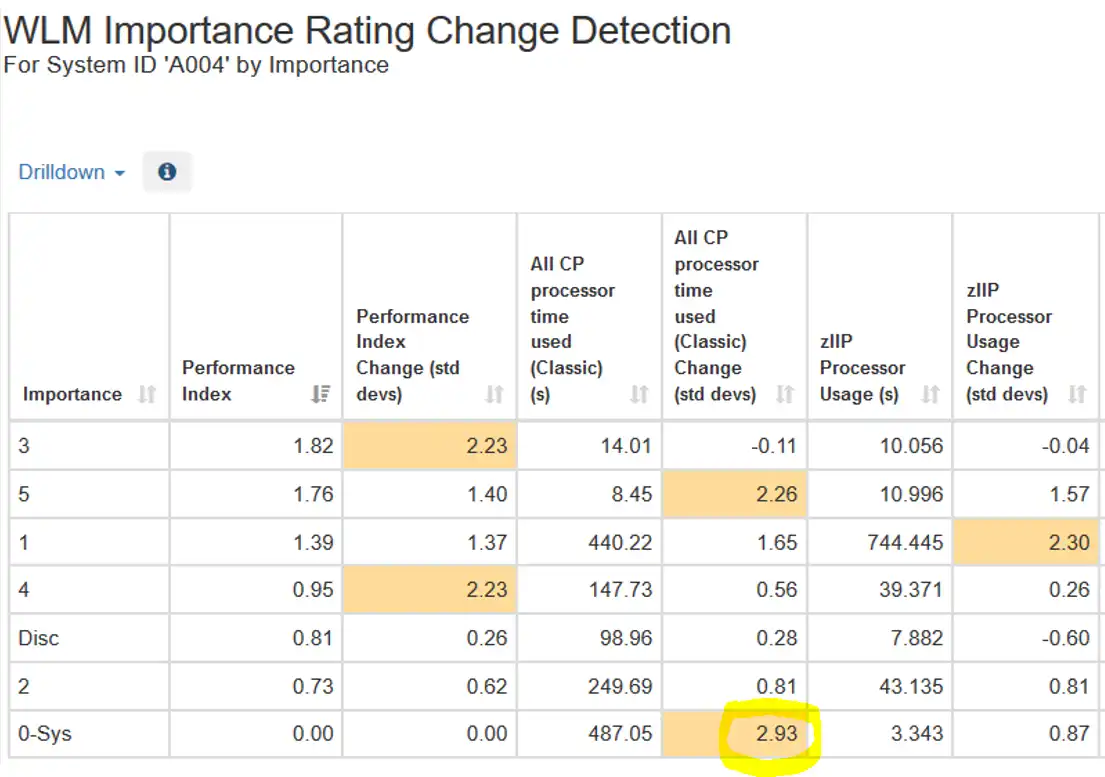
    WLM Importance Rating Change Detection

    Statistically significant changes in key metrics are highlighted in Change Detection views. Variations that exceed + or – 2 standard deviations between the current day and the prior 30 days are highlighted.

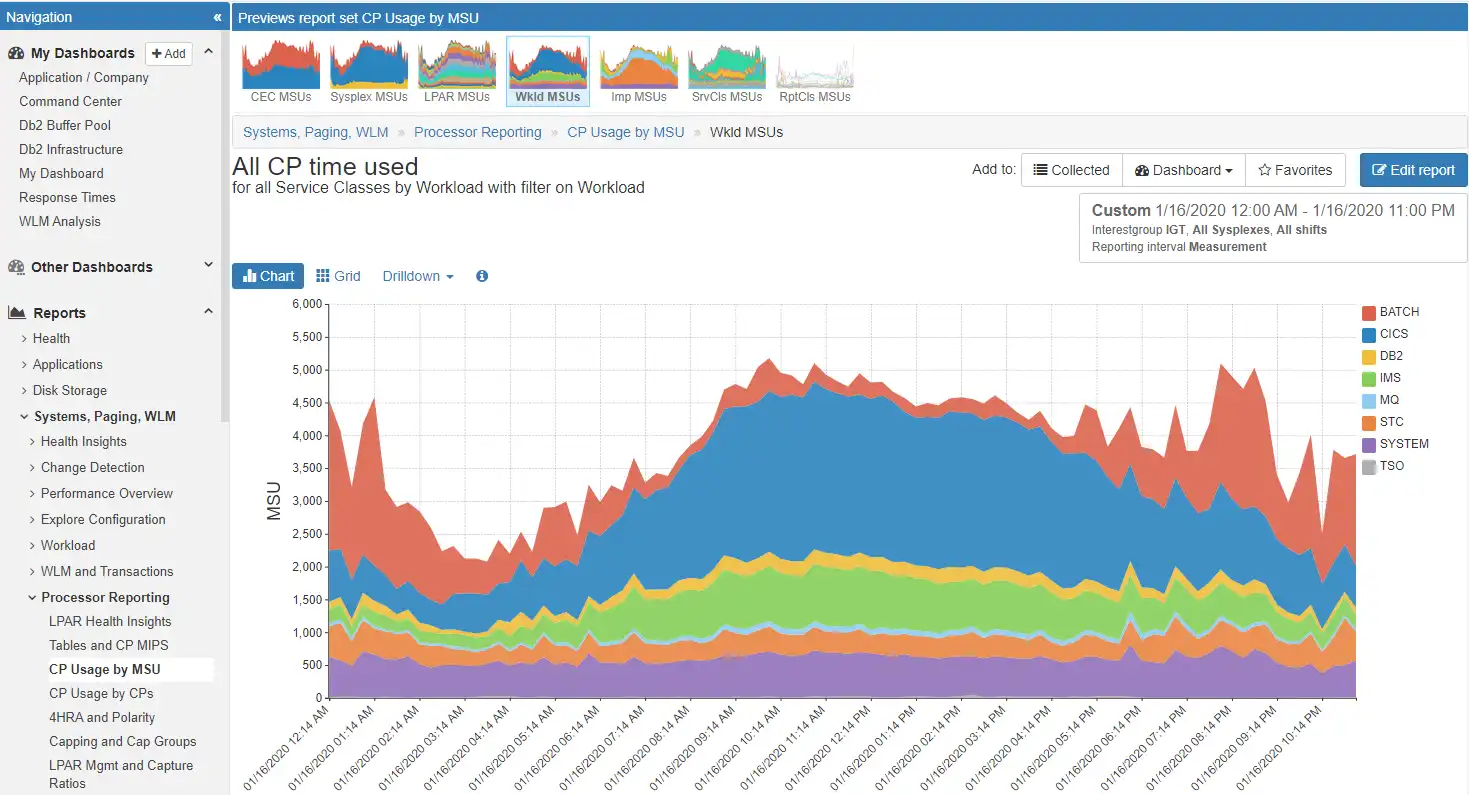
    This can enable you to get an early jump on changes that may have a sustained impact, such as this example of increased CPU consumed by highest dispatching priority System work.

    Customized Shared Dashboards

    Customized Mainframe Shared Dashboards

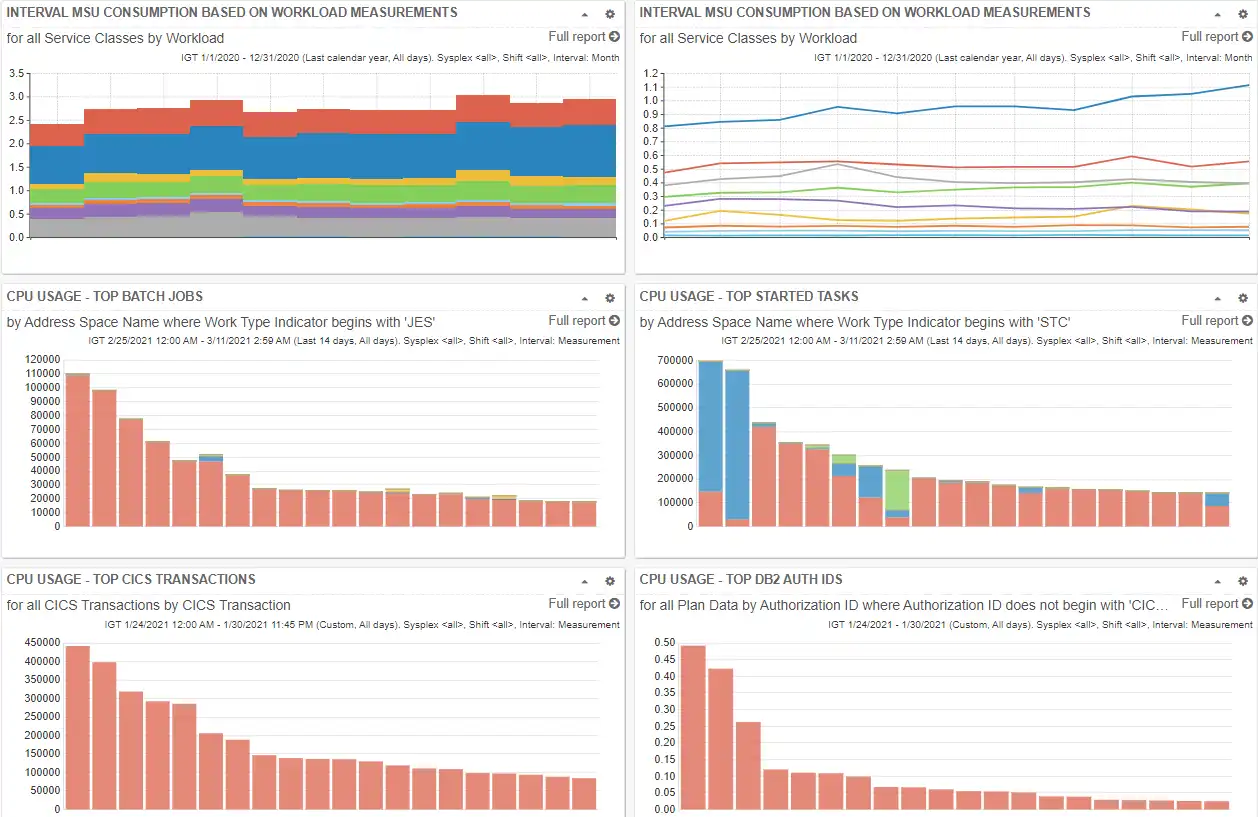
    Customizable dashboards collect and display at a glance live views of any collection of metrics of interest to you. When shared, they promote collaboration and provide a common truth for an entire organization.

    Users can expand any report and leverage drill down capabilities to pursue further analysis of metrics they find of interest.

    AIOps via SaaS Delivery

    Cloud Software as a Service (SaaS) icon

    Advantages to adopting a cloud model include rapid implementation (no lead time to install and setup the product locally), minimal setup (only for transmitting SMF data), offloading staff resources required to deal with SMF processing issues or to install product maintenance, and easy access to IntelliMagic consulting services to supplement local skills.

    End-to-End Infrastructure Analytics for z/OS Performance and Capacity Planning

    zSystems Performance Management

    Optimize z/OS Mainframe Systems Management with Availability Intelligence

    Benefits

    Optimize z/OS Systems performance management using AI-driven analytics to proactively monitor and manage your z/OS environment, prevent disruptions, reduce costs, and preserve the reliability and availability that mainframes are known for.
    Explore z/OS Systems Performance Analytics

    Db2 Performance Management

    Prevent Availability Risks and Optimize Db2 Performance

    Benefits

    The volume and complexity of Db2 Statistics data and Db2 Accounting data creates a major challenge for analysts who want to derive value from the rich metrics available.
    Easy visibility into key Db2 metrics through SMF records is crucial to proactively prevent availability risks and to effectively manage and optimize performance.
    Explore Db2 Performance Analytics

    CICS Performance Management

    Monitor and Profile CICS Transactions and Regions with IntelliMagic Vision

    Benefits

    CICS SMF Transaction data is a rich source of performance insights, but its volume can make analysis challenging using traditional approaches that rely on static reports. Proactive assessment of key Statistics metrics across all regions is essential to identify potential risks to availability.
    IntelliMagic Vision enables performance analysts to manage and optimize their z/OS CICS transactions more effectively and efficiently, as well as proactively assess the health of their CICS regions.
    Explore CICS Performance Analytics

    Virtual Tape Performance Management

    Proactively Manage Virtual and Physical Tape Environments

    Benefits

    With tape virtualization, tape storage became easier and more economical, but at the same time, more difficult to understand which changes or hardware upgrades are the best choices. With tape libraries being shared across multiple z/OS images, the full picture can only be obtained by aggregating workload and tape hardware information from all z/OS LPARs.
    IntelliMagic Vision enables performance analysts to manage and optimize their z/OS Virtual Tape environments more effectively and efficiently.
    Explore Tape Performance Analytics

    Disk & Replication Performance Management

    Automatically Detect Disk Performance Risks & Quickly Resolve Issues

    Benefits

    As Disk speeds and throughputs have increased, z/OS applications have come to rely on fast and consistent storage performance. To respond quickly to unexpected disk and replication issues, it is essential that you have insight into the health of the various components in your storage environment.
    IntelliMagic Vision enables performance analysts to manage and optimize their z/OS Disk and Replication environment more effectively and efficiently.
    Explore Disk Performance Analytics

    MQ Performance Management

    Optimize and Analyze MQ Activity and Performance

    Benefits

    MQ is widely used across z/OS environments, but sites often find it challenging to derive the valuable performance insights potentially available from MQ SMF Statistics and Accounting data due to limitations in existing reporting and available tooling.
    IntelliMagic Vision enables performance analysts to manage and optimize their z/OS MQ configurations and activity more effectively and efficiently, as well as proactively assess the health of their queue managers.
    Explore MQ Performance Analytics

    z/OS Network Performance Management

    Automatically Monitor Mainframe Network Security and Protect Your Data

    Benefits

    TCP/IP is the core of the communication for the z/OS mainframe, both for traffic into and out of the mainframe and internal communication among z/OS images and processor complexes. Proper management is necessary to secure and protect system availability.
    IntelliMagic Vision automatically generates GUI-based, interactive, IBM best-practice compliant rated reports that proactively identify areas that indicate potential upcoming risk to TCP/IP health, performance, and security.
    Explore z/OS Network Performance Analytics

    z/OS Connect: Modern Mainframe API Environment

    Optimizing Mainframe API Monitoring for Improved Resource Management

    Benefits

    IntelliMagic Vision enhances mainframe API monitoring and profiling, providing crucial visibility to address issues at the API or service level, ultimately aiding performance analysts in better resource planning and management reporting.
    Explore z/OS Connect Analytics

    See Why IntelliMagic is Trusted by Some of the World’s Largest Mainframe Sites

    It's one of the best products we found at the offering to help us in reporting for our mainframe environment
    Anonymous-06 | Financial Services Company
    Read our case
    IntelliMagic is very critical to our success as a team. If we don't have those graphs showing us systems trends and problems, we can['t] plan ahead for the future.
    James Schlosser | Northwestern Mutual
    Read our case
    IntelliMagic Vision provides excellent on-board context-sensitive technical information - staff learns about cross-domain technologies while actively monitoring systems with the tool.
    Anonymous-04 | Insurance Company
    Read our case
    The Health Insight reports are great for helping me quickly hone in on aspects of system performance that require further investigation, without having to browse through hundreds of reports that simply report that everything is 'normal'
    Frank Kyne | Watson & Walker
    Read our case
    During an instance when our entire system was down due to a massive power failure, they were instrumental in our recovery
    Sam Loy | State Farm
    Read our case
    Compared to other software houses, IntelliMagic reacts quickly and competently. In the event of errors, we have interim solutions and corrections were often made available within a few weeks
    Walter Auerochs | DATEV
    Read our case

    Book a Demo or Connect With an Expert

    Discuss your technical or sales-related questions with our mainframe experts today

    Solutions for your Problems

    Elevate IT Team Impact

    Empower new staff and experts. Replace antiquated reporting with automated, intelligent analytics.

    Benefits

    Artificial Intelligence using built-in expert knowledge and statistics assesses and rates key metrics as good versus bad from a performance or efficiency perspective for the analyst.
    Force multiplier - Invite AI to the team to help both new and expert team members in a tight job market.
    Cloud Delivery - Immediate access with no maintenance needed.

    Optimize & Reduce Costs Safely

    Save money without compromising service levels or availability.

    Benefits

    Reduce cost with superior visibility into drivers of cost such as inefficient CPU utilization, configuration and priority issues, imbalance of workloads across hardware resources, consolidation opportunities, etc.
    Reduce hardware spend without negative impact on service levels.
    Avoid the costs of service delivery problems without both human cost and application unavailability cost.

    Prevent Performance Problems

    Predict and Prevent many IT issues without incurring typical false positive and false negative issues.

    Benefits

    Automatically quantify risks in the z/OS infrastructure for peak workloads or configuration issues prior to production impact being felt by application end-users. Go beyond KPI to KRI (Key Risk Indicators) root cause monitoring.
    Continuous Health Assessment of application and infrastructure stress; assesses millions of metrics using context-specific expert knowledge and statistical techniques.

    Resolve Issues Quickly

    Accelerate Mean Time To Resolution for unpredictable problems with AI-augmented diagnosis.

    Benefits

    Rapidly identify where problems are occurring with infrastructure wide exception (anomaly) tables, intelligent navigation through the data from big picture to extremely granular levels, automated compare of time periods, and more.
    See and understand what applications are affected, what part of the infrastructure, what time frames, and get clues as to probable cause.

    Flexible Deployment and Monitoring

    In the Cloud

    Cloud based deployment can be accessed from everywhere in the world and is easy to share with colleagues

    Services & Support

    Take advantage of IntelliMagic's experienced performance experts for standalone custom services or daily monitoring

    On Premise

    Install the software on premise and use it offline for total control of your installation

    Reduce Costs, Improve Performance, and Protect Availability

    Through RMF and SMF, z/OS offers a richer source of infrastructure measurement data than any other computing platform. However, the potential to use this wealth of information to prevent service disruptions remains vastly underutilized. This data cannot simply be interpreted without the right intelligence.

    IntelliMagic Vision enhances the RMF/SMF data and applies its built-in knowledge to understand how the z/OS architecture handles your workloads. This helps you tune z/OS to improve performance and protect availability, and can also help tuning your processor configuration to increase the MIPS you get out of your mainframe hardware.

    Continue Learning with These Resources

    Connect With an Expert

    Discuss your technical or sales-related questions with our mainframe experts today