Monitor Disk & Replication Performance with IntelliMagic Vision
IntelliMagic Vision enables performance analysts to manage and optimize their z/OS Disk and Replication environment more effectively and efficiently.
View the video for an example of those capabilities.

Monitor and Optimize Disk & Replication Performance with Built-In Health Insights and AI

Proactively Analyze and Prevent Risks
Utilize built-in health insights and artificial intelligence to proactively identify risks, ensure availability, and optimize your z/OS storage environment.
Save Time and Quickly Resolve Issues
Quickly spot and resolve issues using thousands of out-of-the-box reports, built-in live edit, compare, share, and drill down features.

Expedite Learning and Enhance Domain Expertise
Detailed built-in explanations, guided drilldown options, and end-to-end z/OS support facilitates easy system understanding and knowledge transfer.
Built-In Intelligence at Your Fingertips
Daily Health Insights
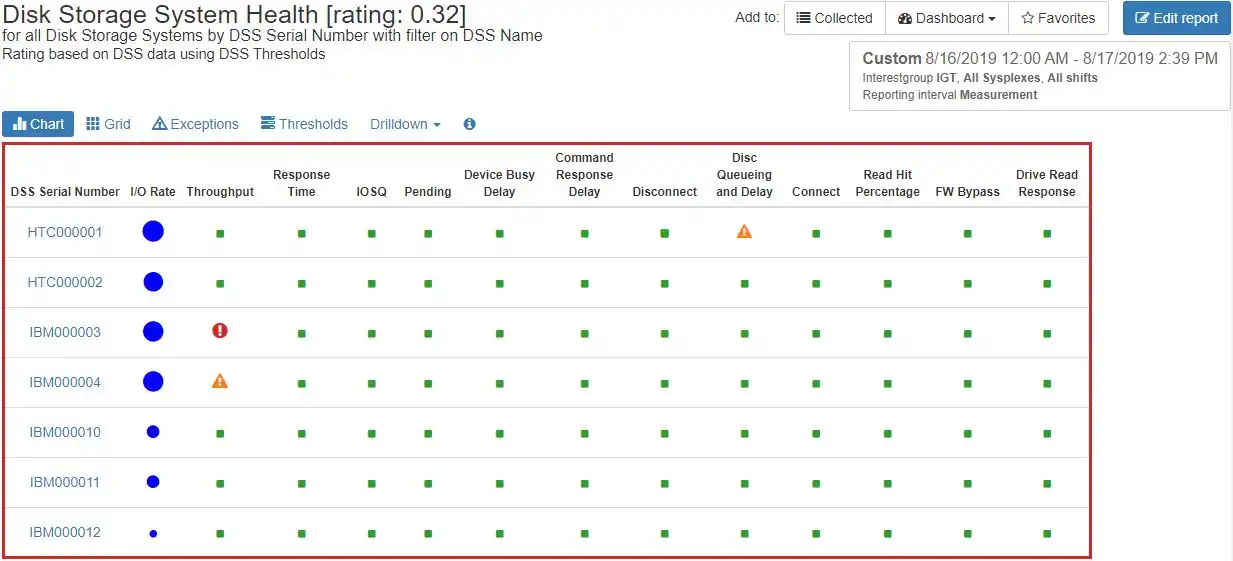
Health insights and exception reports alert you to any aspects of your storage systems that need attention. Hundreds of metrics are automatically assessed for each time interval, and they are highlighted if they are not within acceptable bounds.
In this example, we have a mixture of IBM and HDS storage systems. We see alerts for one HDS system for excessive disconnect queueing and delays and alerts on two IBM systems for throughput higher than recommended by best practices.
IntelliMagic Vision also provides recommendations on what actions to take depending on what specific alert is encountered.
Compare LPAR and FICON Topology Time Intervals
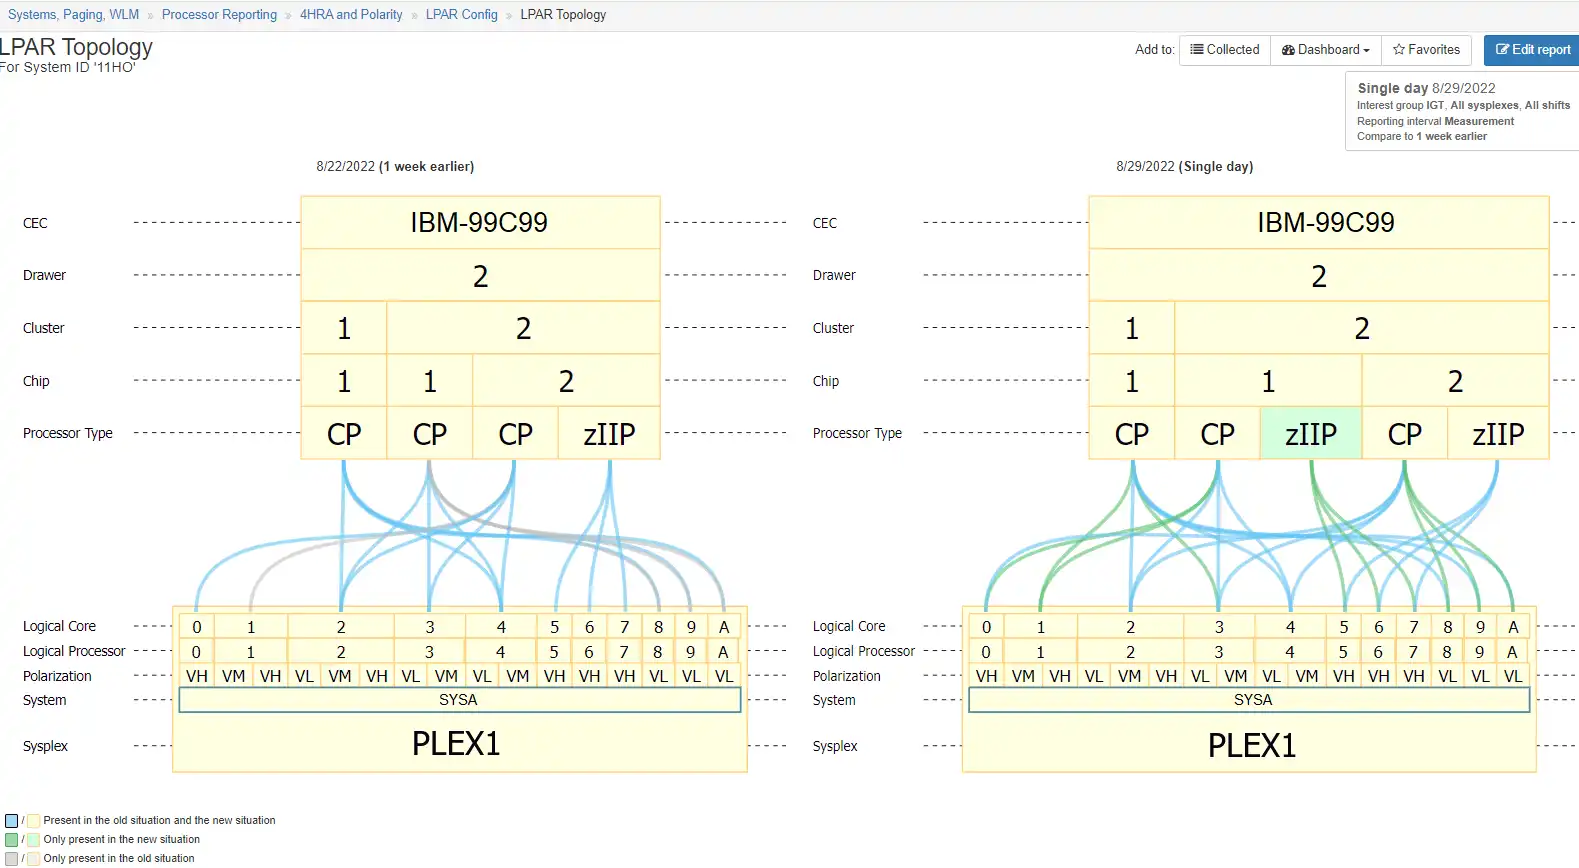
Figure 1: Comparing two views, with the benefit of color coding changes, gives the user an easy to understand identification of configuration changes.
z/OS topology's (FICON and LPAR) are incredibly complex and difficult to visualize. Traditional methods of viewing these topology's have involved manually printing the topology out on paper and pasting it to physical walls in order to understand the configuration and spot errors.
IntelliMagic Vision's interactive LPAR and FICON topology viewers allows analysts to interact with, drill down into, and compare time intervals for their FICON and LPAR topology's - crucial for spotting errors and changes that may impact costs.
Time Charts for Deeper Insight
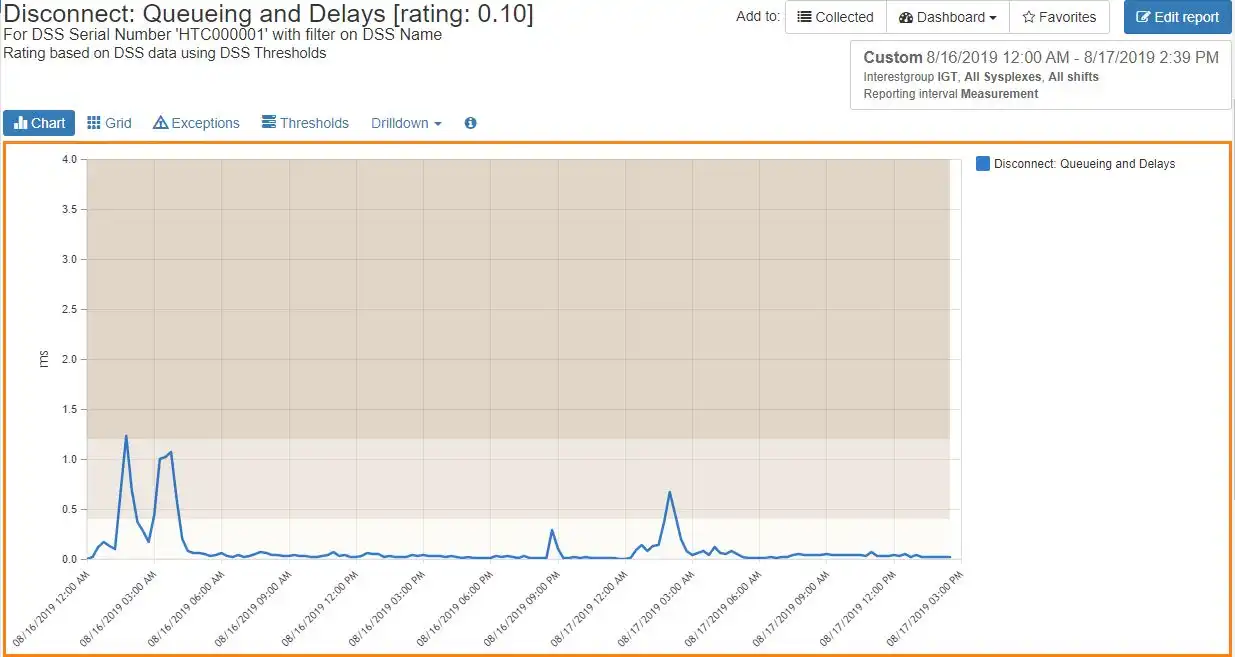
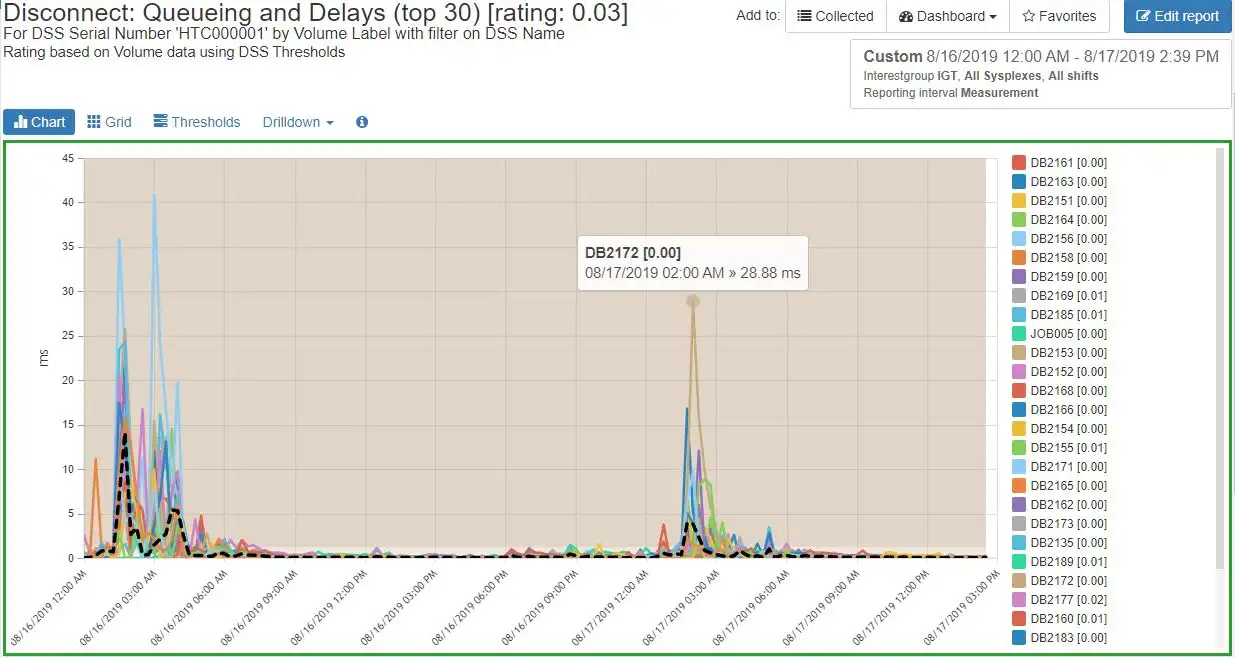
From the exception reports, it is a simple matter to drill down to see a detailed time chart of the metric that has been flagged.
This helps you narrow down the time frame when the behavior occurred and correlate this to any application impacts that may have resulted.
Comparison Charts and Change Detection
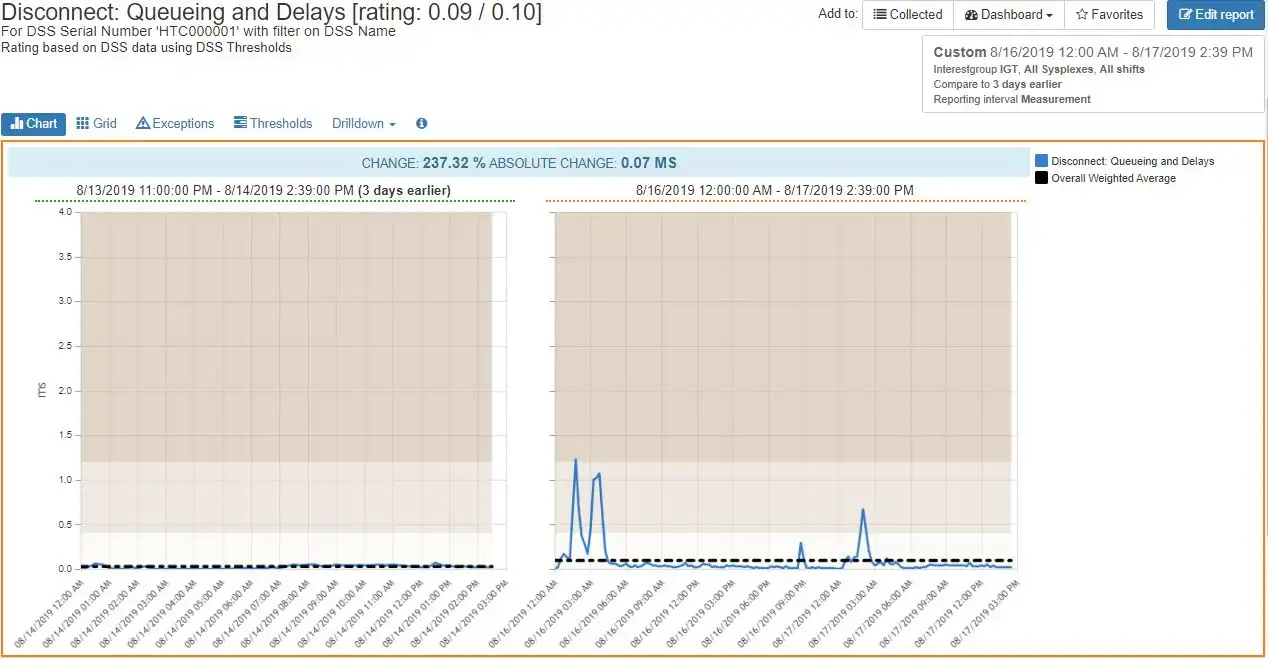
Comparison charts are very useful for determining when a particular behavior began and if this is a one-time anomaly or part of an ongoing trend.
In this example, we compare the Disconnect Queuing and delays to an earlier period, and it is easy to see that this is a new behavior. Any further investigation may be limited to the time frame that has been established.
Drill Down to Specific Volumes, Datasets, or Address Spaces
From a time chart, there are many drill downs available to see the metric at a more detailed level of granularity.
Here the drill down has too many active volumes. We can see that all the affected volumes are Db2. Thus, it is likely that any application impact may be Db2 related.
Track Key Metrics for Synchronous and Asynchronous Replication
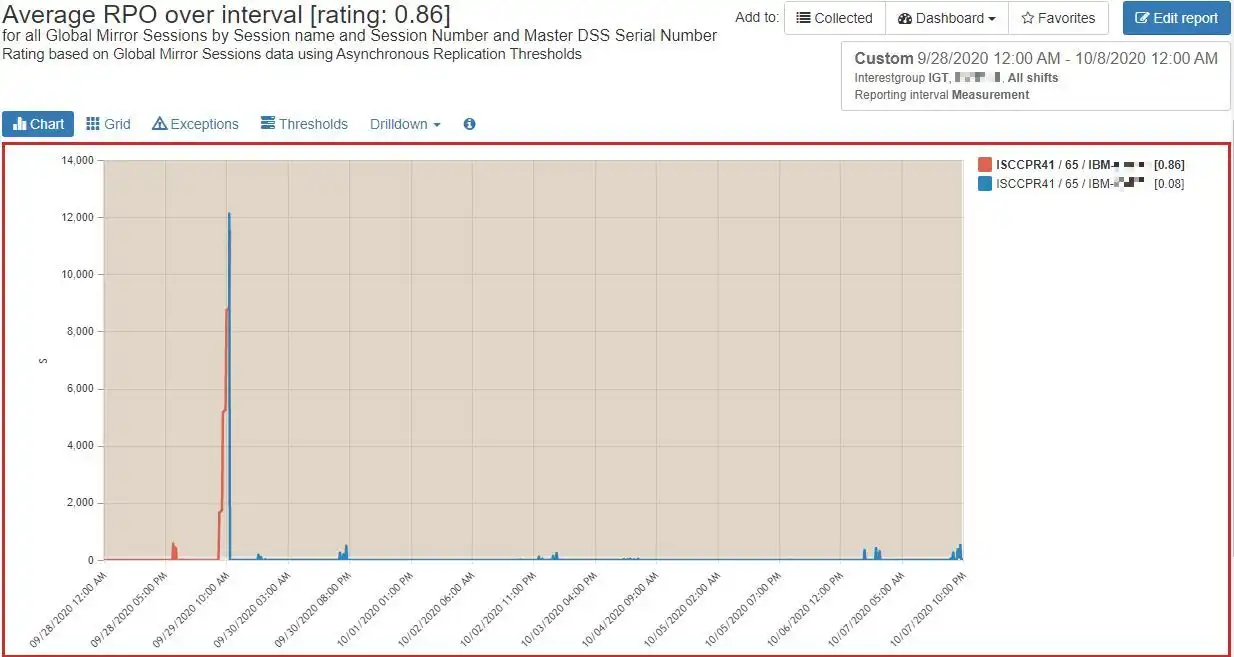
The need for continuous availability has made replication a critical aspect of disk storage. Monitoring the health of your data replication is key to meeting both business and regulatory requirements. IntelliMagic Vision tracks key metrics for both Synchronous and Asynchronous replication methods.
For example, with Asynchronous replication, it is important that your remote data does not fall too far behind your production site. The chart to the right illustrates how IntelliMagic Vision can show you your RPO and diagnose when your replication is struggling to keep up.
Trend Analysis for your Key I/O Measurements
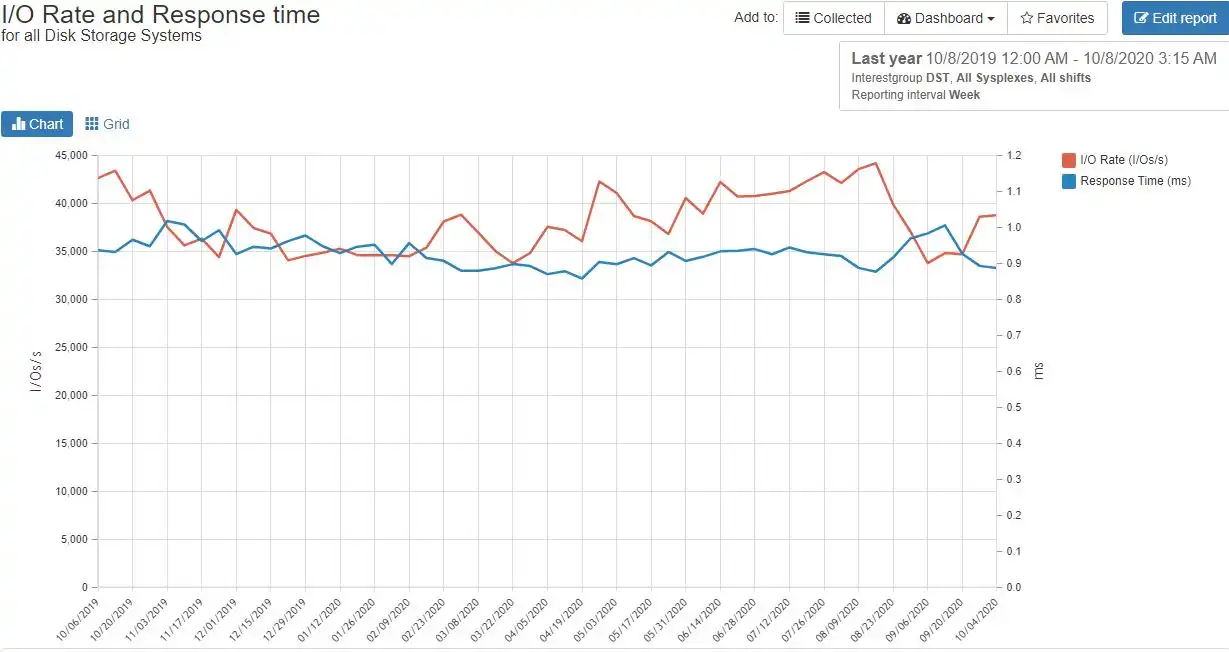
It is difficult to do proper long-term planning without data to inform you of where things stand and where your operations are heading. IntelliMagic Vision provides you with numerous trending charts that help you get a handle on this.
The example to the left shows how the overall I/O Rate and I/O Response Time have been trending over the last year. In this case there has been a modest increase in I/O Rate and a decrease in response time. This can be very helpful when deciding if a storage hardware upgrade is necessary or may be deferred.
AIOps via SaaS Delivery

Advantages to adopting a cloud model include rapid implementation (no lead time to install and setup the product locally), minimal setup (only for transmitting SMF data), offloading staff resources required to deal with SMF processing issues or to install product maintenance, and easy access to IntelliMagic consulting services to supplement local skills.
Daily Health Insights
Health insights and exception reports alert you to any aspects of your storage systems that need attention. Hundreds of metrics are automatically assessed for each time interval, and they are highlighted if they are not within acceptable bounds.
In this example, we have a mixture of IBM and HDS storage systems. We see alerts for one HDS system for excessive disconnect queueing and delays and alerts on two IBM systems for throughput higher than recommended by best practices.
IntelliMagic Vision also provides recommendations on what actions to take depending on what specific alert is encountered.
Compare LPAR and FICON Topology Time Intervals
Figure 1: Comparing two views, with the benefit of color coding changes, gives the user an easy to understand identification of configuration changes.
z/OS topology's (FICON and LPAR) are incredibly complex and difficult to visualize. Traditional methods of viewing these topology's have involved manually printing the topology out on paper and pasting it to physical walls in order to understand the configuration and spot errors.
IntelliMagic Vision's interactive LPAR and FICON topology viewers allows analysts to interact with, drill down into, and compare time intervals for their FICON and LPAR topology's - crucial for spotting errors and changes that may impact costs.
Time Charts for Deeper Insight
From the exception reports, it is a simple matter to drill down to see a detailed time chart of the metric that has been flagged.
This helps you narrow down the time frame when the behavior occurred and correlate this to any application impacts that may have resulted.
Comparison Charts and Change Detection
Comparison charts are very useful for determining when a particular behavior began and if this is a one-time anomaly or part of an ongoing trend.
In this example, we compare the Disconnect Queuing and delays to an earlier period, and it is easy to see that this is a new behavior. Any further investigation may be limited to the time frame that has been established.
Drill Down to Specific Volumes, Datasets, or Address Spaces
From a time chart, there are many drill downs available to see the metric at a more detailed level of granularity.
Here the drill down has too many active volumes. We can see that all the affected volumes are Db2. Thus, it is likely that any application impact may be Db2 related.
Track Key Metrics for Synchronous and Asynchronous Replication
The need for continuous availability has made replication a critical aspect of disk storage. Monitoring the health of your data replication is key to meeting both business and regulatory requirements. IntelliMagic Vision tracks key metrics for both Synchronous and Asynchronous replication methods.
For example, with Asynchronous replication, it is important that your remote data does not fall too far behind your production site. The chart to the right illustrates how IntelliMagic Vision can show you your RPO and diagnose when your replication is struggling to keep up.
Trend Analysis for your Key I/O Measurements
It is difficult to do proper long-term planning without data to inform you of where things stand and where your operations are heading. IntelliMagic Vision provides you with numerous trending charts that help you get a handle on this.
The example to the left shows how the overall I/O Rate and I/O Response Time have been trending over the last year. In this case there has been a modest increase in I/O Rate and a decrease in response time. This can be very helpful when deciding if a storage hardware upgrade is necessary or may be deferred.
AIOps via SaaS Delivery
Advantages to adopting a cloud model include rapid implementation (no lead time to install and setup the product locally), minimal setup (only for transmitting SMF data), offloading staff resources required to deal with SMF processing issues or to install product maintenance, and easy access to IntelliMagic consulting services to supplement local skills.


See Why IntelliMagic is Trusted by Some of the World’s Largest Mainframe Sites
End-to-End Infrastructure Analytics for z/OS Performance and Capacity Planning
zSystems Performance Management
Optimize z/OS Mainframe Systems Management with Availability Intelligence
Benefits
Optimize z/OS Systems performance management using AI-driven analytics to proactively monitor and manage your z/OS environment, prevent disruptions, reduce costs, and preserve the reliability and availability that mainframes are known for.
Explore z/OS Systems Performance Analytics
Db2 Performance Management
Prevent Availability Risks and Optimize Db2 Performance
Benefits
The volume and complexity of Db2 Statistics data and Db2 Accounting data creates a major challenge for analysts who want to derive value from the rich metrics available.
Easy visibility into key Db2 metrics through SMF records is crucial to proactively prevent availability risks and to effectively manage and optimize performance.
Explore Db2 Performance Analytics
Easy visibility into key Db2 metrics through SMF records is crucial to proactively prevent availability risks and to effectively manage and optimize performance.
CICS Performance Management
Monitor and Profile CICS Transactions and Regions with IntelliMagic Vision
Benefits
CICS SMF Transaction data is a rich source of performance insights, but its volume can make analysis challenging using traditional approaches that rely on static reports. Proactive assessment of key Statistics metrics across all regions is essential to identify potential risks to availability.
IntelliMagic Vision enables performance analysts to manage and optimize their z/OS CICS transactions more effectively and efficiently, as well as proactively assess the health of their CICS regions.
Explore CICS Performance Analytics
IntelliMagic Vision enables performance analysts to manage and optimize their z/OS CICS transactions more effectively and efficiently, as well as proactively assess the health of their CICS regions.
Virtual Tape Performance Management
Proactively Manage Virtual and Physical Tape Environments
Benefits
With tape virtualization, tape storage became easier and more economical, but at the same time, more difficult to understand which changes or hardware upgrades are the best choices. With tape libraries being shared across multiple z/OS images, the full picture can only be obtained by aggregating workload and tape hardware information from all z/OS LPARs.
IntelliMagic Vision enables performance analysts to manage and optimize their z/OS Virtual Tape environments more effectively and efficiently.
Explore Tape Performance Analytics
IntelliMagic Vision enables performance analysts to manage and optimize their z/OS Virtual Tape environments more effectively and efficiently.
Disk & Replication Performance Management
Automatically Detect DASD Performance Risks & Quickly Resolve Issues
Benefits
As DASD speeds and throughputs have increased, z/OS applications have come to rely on fast and consistent storage performance. To respond quickly to unexpected disk and replication issues, it is essential that you have insight into the health of the various components in your storage environment.
IntelliMagic Vision enables performance analysts to manage and optimize their z/OS Disk and Replication environment more effectively and efficiently.
Explore Disk Performance Analytics
IntelliMagic Vision enables performance analysts to manage and optimize their z/OS Disk and Replication environment more effectively and efficiently.
MQ Performance Management
Optimize and Analyze MQ Activity and Performance
Benefits
MQ is widely used across z/OS environments, but sites often find it challenging to derive the valuable performance insights potentially available from MQ SMF Statistics and Accounting data due to limitations in existing reporting and available tooling.
IntelliMagic Vision enables performance analysts to manage and optimize their z/OS MQ configurations and activity more effectively and efficiently, as well as proactively assess the health of their queue managers.
Explore MQ Performance Analytics
IntelliMagic Vision enables performance analysts to manage and optimize their z/OS MQ configurations and activity more effectively and efficiently, as well as proactively assess the health of their queue managers.
z/OS Network Performance Management
Automatically Monitor Mainframe Network Security and Protect Your Data
Benefits
TCP/IP is the core of the communication for the z/OS mainframe, both for traffic into and out of the mainframe and internal communication among z/OS images and processor complexes. Proper management is necessary to secure and protect system availability.
IntelliMagic Vision automatically generates GUI-based, interactive, IBM best-practice compliant rated reports that proactively identify areas that indicate potential upcoming risk to TCP/IP health, performance, and security.
Explore z/OS Network Performance Analytics
IntelliMagic Vision automatically generates GUI-based, interactive, IBM best-practice compliant rated reports that proactively identify areas that indicate potential upcoming risk to TCP/IP health, performance, and security.
z/OS Connect: Modern Mainframe API Environment
Optimizing Mainframe API Monitoring for Improved Resource Management
Benefits
IntelliMagic Vision enhances mainframe API monitoring and profiling, providing crucial visibility to address issues at the API or service level, ultimately aiding performance analysts in better resource planning and management reporting.
Explore z/OS Connect Analytics
Flexible Deployment and Monitoring

In the Cloud
Cloud based deployment can be accessed from everywhere in the world and is easy to share with colleagues

Services & Support
Take advantage of IntelliMagic's experienced performance experts for standalone custom services or daily monitoring

On Premise
Install the software on premise and use it offline for total control of your installation
Book a Demo or Connect With an Expert
Discuss your technical or sales-related questions with our mainframe experts today
Automatically Detect z/OS Disk Performance Risks & Quickly Resolve Issues
As Disk speeds and throughputs have increased, z/OS applications have come to rely on fast and consistent storage performance. To respond quickly to unexpected disk and replication issues, it is essential that you have insight into the health of the various components in your storage environment. Although RMF offers extensive performance measurements for your Disk, it is very difficult to proactively use this data without the intelligence provided by IntelliMagic Vision.
IntelliMagic Vision provides continuous assessment of the health of your disk and replication systems. Thus, if there is an incremental degradation in any aspect of your system, you will be able to address it before it causes any business impact. This will reduce risk and save you time and money.
Of course, not all problems occur gradually. If there is a sudden change caused by a hardware failure, or a change in resource utilization or workload pattern, IntelliMagic will help you rapidly zoom in on what happened. Instead of wasting precious time searching for the cause, you can move directly to a solution.
Continue Learning with These Resources
White Papers
Connect With an Expert
Discuss your technical or sales-related questions with our mainframe experts today