Monitor Disk & Replication Performance with IntelliMagic Vision
IntelliMagic Vision enables performance analysts to manage and optimize their z/OS Disk and Replication environment more effectively and efficiently.
View the video for an example of those capabilities.

Built-In Intelligence at Your Fingertips
Effective Channel Data Rate
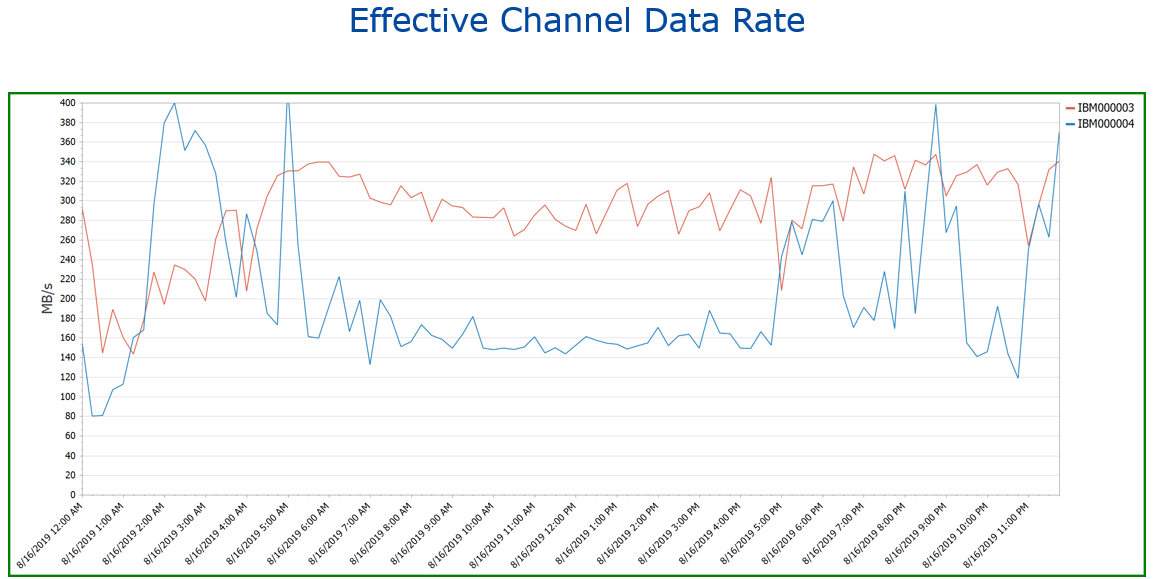
When analyzing FICON channels, it is normally not possible to draw conclusions based on their utilization alone: 60% may or may not be a good value; it really depends on the type of work being done.
With FICON being a multiplexing technology, a measure that is more indicative of how well the FICON channel is dealing with individual I/O requests is the effective channel rate, i.e. how much time does the channel need to transfer a given amount of data.
A low effective data rate indicates that there is much demand for the channel, which causes connect time elongation and thereby increases I/O service time.
IntelliMagic Vision computes and charts FICON Effective Channel Data Rate and rates whether the value is good or too low.
Director Port Errors
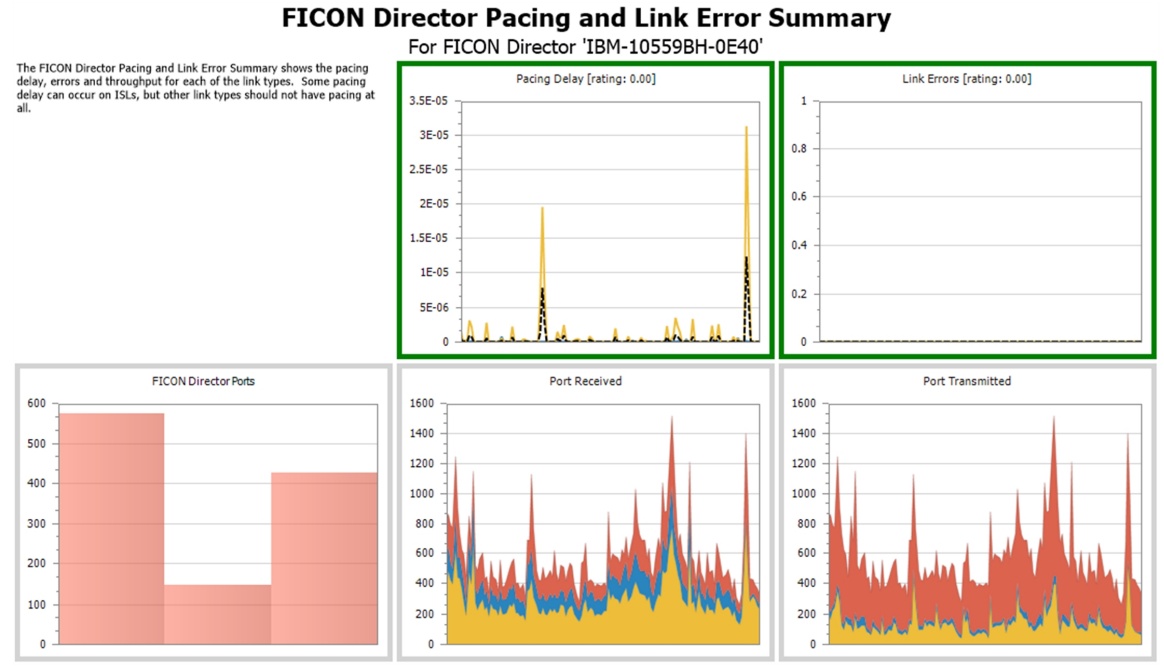
The FICON Director Pacing and Link Error Summary shows the pacing delay, errors and throughput for each of the link types.
Some pacing delay can occur on ISLs, but other link types should not have pacing at all.
Channel Utilization
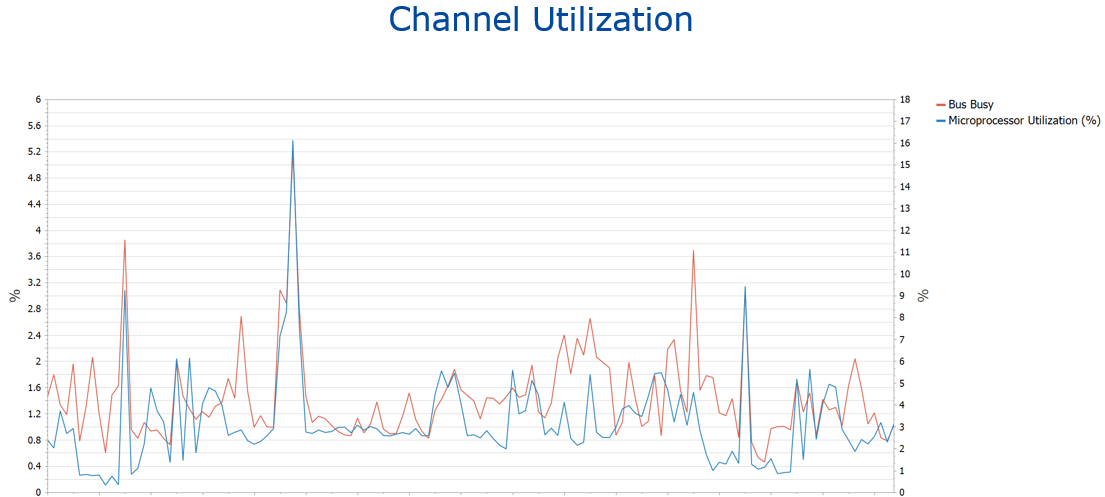
Visibility into the utilization of each channel helps analyze the overall health of the I/O subsystem. The channels need to be monitored for microprocessor utilization (IOP-driven) and Bus Busy (Throughput-driven).
Front-End Host Adapter Utilization
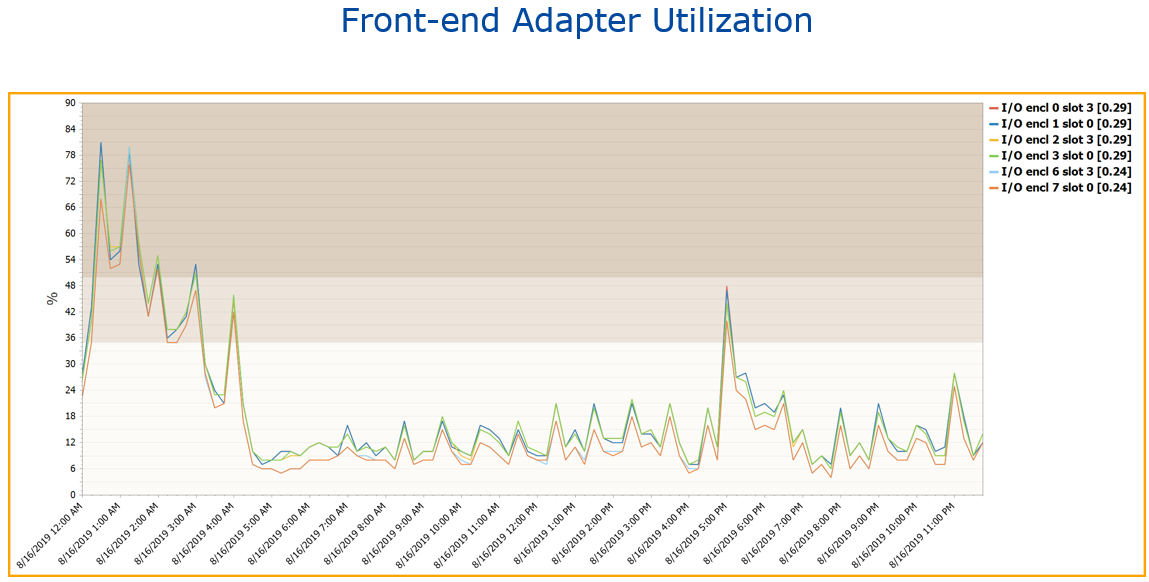
Monitoring and analyzing the storage system’s front-end adapters helps you analyze availability resiliency, watches for imbalance, and needs to consider both host and replication traffic.
Often times the aggregate throughput of a storage system’s front end adapter (Host Adapter) is less than the sum of the individual parts.
IntelliMagic Vision automatically computes the sum of the key metrics for all ports on a given host adapter to provide an easy means to interpret the utilization of the host adapters.
Effective Channel Data Rate
When analyzing FICON channels, it is normally not possible to draw conclusions based on their utilization alone: 60% may or may not be a good value; it really depends on the type of work being done.
With FICON being a multiplexing technology, a measure that is more indicative of how well the FICON channel is dealing with individual I/O requests is the effective channel rate, i.e. how much time does the channel need to transfer a given amount of data.
A low effective data rate indicates that there is much demand for the channel, which causes connect time elongation and thereby increases I/O service time.
IntelliMagic Vision computes and charts FICON Effective Channel Data Rate and rates whether the value is good or too low.
Director Port Errors
The FICON Director Pacing and Link Error Summary shows the pacing delay, errors and throughput for each of the link types.
Some pacing delay can occur on ISLs, but other link types should not have pacing at all.
Channel Utilization
Visibility into the utilization of each channel helps analyze the overall health of the I/O subsystem. The channels need to be monitored for microprocessor utilization (IOP-driven) and Bus Busy (Throughput-driven).
Front-End Host Adapter Utilization
Monitoring and analyzing the storage system’s front-end adapters helps you analyze availability resiliency, watches for imbalance, and needs to consider both host and replication traffic.
Often times the aggregate throughput of a storage system’s front end adapter (Host Adapter) is less than the sum of the individual parts.
IntelliMagic Vision automatically computes the sum of the key metrics for all ports on a given host adapter to provide an easy means to interpret the utilization of the host adapters.
End-to-End Infrastructure Analytics for z/OS Performance and Capacity Planning
zSystems Performance Management
Optimize z/OS Mainframe Systems Management with Availability Intelligence
Benefits
Optimize z/OS Systems performance management using AI-driven analytics to proactively monitor and manage your z/OS environment, prevent disruptions, reduce costs, and preserve the reliability and availability that mainframes are known for.
Learn More
Db2 Performance Management
Prevent Availability Risks and Optimize Db2 Performance
Benefits
The volume and complexity of Db2 Statistics data and Db2 Accounting data creates a major challenge for analysts who want to derive value from the rich metrics available.
Easy visibility into key Db2 metrics through SMF records is crucial to proactively prevent availability risks and to effectively manage and optimize performance.
Learn More
Easy visibility into key Db2 metrics through SMF records is crucial to proactively prevent availability risks and to effectively manage and optimize performance.
CICS Performance Management
Monitor and Profile CICS Transactions and Regions with IntelliMagic Vision
Benefits
CICS SMF Transaction data is a rich source of performance insights, but its volume can make analysis challenging using traditional approaches that rely on static reports. Proactive assessment of key Statistics metrics across all regions is essential to identify potential risks to availability.
IntelliMagic Vision enables performance analysts to manage and optimize their z/OS CICS transactions more effectively and efficiently, as well as proactively assess the health of their CICS regions.
Learn More
IntelliMagic Vision enables performance analysts to manage and optimize their z/OS CICS transactions more effectively and efficiently, as well as proactively assess the health of their CICS regions.
Virtual Tape Performance Management
Proactively Manage Virtual and Physical Tape Environments
Benefits
With tape virtualization, tape storage became easier and more economical, but at the same time, more difficult to understand which changes or hardware upgrades are the best choices. With tape libraries being shared across multiple z/OS images, the full picture can only be obtained by aggregating workload and tape hardware information from all z/OS LPARs.
IntelliMagic Vision enables performance analysts to manage and optimize their z/OS Virtual Tape environments more effectively and efficiently.
Learn More
IntelliMagic Vision enables performance analysts to manage and optimize their z/OS Virtual Tape environments more effectively and efficiently.
Disk & Replication Performance Management
Automatically Detect Disk Performance Risks & Quickly Resolve Issues
Benefits
As Disk speeds and throughputs have increased, z/OS applications have come to rely on fast and consistent storage performance. To respond quickly to unexpected disk and replication issues, it is essential that you have insight into the health of the various components in your storage environment.
IntelliMagic Vision enables performance analysts to manage and optimize their z/OS Disk and Replication environment more effectively and efficiently.
Learn More
IntelliMagic Vision enables performance analysts to manage and optimize their z/OS Disk and Replication environment more effectively and efficiently.
MQ Performance Management
Optimize and Analyze MQ Activity and Performance
Benefits
MQ is widely used across z/OS environments, but sites often find it challenging to derive the valuable performance insights potentially available from MQ SMF Statistics and Accounting data due to limitations in existing reporting and available tooling.
IntelliMagic Vision enables performance analysts to manage and optimize their z/OS MQ configurations and activity more effectively and efficiently, as well as proactively assess the health of their queue managers.
Learn More
IntelliMagic Vision enables performance analysts to manage and optimize their z/OS MQ configurations and activity more effectively and efficiently, as well as proactively assess the health of their queue managers.
z/OS Network Performance Management
Automatically Monitor Mainframe Network Security and Protect Your Data
Benefits
TCP/IP is the core of the communication for the z/OS mainframe, both for traffic into and out of the mainframe and internal communication among z/OS images and processor complexes. Proper management is necessary to secure and protect system availability.
IntelliMagic Vision automatically generates GUI-based, interactive, IBM best-practice compliant rated reports that proactively identify areas that indicate potential upcoming risk to TCP/IP health, performance, and security.
Learn More
IntelliMagic Vision automatically generates GUI-based, interactive, IBM best-practice compliant rated reports that proactively identify areas that indicate potential upcoming risk to TCP/IP health, performance, and security.
WebSphere Performance Management
Track Response Time and Resource Consumption of WebSphere Transactions
Benefits
Technical specialists responsible for the health of WebSphere applications need performance-management level data to supplement deep-dive APM solutions and monitors. Understanding the overall environment and workload characteristics and the ability to drill down to narrow a problem space are extremely helpful.
IntelliMagic Vision supports the WebSphere Application Server for z/OS transaction logging records (SMF 120 subtype 9), enabling you to track transaction response time and resource consumption.
Learn More
IntelliMagic Vision supports the WebSphere Application Server for z/OS transaction logging records (SMF 120 subtype 9), enabling you to track transaction response time and resource consumption.
IntelliMagic is Trusted by Several of the Largest Mainframe Shops in the World
Book a Demo or Connect With an Expert
Discuss your technical or sales-related questions with our mainframe experts today
Solutions for your Problems
Elevate IT Team Impact
Empower new staff and experts. Replace antiquated reporting with automated, intelligent analytics.
Benefits
Artificial Intelligence using built-in expert knowledge and statistics assesses and rates key metrics as good versus bad from a performance or efficiency perspective for the analyst.
Force multiplier - Invite AI to the team to help both new and expert team members in a tight job market.
Cloud Delivery - Immediate access with no maintenance needed.
Force multiplier - Invite AI to the team to help both new and expert team members in a tight job market.
Cloud Delivery - Immediate access with no maintenance needed.
Optimize & Reduce Costs Safely
Save money without compromising service levels or availability.
Benefits
Reduce cost with superior visibility into drivers of cost such as inefficient CPU utilization, configuration and priority issues, imbalance of workloads across hardware resources, consolidation opportunities, etc.
Reduce hardware spend without negative impact on service levels.
Avoid the costs of service delivery problems without both human cost and application unavailability cost.
Reduce hardware spend without negative impact on service levels.
Avoid the costs of service delivery problems without both human cost and application unavailability cost.
Prevent Performance Problems
Predict and Prevent many IT issues without incurring typical false positive and false negative issues.
Benefits
Automatically quantify risks in the z/OS infrastructure for peak workloads or configuration issues prior to production impact being felt by application end-users. Go beyond KPI to KRI (Key Risk Indicators) root cause monitoring.
Continuous Health Assessment of application and infrastructure stress; assesses millions of metrics using context-specific expert knowledge and statistical techniques.
Continuous Health Assessment of application and infrastructure stress; assesses millions of metrics using context-specific expert knowledge and statistical techniques.
Resolve Issues Quickly
Accelerate Mean Time To Resolution for unpredictable problems with AI-augmented diagnosis.
Benefits
Rapidly identify where problems are occurring with infrastructure wide exception (anomaly) tables, intelligent navigation through the data from big picture to extremely granular levels, automated compare of time periods, and more.
See and understand what applications are affected, what part of the infrastructure, what time frames, and get clues as to probable cause.
See and understand what applications are affected, what part of the infrastructure, what time frames, and get clues as to probable cause.
Flexible Deployment and Monitoring

In the Cloud
Cloud based deployment can be accessed from everywhere in the world and is easy to share with colleagues

Services & Support
Take advantage of IntelliMagic's experienced performance experts for standalone custom services or daily monitoring

On Premise
Install the software on premise and use it offline for total control of your installation
Connect With an Expert
Discuss your technical or sales-related questions with our mainframe experts today