Monitor and Profile API Calls and Back-End Services
APIs are the interface between your z/OS resources and the outside world. Issues at the API or service level can be very difficult to address without the right visibility.
IBM Z IntelliMagic Vision for z/OS enables performance analysts to manage and optimize their mainframe API environment, and to profile the requests coming into your system for essential management reporting and resource planning.

Optimize Your Mainframe API Environment and Elevate Your Capabilities

Optimize Your Environment and Profile Requests
Seamlessly access critical information, such as significant drivers of demand, API rates and response time, service levels, and more.
Save Time and Quickly Resolve Issues
Quickly spot and resolve issues using thousands of out-of-the-box reports, built-in live edit, compare, share, and drill down features.

Expedite Learning and Enhance Domain Expertise
Detailed built-in explanations, guided drilldown options, and end-to-end z/OS support facilitates easy system understanding and knowledge transfer.
How Does IBM Z IntelliMagic Vision for z/OS Unlock the Full Potential of Your Analysis?
Business-Level Reporting
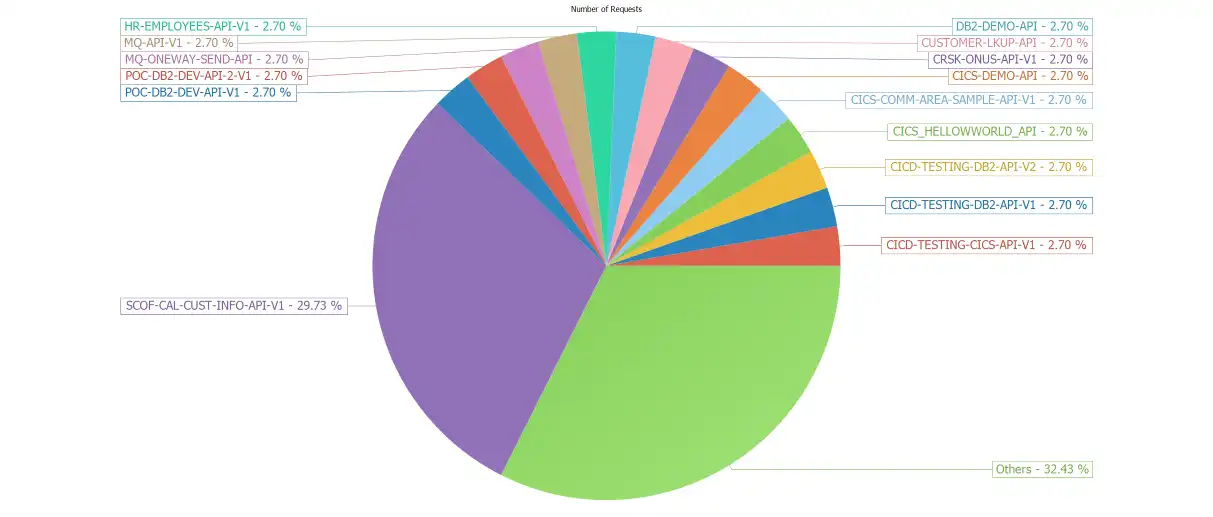
Business and technical management alike need to see their workloads in terms that are meaningful to them, and a picture is worth a thousand words.
IBM Z IntelliMagic Vision for z/OS makes it easy to share any of our 30,000+ pre-built reports, or pre-built and custom dashboards, charts, and reports. For z/OS Connect, sharing request rates and response times for different API calls over time helps facilitate communication and planning between Business and IT.
Response Time vs Transaction Rate
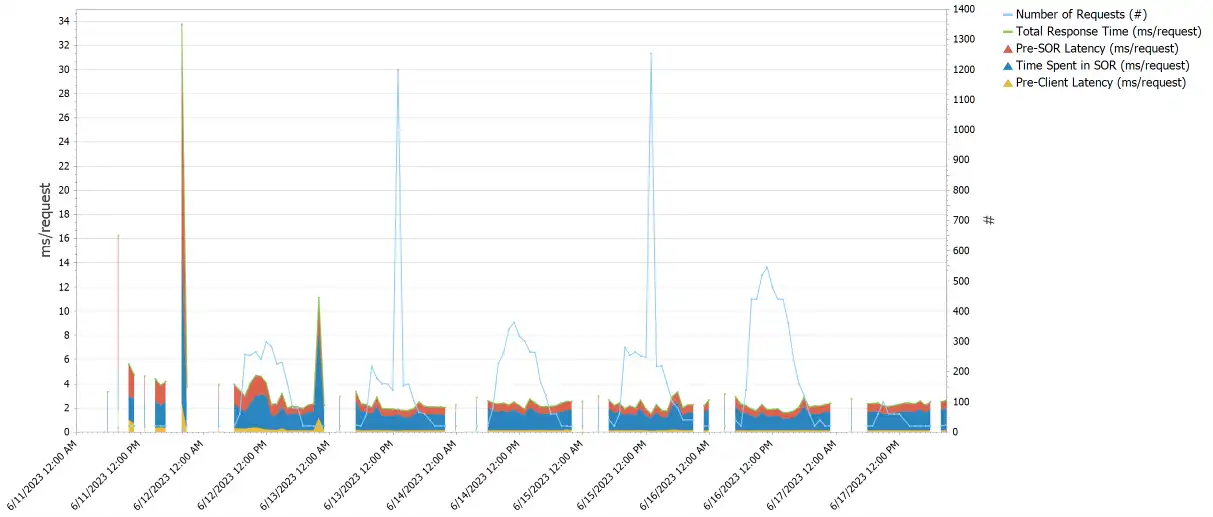
Viewing the overall transaction rate and response times in the same view lets you quickly narrow the problem space in case of issues, or profile your workloads for trending analysis.
You also see the response time breakdown into components such as Time Spent in System of Record (SOR). As with all the other data presented in IBM Z IntelliMagic Vision for z/OS, this could be as granular as you want, all the way down to the individual API level, as well as profiled over days/weeks/months.
API Call to Service Mapping
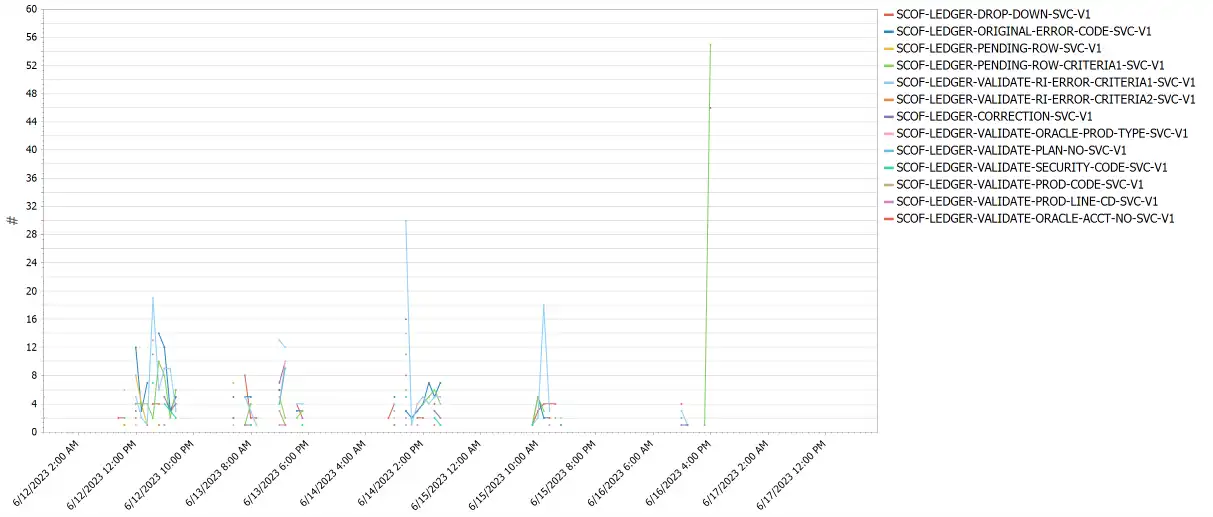
Many API calls invoke a single service, but that is not always the case. Drilling down from a specific API to the services invoked will provide a clear picture of these relationships and allow you to investigate changes or problems at the service or SOR level.
Call volumes and response times are available at any level within IBM Z IntelliMagic Vision for z/OS, and filtering to a specific API, service, or server will help you quickly narrow down the problem space in the event of issues.
API Provider and API Requester Data
APIs may be used to provide access to mainframe resources (Provider), or to allow mainframe applications to request data from off-platform (Requester).
IBM Z IntelliMagic Vision for z/OS makes analysis and reporting for both types of calls easy and intuitive. Where differences exist between the call types, such as the response time components reported, you have access to all the key metrics provided for that type of call.
System of Record Detail
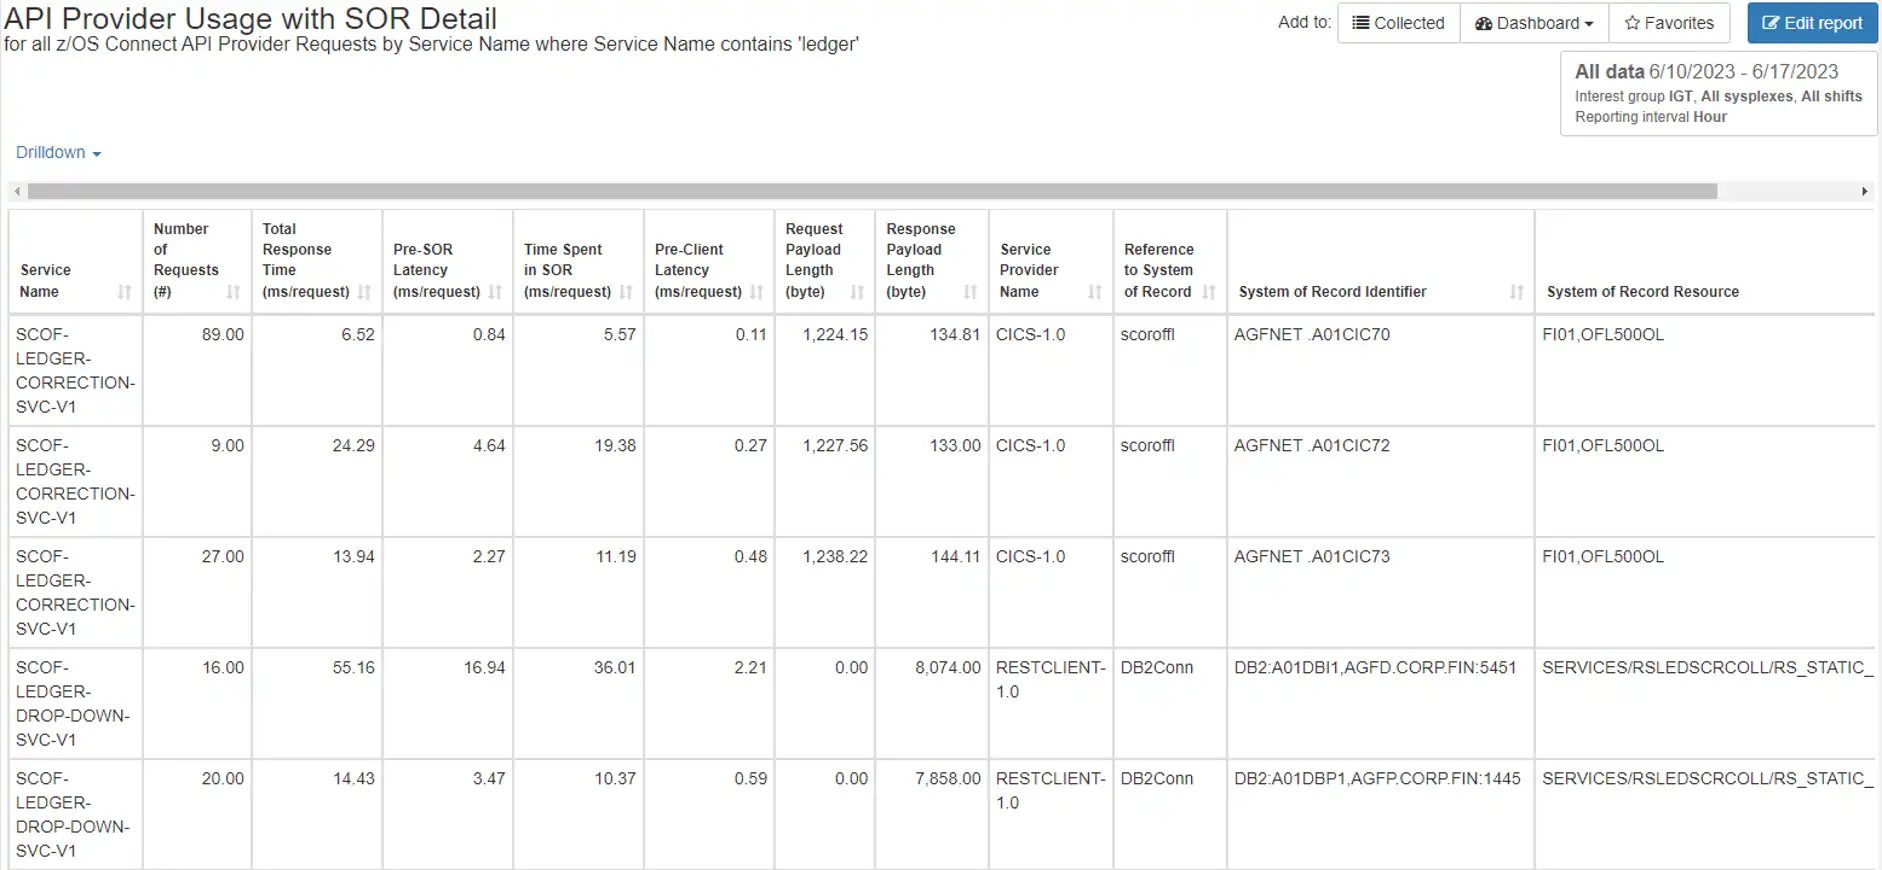
A full understanding of your API Provider applications requires a knowledge of the back-end systems invoked.
With IBM Z IntelliMagic Vision for z/OS you can easily map services to the System of Record (SOR) Identifier and System of Record Resource to identify, for example, the CICS region and transaction invoked by a particular service.
API Requester Detail
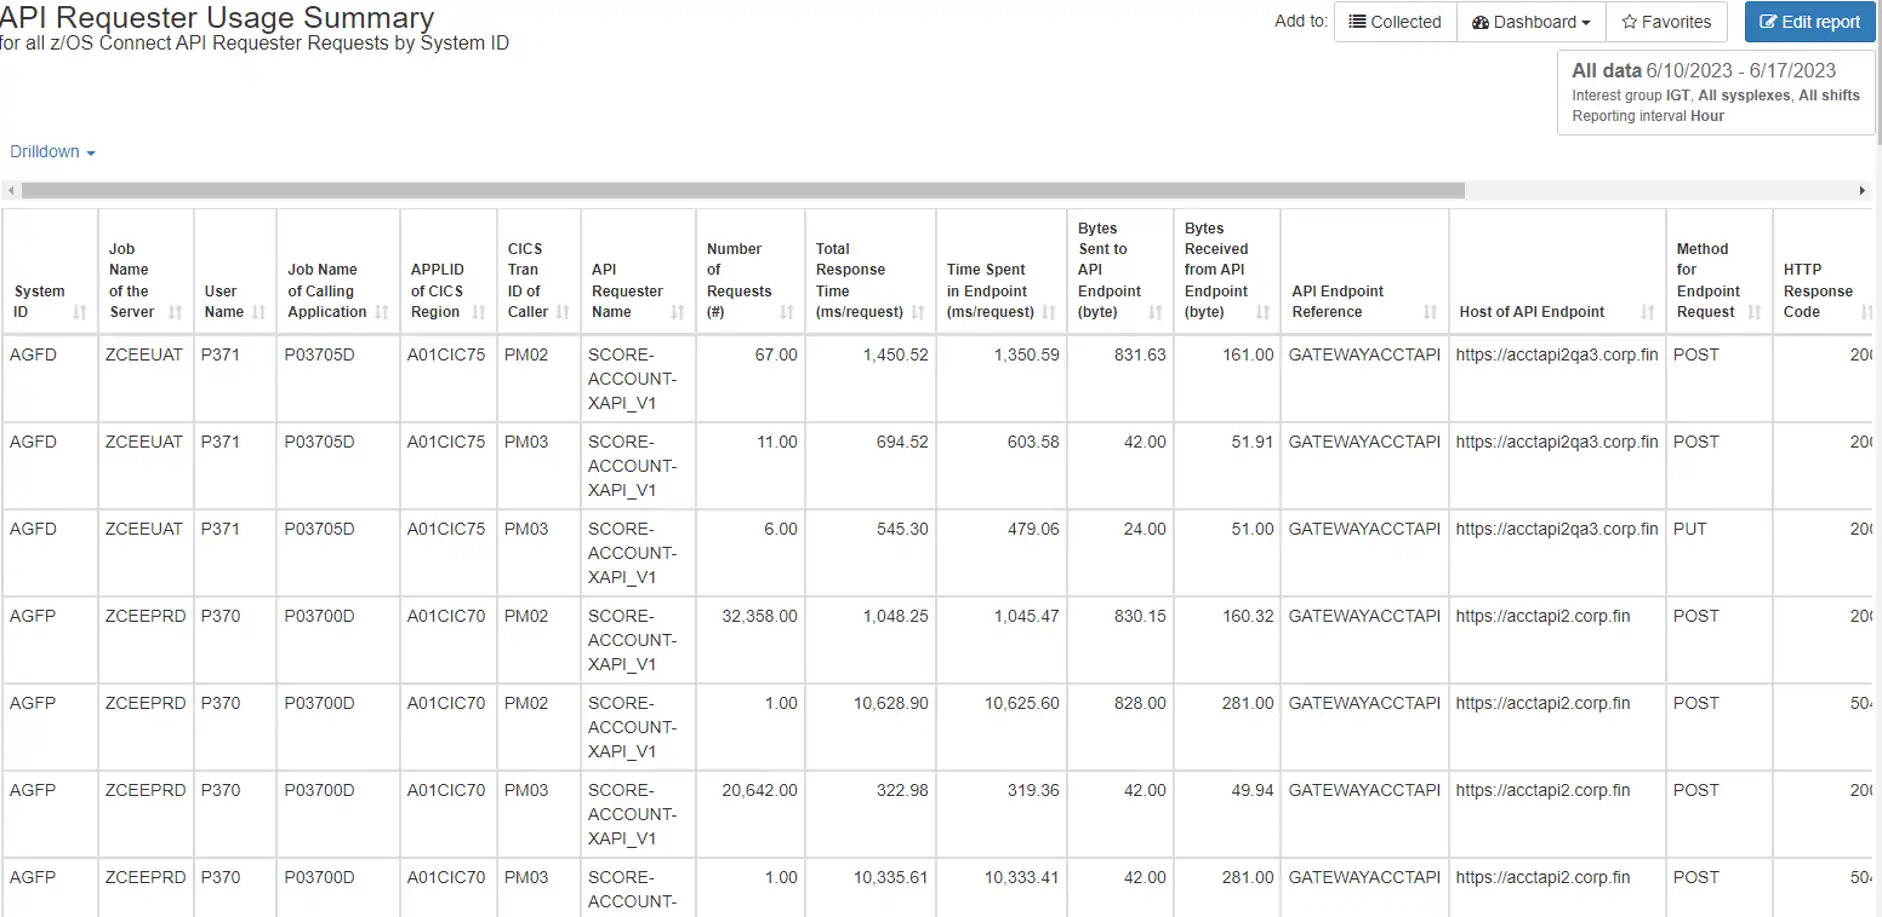
When analyzing the API calls being made off-platform by your mainframe applications, you need to know who made the calls, the endpoint, payload information, and of course call volumes and response times.
With IBM Z IntelliMagic Vision for z/OS, all of this data is available, and more, and can be presented in either tabular or chart formats to fit your needs.
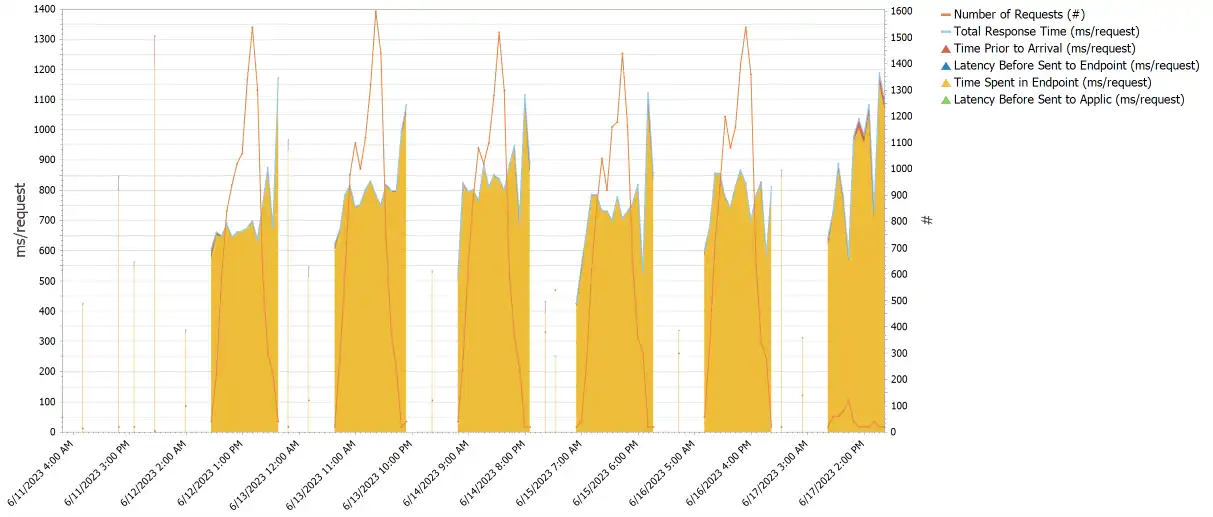
Dynamic Report Customization
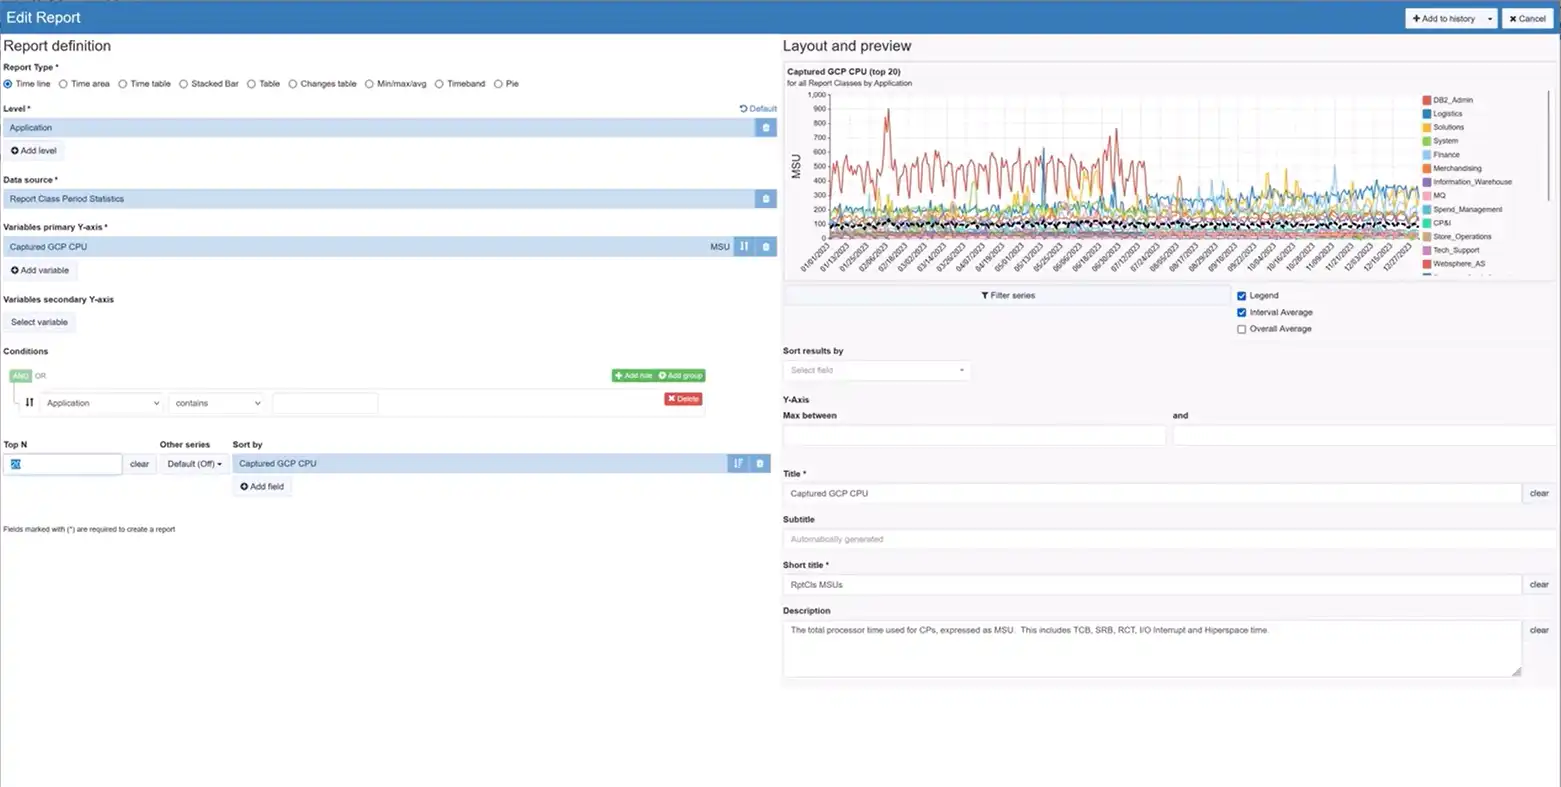
Advanced report customization capabilities facilitate quick ad hoc analysis without requiring programming or complicated steps and enable data to be viewed in the manner best suited to the current inquiry.
In this example, transaction rate is added to a response time chart to evaluate possible correlation. Numerous intuitive customization options including report type, summarization level, filtering, and interval comparisons.
Customized Shared Dashboards
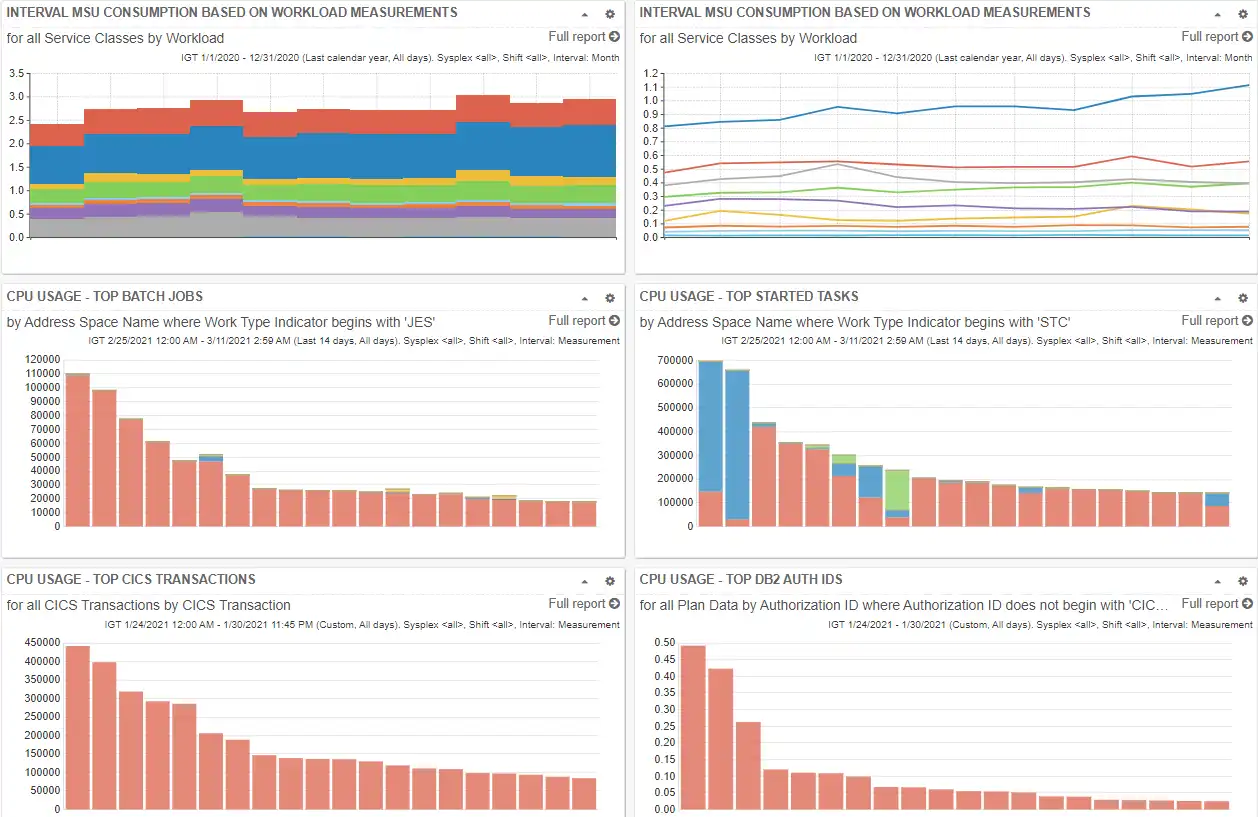
Customizable dashboards collect and display at a glance live views of any collection of metrics of interest to you. When shared, they promote collaboration and provide a common truth for an entire organization.
Users can expand any report and leverage drill down capabilities to pursue further analysis of metrics they find of interest.
AIOps via SaaS Delivery

Advantages to adopting a cloud model include rapid implementation (no lead time to install and setup the product locally), minimal setup (only for transmitting SMF data), offloading staff resources required to deal with SMF processing issues or to install product maintenance, and easy access to IntelliMagic consulting services to supplement local skills.
Business-Level Reporting
Business and technical management alike need to see their workloads in terms that are meaningful to them, and a picture is worth a thousand words.
IBM Z IntelliMagic Vision for z/OS makes it easy to share any of our 30,000+ pre-built reports, or pre-built and custom dashboards, charts, and reports. For z/OS Connect, sharing request rates and response times for different API calls over time helps facilitate communication and planning between Business and IT.
Response Time vs Transaction Rate
Viewing the overall transaction rate and response times in the same view lets you quickly narrow the problem space in case of issues, or profile your workloads for trending analysis.
You also see the response time breakdown into components such as Time Spent in System of Record (SOR). As with all the other data presented in IBM Z IntelliMagic Vision for z/OS, this could be as granular as you want, all the way down to the individual API level, as well as profiled over days/weeks/months.
API Call to Service Mapping
Many API calls invoke a single service, but that is not always the case. Drilling down from a specific API to the services invoked will provide a clear picture of these relationships and allow you to investigate changes or problems at the service or SOR level.
Call volumes and response times are available at any level within IBM Z IntelliMagic Vision for z/OS, and filtering to a specific API, service, or server will help you quickly narrow down the problem space in the event of issues.
API Provider and API Requester Data
APIs may be used to provide access to mainframe resources (Provider), or to allow mainframe applications to request data from off-platform (Requester).
IBM Z IntelliMagic Vision for z/OS makes analysis and reporting for both types of calls easy and intuitive. Where differences exist between the call types, such as the response time components reported, you have access to all the key metrics provided for that type of call.
System of Record Detail
A full understanding of your API Provider applications requires a knowledge of the back-end systems invoked.
With IBM Z IntelliMagic Vision for z/OS you can easily map services to the System of Record (SOR) Identifier and System of Record Resource to identify, for example, the CICS region and transaction invoked by a particular service.
API Requester Detail
When analyzing the API calls being made off-platform by your mainframe applications, you need to know who made the calls, the endpoint, payload information, and of course call volumes and response times.
With IBM Z IntelliMagic Vision for z/OS, all of this data is available, and more, and can be presented in either tabular or chart formats to fit your needs.
Dynamic Report Customization
Advanced report customization capabilities facilitate quick ad hoc analysis without requiring programming or complicated steps and enable data to be viewed in the manner best suited to the current inquiry.
In this example, transaction rate is added to a response time chart to evaluate possible correlation. Numerous intuitive customization options including report type, summarization level, filtering, and interval comparisons.
Customized Shared Dashboards
Customizable dashboards collect and display at a glance live views of any collection of metrics of interest to you. When shared, they promote collaboration and provide a common truth for an entire organization.
Users can expand any report and leverage drill down capabilities to pursue further analysis of metrics they find of interest.
AIOps via SaaS Delivery
Advantages to adopting a cloud model include rapid implementation (no lead time to install and setup the product locally), minimal setup (only for transmitting SMF data), offloading staff resources required to deal with SMF processing issues or to install product maintenance, and easy access to IntelliMagic consulting services to supplement local skills.
See Why IntelliMagic is Trusted by Some of the World’s Largest Mainframe Sites
Frequently Asked Questions
Can I track my API calls over time?
Yes, you can report and trend call rates over time by API, system, server, service, SOR, or any of the other key metrics available, or by any combination or filtering of those. The same is true for response times, response time components, or payloads.
Can we see which back-end system of record is being invoked for an API call?
Yes, the Service Provider Name, System of Record Identifier, and System of Record Resource fields allow you to identify the back-end SOR and transaction ID, as applicable.
Do you report on individual API requests?
No, our reporting is for intervals that match your other SMF data, such as 15-minute intervals. We roll up the API requests per interval.
Can you distinguish which API’s are served by a particular z/OS system or z/OS Connect server?
Yes. All reported metrics can be summarized or filtered by z/OS system, z/OS Connect server name, service provider, calling application or many other views. This can be very powerful for ensuring balanced systems or for investigating problems.
Do you report CPU time for each API call?
No, the SMF 123 record does not record CPU time. However, you can correlate to WLM Report Classes, address-space level CPU data for the z/OS Connect server, and to subsystem data for the back-end SOR if you have those modules.
Can you tell how much time is spent in the back-end system of record for an API call?
Yes, we provide a breakdown of response time components that includes time spent in SOR, as well as time spent in the z/OS Connect server.
What version of the SMF 123 record do you support?
We support version 2 of both SMF 123 subtypes (subtypes 1 and 2). Version 1 had limited data and has been effectively deprecated.
Can I see the complete end-to-end response times from the cloud application to the mainframe and back?
For API Requester calls that originate from mainframe applications, you can see the end-to-end response time including the HTTP call to the external API Provider and return. For API Provider calls in which the mainframe provides the service and the system of record, you only see the times on the mainframe, not the network times.
Book a Demo or Connect With an Expert
Discuss your technical or sales-related questions with our mainframe experts today
End-to-End Infrastructure Analytics for z/OS Performance Management
zSystems Performance Management
Optimize z/OS Mainframe Systems Management with Availability Intelligence
Benefits
Optimize z/OS Systems performance management using AI-driven analytics to proactively monitor and manage your z/OS environment, prevent disruptions, reduce costs, and preserve the reliability and availability that mainframes are known for.
Learn More
Db2 Performance Management
Prevent Availability Risks and Optimize Db2 Performance
Benefits
The volume and complexity of Db2 Statistics data and Db2 Accounting data creates a major challenge for analysts who want to derive value from the rich metrics available.
Easy visibility into key Db2 metrics through SMF records is crucial to proactively prevent availability risks and to effectively manage and optimize performance.
Learn More
Easy visibility into key Db2 metrics through SMF records is crucial to proactively prevent availability risks and to effectively manage and optimize performance.
CICS Performance Management
Monitor and Profile CICS Transactions and Regions with IBM Z IntelliMagic Vision for z/OS
Benefits
CICS SMF Transaction data is a rich source of performance insights, but its volume can make analysis challenging using traditional approaches that rely on static reports. Proactive assessment of key Statistics metrics across all regions is essential to identify potential risks to availability.
IBM Z IntelliMagic Vision for z/OS enables performance analysts to manage and optimize their z/OS CICS transactions more effectively and efficiently, as well as proactively assess the health of their CICS regions.
Learn More
IBM Z IntelliMagic Vision for z/OS enables performance analysts to manage and optimize their z/OS CICS transactions more effectively and efficiently, as well as proactively assess the health of their CICS regions.
Virtual Tape Performance Management
Proactively Manage Virtual and Physical Tape Environments
Benefits
With tape virtualization, tape storage became easier and more economical, but at the same time, more difficult to understand which changes or hardware upgrades are the best choices. With tape libraries being shared across multiple z/OS images, the full picture can only be obtained by aggregating workload and tape hardware information from all z/OS LPARs.
IBM Z IntelliMagic Vision for z/OS enables performance analysts to manage and optimize their z/OS Virtual Tape environments more effectively and efficiently.
Learn More
IBM Z IntelliMagic Vision for z/OS enables performance analysts to manage and optimize their z/OS Virtual Tape environments more effectively and efficiently.
Disk & Replication Performance Management
Automatically Detect Disk Performance Risks & Quickly Resolve Issues
Benefits
As Disk speeds and throughputs have increased, z/OS applications have come to rely on fast and consistent storage performance. To respond quickly to unexpected disk and replication issues, it is essential that you have insight into the health of the various components in your storage environment.
IBM Z IntelliMagic Vision for z/OS enables performance analysts to manage and optimize their z/OS Disk and Replication environment more effectively and efficiently.
Learn More
IBM Z IntelliMagic Vision for z/OS enables performance analysts to manage and optimize their z/OS Disk and Replication environment more effectively and efficiently.
MQ Performance Management
Optimize and Analyze MQ Activity and Performance
Benefits
MQ is widely used across z/OS environments, but sites often find it challenging to derive the valuable performance insights potentially available from MQ SMF Statistics and Accounting data due to limitations in existing reporting and available tooling.
IBM Z IntelliMagic Vision for z/OS enables performance analysts to manage and optimize their z/OS MQ configurations and activity more effectively and efficiently, as well as proactively assess the health of their queue managers.
Learn More
IBM Z IntelliMagic Vision for z/OS enables performance analysts to manage and optimize their z/OS MQ configurations and activity more effectively and efficiently, as well as proactively assess the health of their queue managers.
z/OS Network Performance Management
Automatically Monitor Mainframe Network Security and Protect Your Data
Benefits
TCP/IP is the core of the communication for the z/OS mainframe, both for traffic into and out of the mainframe and internal communication among z/OS images and processor complexes. Proper management is necessary to secure and protect system availability.
IBM Z IntelliMagic Vision for z/OS automatically generates GUI-based, interactive, IBM best-practice compliant rated reports that proactively identify areas that indicate potential upcoming risk to TCP/IP health, performance, and security.
Learn More
IBM Z IntelliMagic Vision for z/OS automatically generates GUI-based, interactive, IBM best-practice compliant rated reports that proactively identify areas that indicate potential upcoming risk to TCP/IP health, performance, and security.
z/OS Connect: Modern Mainframe API Environment
Optimizing Mainframe API Monitoring for Improved Resource Management
Benefits
IBM Z IntelliMagic Vision for z/OS enhances mainframe API monitoring and profiling, providing crucial visibility to address issues at the API or service level, ultimately aiding performance analysts in better resource planning and management reporting.
Learn More
Flexible Deployment and Monitoring

In the Cloud
Cloud based deployment can be accessed from everywhere in the world and is easy to share with colleagues

Services & Support
Take advantage of IntelliMagic's experienced performance experts for standalone custom services or daily monitoring

On Premise
Install the software on premise and use it offline for total control of your installation
Unlock Critical Insights from z/OS Connect for Your Cloud-App Workloads
IBM’s z/OS Connect provides a simple, intuitive way to bring the power of APIs to the mainframe for cloud, mobile, and web applications.
Mainframe sites that use IBM’s z/OS Connect rely on it to connect z/OS applications and data with hybrid cloud applications using RESTful APIs. The cloud app workloads are often mission critical. Without a way to unlock the data, teams managing z/OS Connect miss out on crucial insights into:
- API Rates and Response Times
- Significant Drivers of Demand
- Service Levels
- Services Invoked by the APIs
- Back-end Systems Called by the APIs/Services
- Server Performance and Configuration
IBM Z IntelliMagic Vision for z/OS applies its built-in expert knowledge and artificial intelligence to automatically extract these insights and provide it in an intuitive and easy to use graphical interface. This eliminates the need for time-consuming manual coding efforts, and greatly enhances domain expertise and expedites learning about this new area of the z/OS infrastructure.
Continue Learning with These Resources
Connect With an Expert
Discuss your technical or sales-related questions with our mainframe experts today