Monitor WAS Performance & Availability with IBM Z IntelliMagic Vision for z/OS
IBM Z IntelliMagic Vision for z/OS enables performance analysts to manage and optimize their WebSphere Application Server environment more effectively and efficiently.
Prevent risks, save time, and optimally configure your environment.

Analyze and Optimize WAS Performance with Built-In Health Insights and AI

Proactively Analyze and Prevent Risks
Utilize built-in health insights and artificial intelligence to proactively identify risks, ensure availability, and optimize your WebSphere environment.
Save Time and Quickly Resolve Issues
Quickly spot and resolve issues using thousands of out-of-the-box reports, built-in live edit, compare, share, and drill down features.

Expedite Learning and Enhance Domain Expertise
Detailed built-in explanations, guided drilldown options, and end-to-end z/OS support facilitates easy system understanding and knowledge transfer.
Built-In Intelligence at Your Fingertips
Report at a Business Level
Business and Technical Management alike need to see their workloads in terms that are meaningful to them, and a picture is worth a thousand words.
Easily share charts and dashboards of CPU consumption and transaction rates of different WebSphere application workloads over time to facilitate communication and planning between Business and IT.
Transaction Rates by Cell
Understanding typical behavior for your applications helps you recognize when changes occur that could lead to problems if left unchecked. Therefore, it is very useful to profile your workloads over time.
This view shows the overall WebSphere transaction rate by Cell, over the course of a single day.
One Cell clearly dominates. Is that typical? You could easily change the timeframe to trend over multiple days/weeks/months to find out.
Transaction Rates by Cluster
Easily navigate from a big-picture understanding down to granular level details with built-in single click drilldown capabilities. This chart is another predefined report showing the same overall transaction rate as before, only now broken down by Cluster.
Similar pre-defined charts are available to view down to Node, Server, Servant, Transaction Class, Request Type or URI levels of granularity.
Response Time vs Transaction Rate
Viewing the overall transaction rate and response times in the same view lets you quickly narrow the problem space in case of issues, or profile your workloads for trending analysis.
You also see the response time breakdown into components such as Time to Dispatch delay in the yellow spikes. As with all the other data shown here, this could be as granular as you want, all the way down to the individual URI level, as well as profiled over days/weeks/months.
Response Time and Transaction Rate for a Specific URI
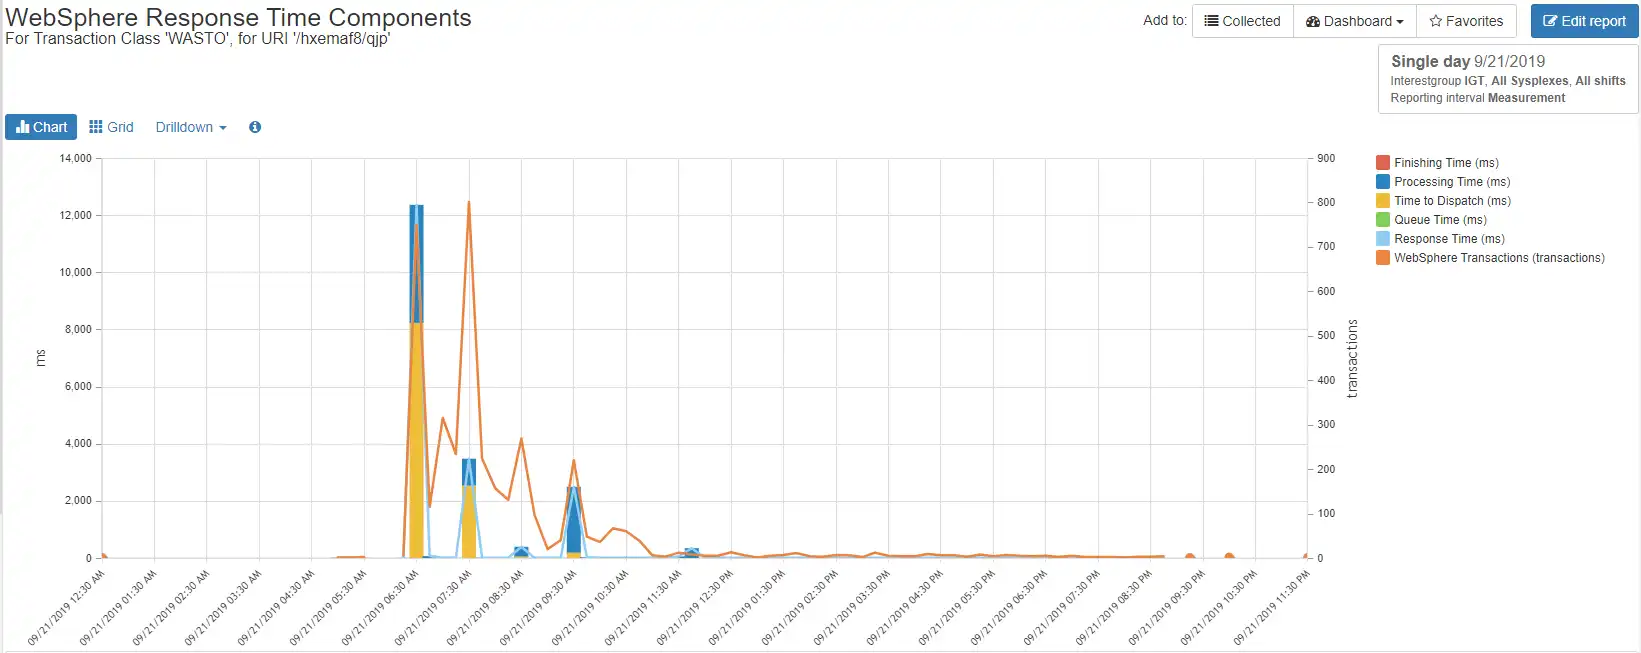
When problems with an application occur, you need data specific to that application to help troubleshoot the issue. In WebSphere, that means data at the URI level.
Here is the same chart for a specific URI experiencing most of the Time to Dispatch delay. This is the result of several “clicks” to drill down from the overall WebSphere environment data, highlighting the power of starting at a high level and diving deeper to understand an issue.
CPU and zIIP Usage
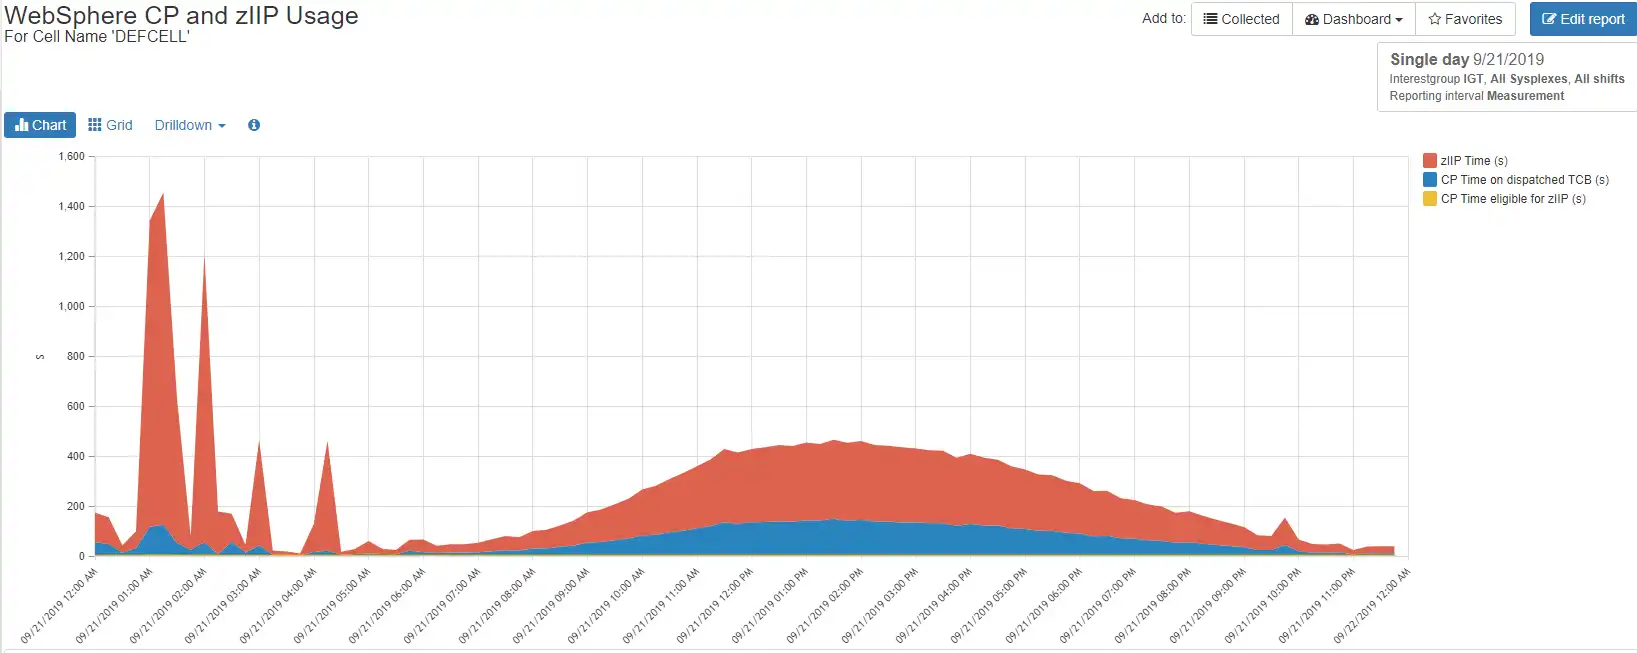
Viewing the general-purpose CPU time and zIIP time for a specific Cell provides valuable insights for resource optimization efforts and problem analysis, facilitating informed decision-making and enhancing system performance.
You also see any time spent on a CP that was zIIP eligible. Again, this can be shown at all the levels of granularity mentioned above, across any timeframe you have data stored.
Comparison by Date
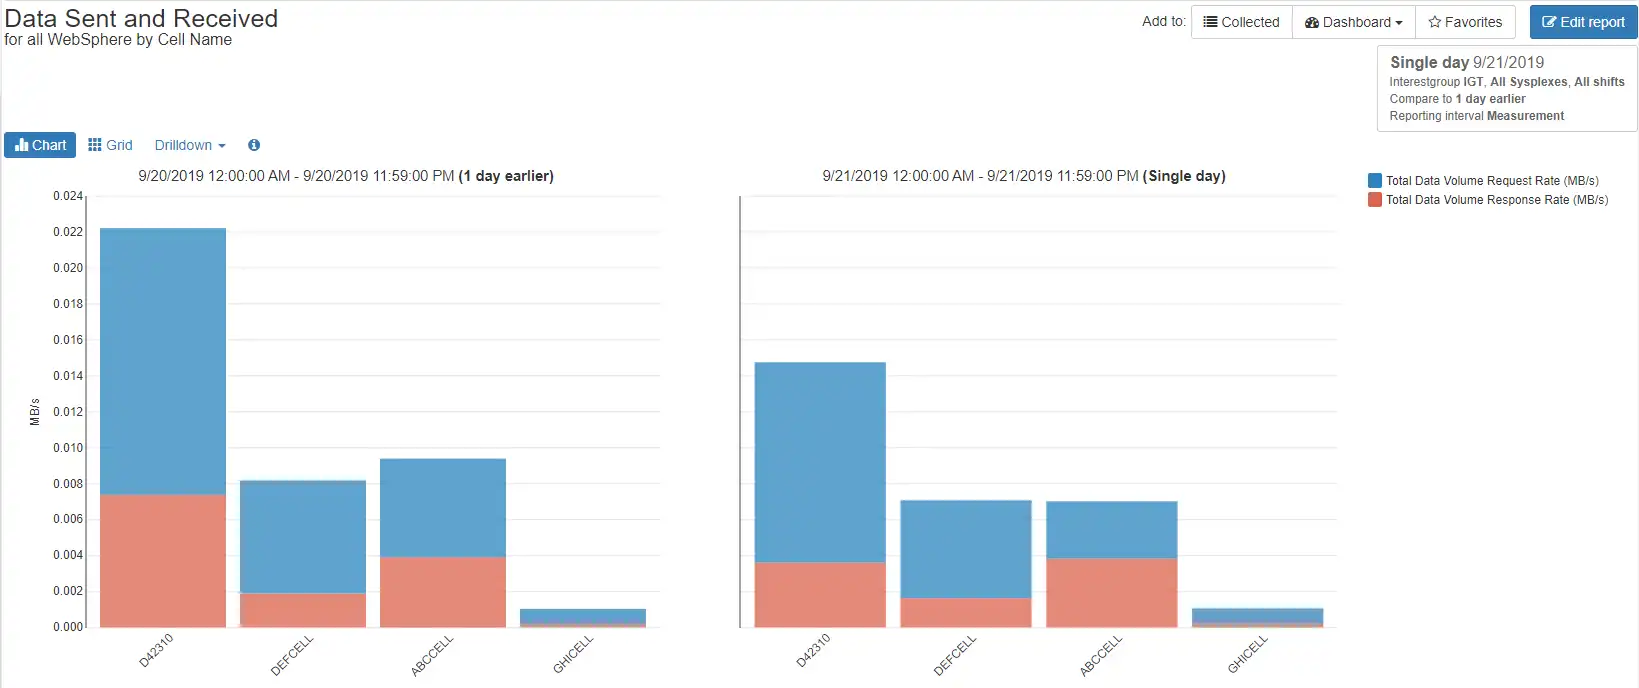
Easily understand the impact of planned and unplanned changes with a built-in, intuitive compare function.
In this example, we show MBs of data sent/received for each Cell, comparing one day to another. If you made an application change and expected less data transmission for the D4 cell, you can now verify and quantify the benefit. If you did not expect a change, you have something you need to investigate.
Transaction Overview
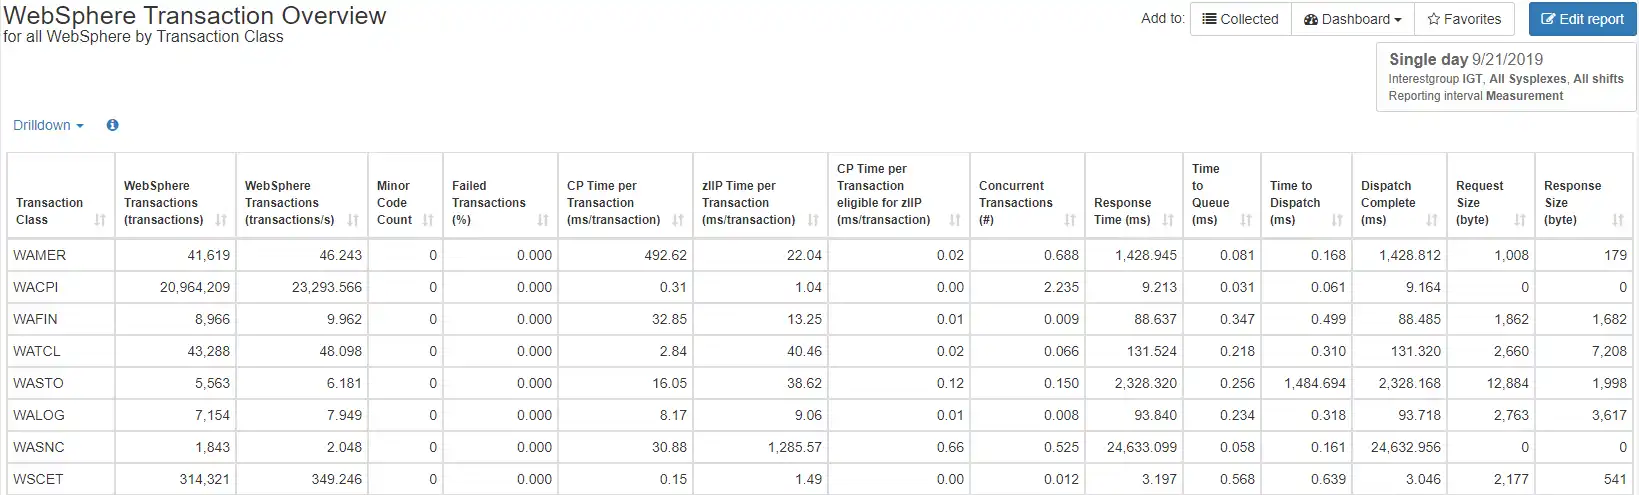
Easily switch from chart views to tabular views to suit your preferences and digest data in ways more relevant to your immediate task at hand.
This is a predefined report with key transaction metrics by Transaction Class. As with any other report, you can customize this to suit your needs. Here we see the key metrics of CPU time, transaction rates and response times, along with more detail such as number of failed transactions, CPU/transaction and data sent/received.
AIOps via SaaS Delivery

Advantages to adopting a cloud model include rapid implementation (no lead time to install and setup the product locally), minimal setup (only for transmitting SMF data), offloading staff resources required to deal with SMF processing issues or to install product maintenance, and easy access to IntelliMagic consulting services to supplement local skills.
Report at a Business Level
Business and Technical Management alike need to see their workloads in terms that are meaningful to them, and a picture is worth a thousand words.
Easily share charts and dashboards of CPU consumption and transaction rates of different WebSphere application workloads over time to facilitate communication and planning between Business and IT.
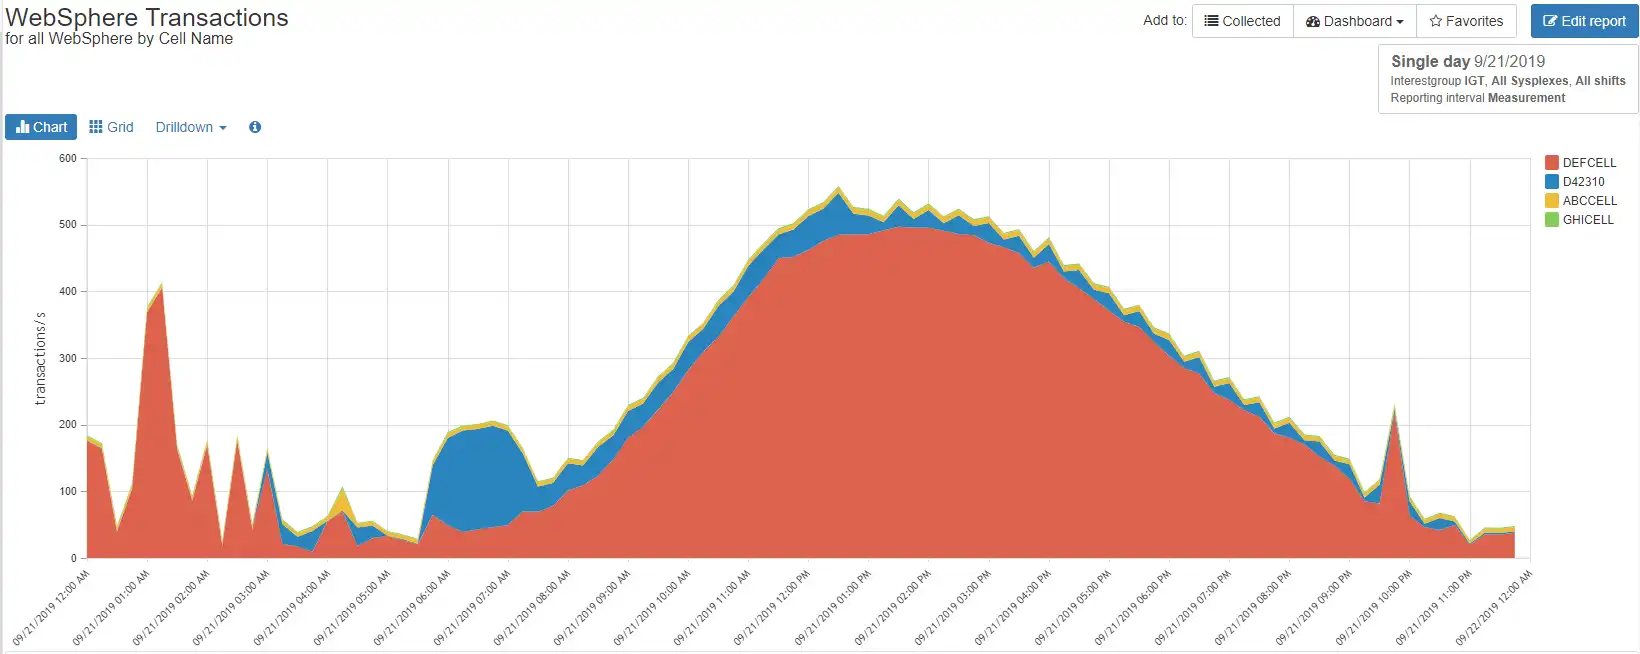
Transaction Rates by Cell
Understanding typical behavior for your applications helps you recognize when changes occur that could lead to problems if left unchecked. Therefore, it is very useful to profile your workloads over time.
This view shows the overall WebSphere transaction rate by Cell, over the course of a single day.
One Cell clearly dominates. Is that typical? You could easily change the timeframe to trend over multiple days/weeks/months to find out.
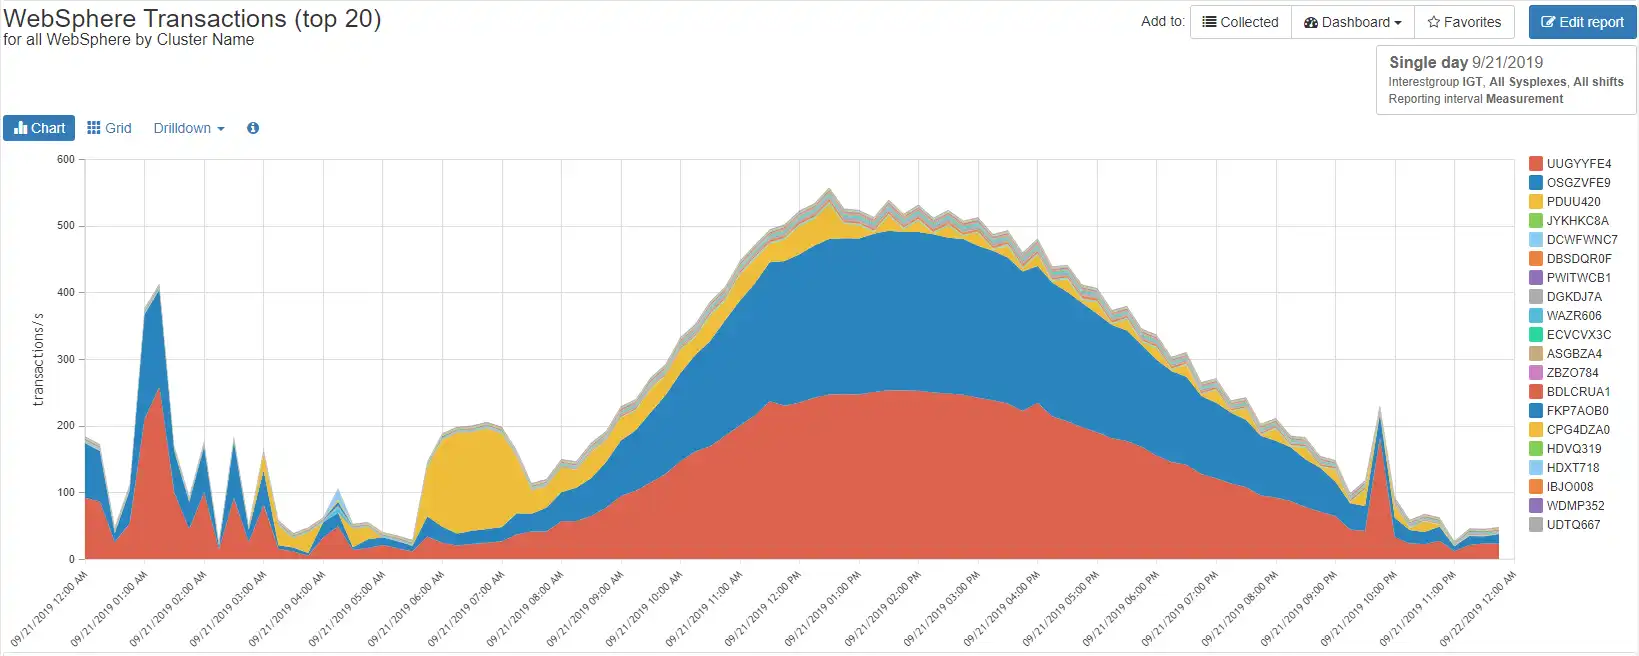
Transaction Rates by Cluster
Easily navigate from a big-picture understanding down to granular level details with built-in single click drilldown capabilities. This chart is another predefined report showing the same overall transaction rate as before, only now broken down by Cluster.
Similar pre-defined charts are available to view down to Node, Server, Servant, Transaction Class, Request Type or URI levels of granularity.
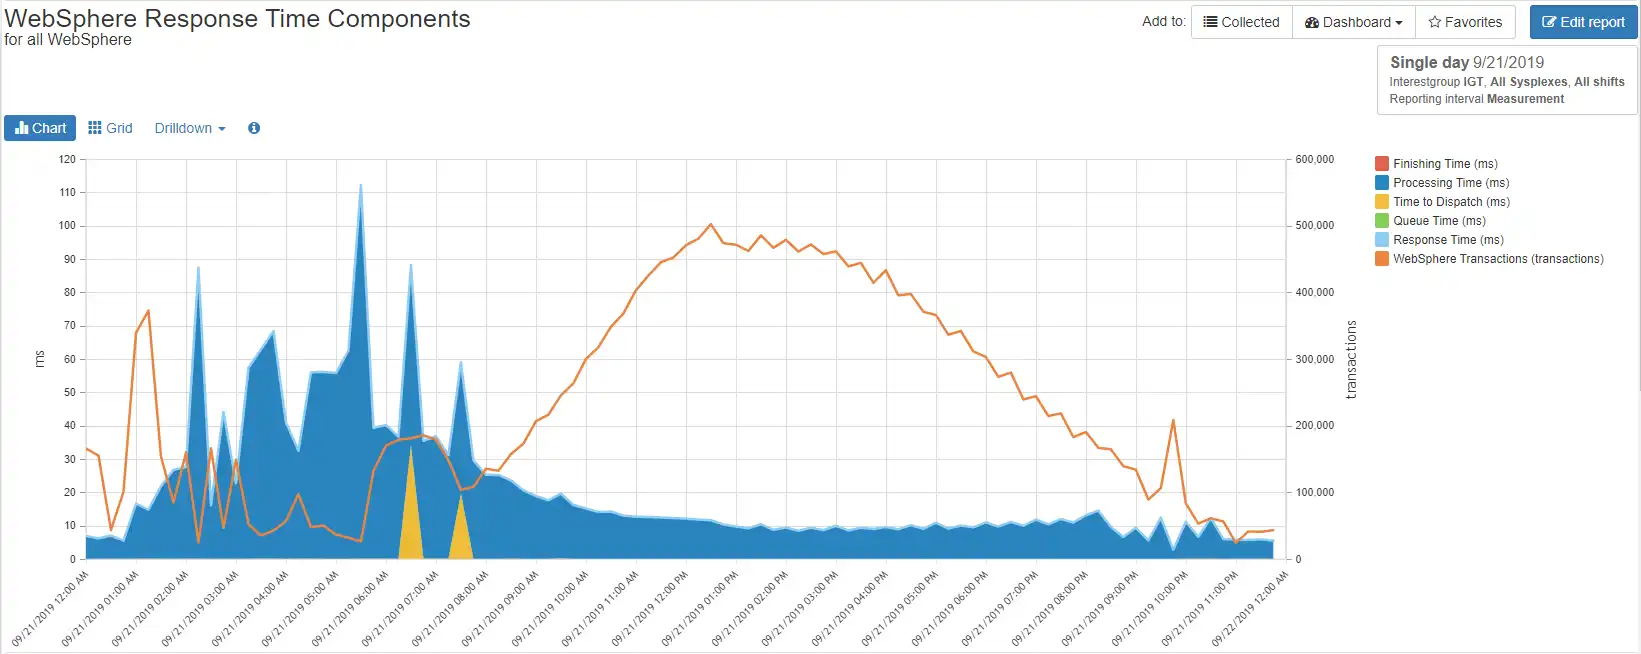
Response Time vs Transaction Rate
Viewing the overall transaction rate and response times in the same view lets you quickly narrow the problem space in case of issues, or profile your workloads for trending analysis.
You also see the response time breakdown into components such as Time to Dispatch delay in the yellow spikes. As with all the other data shown here, this could be as granular as you want, all the way down to the individual URI level, as well as profiled over days/weeks/months.
Response Time and Transaction Rate for a Specific URI
When problems with an application occur, you need data specific to that application to help troubleshoot the issue. In WebSphere, that means data at the URI level.
Here is the same chart for a specific URI experiencing most of the Time to Dispatch delay. This is the result of several “clicks” to drill down from the overall WebSphere environment data, highlighting the power of starting at a high level and diving deeper to understand an issue.
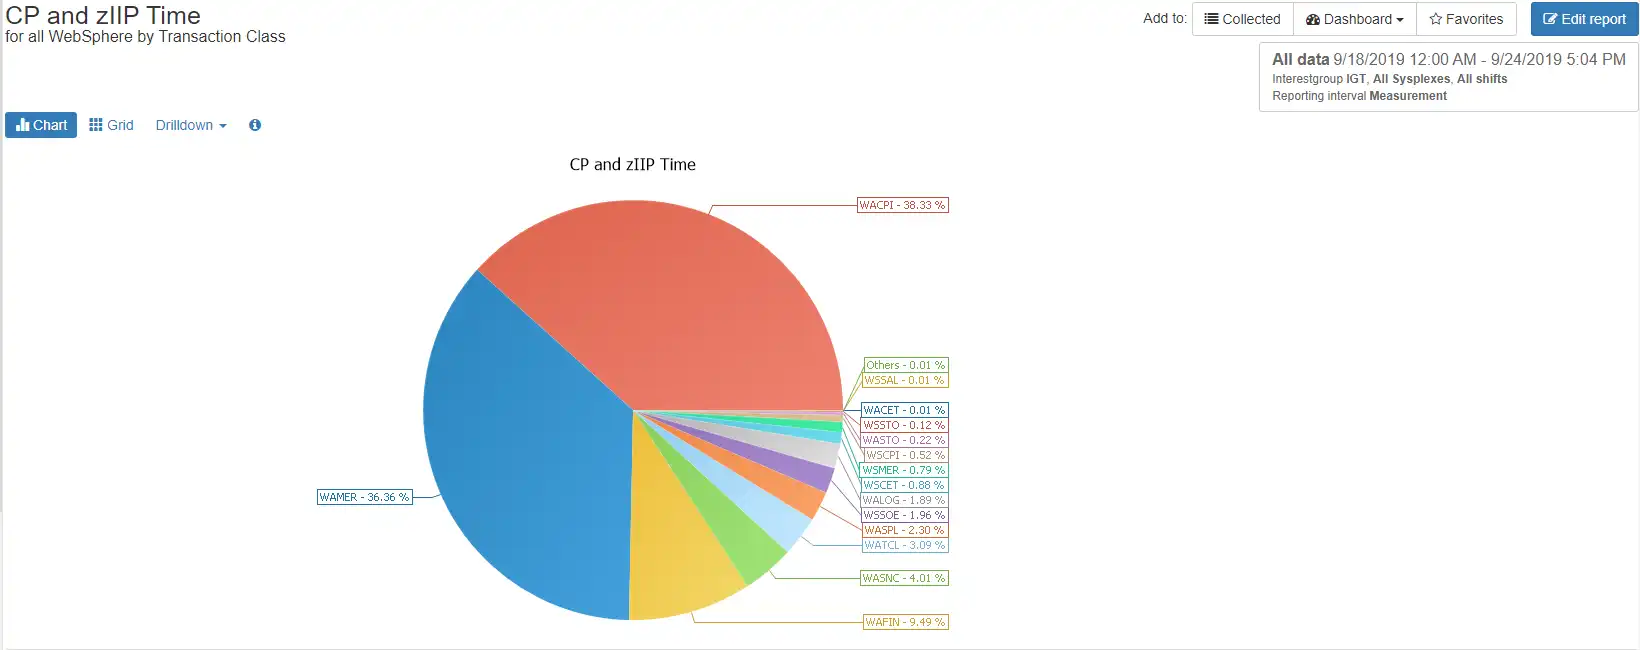
CPU and zIIP Usage
Viewing the general-purpose CPU time and zIIP time for a specific Cell provides valuable insights for resource optimization efforts and problem analysis, facilitating informed decision-making and enhancing system performance.
You also see any time spent on a CP that was zIIP eligible. Again, this can be shown at all the levels of granularity mentioned above, across any timeframe you have data stored.
Comparison by Date
Easily understand the impact of planned and unplanned changes with a built-in, intuitive compare function.
In this example, we show MBs of data sent/received for each Cell, comparing one day to another. If you made an application change and expected less data transmission for the D4 cell, you can now verify and quantify the benefit. If you did not expect a change, you have something you need to investigate.
Transaction Overview
Easily switch from chart views to tabular views to suit your preferences and digest data in ways more relevant to your immediate task at hand.
This is a predefined report with key transaction metrics by Transaction Class. As with any other report, you can customize this to suit your needs. Here we see the key metrics of CPU time, transaction rates and response times, along with more detail such as number of failed transactions, CPU/transaction and data sent/received.
AIOps via SaaS Delivery
Advantages to adopting a cloud model include rapid implementation (no lead time to install and setup the product locally), minimal setup (only for transmitting SMF data), offloading staff resources required to deal with SMF processing issues or to install product maintenance, and easy access to IntelliMagic consulting services to supplement local skills.
End-to-End Infrastructure Analytics for z/OS Performance Management
zSystems Performance Management
Optimize z/OS Mainframe Systems Management with Availability Intelligence
Benefits
Optimize z/OS Systems performance management using AI-driven analytics to proactively monitor and manage your z/OS environment, prevent disruptions, reduce costs, and preserve the reliability and availability that mainframes are known for.
Explore z/OS Systems Performance Analytics
Db2 Performance Management
Prevent Availability Risks and Optimize Db2 Performance
Benefits
The volume and complexity of Db2 Statistics data and Db2 Accounting data creates a major challenge for analysts who want to derive value from the rich metrics available.
Easy visibility into key Db2 metrics through SMF records is crucial to proactively prevent availability risks and to effectively manage and optimize performance.
Explore Db2 Performance Analytics
Easy visibility into key Db2 metrics through SMF records is crucial to proactively prevent availability risks and to effectively manage and optimize performance.
CICS Performance Management
Monitor and Profile CICS Transactions and Regions with IBM Z IntelliMagic Vision for z/OS
Benefits
CICS SMF Transaction data is a rich source of performance insights, but its volume can make analysis challenging using traditional approaches that rely on static reports. Proactive assessment of key Statistics metrics across all regions is essential to identify potential risks to availability.
IBM Z IntelliMagic Vision for z/OS enables performance analysts to manage and optimize their z/OS CICS transactions more effectively and efficiently, as well as proactively assess the health of their CICS regions.
Explore CICS Performance Analytics
IBM Z IntelliMagic Vision for z/OS enables performance analysts to manage and optimize their z/OS CICS transactions more effectively and efficiently, as well as proactively assess the health of their CICS regions.
Virtual Tape Performance Management
Proactively Manage Virtual and Physical Tape Environments
Benefits
With tape virtualization, tape storage became easier and more economical, but at the same time, more difficult to understand which changes or hardware upgrades are the best choices. With tape libraries being shared across multiple z/OS images, the full picture can only be obtained by aggregating workload and tape hardware information from all z/OS LPARs.
IBM Z IntelliMagic Vision for z/OS enables performance analysts to manage and optimize their z/OS Virtual Tape environments more effectively and efficiently.
Explore Tape Performance Analytics
IBM Z IntelliMagic Vision for z/OS enables performance analysts to manage and optimize their z/OS Virtual Tape environments more effectively and efficiently.
Disk & Replication Performance Management
Automatically Detect Disk Performance Risks & Quickly Resolve Issues
Benefits
As Disk speeds and throughputs have increased, z/OS applications have come to rely on fast and consistent storage performance. To respond quickly to unexpected disk and replication issues, it is essential that you have insight into the health of the various components in your storage environment.
IBM Z IntelliMagic Vision for z/OS enables performance analysts to manage and optimize their z/OS Disk and Replication environment more effectively and efficiently.
Explore Disk Performance Analytics
IBM Z IntelliMagic Vision for z/OS enables performance analysts to manage and optimize their z/OS Disk and Replication environment more effectively and efficiently.
MQ Performance Management
Optimize and Analyze MQ Activity and Performance
Benefits
MQ is widely used across z/OS environments, but sites often find it challenging to derive the valuable performance insights potentially available from MQ SMF Statistics and Accounting data due to limitations in existing reporting and available tooling.
IBM Z IntelliMagic Vision for z/OS enables performance analysts to manage and optimize their z/OS MQ configurations and activity more effectively and efficiently, as well as proactively assess the health of their queue managers.
Explore MQ Performance Analytics
IBM Z IntelliMagic Vision for z/OS enables performance analysts to manage and optimize their z/OS MQ configurations and activity more effectively and efficiently, as well as proactively assess the health of their queue managers.
z/OS Network Performance Management
Automatically Monitor Mainframe Network Security and Protect Your Data
Benefits
TCP/IP is the core of the communication for the z/OS mainframe, both for traffic into and out of the mainframe and internal communication among z/OS images and processor complexes. Proper management is necessary to secure and protect system availability.
IBM Z IntelliMagic Vision for z/OS automatically generates GUI-based, interactive, IBM best-practice compliant rated reports that proactively identify areas that indicate potential upcoming risk to TCP/IP health, performance, and security.
Explore z/OS Network Performance Analytics
IBM Z IntelliMagic Vision for z/OS automatically generates GUI-based, interactive, IBM best-practice compliant rated reports that proactively identify areas that indicate potential upcoming risk to TCP/IP health, performance, and security.
z/OS Connect: Modern Mainframe API Environment
Optimizing Mainframe API Monitoring for Improved Resource Management
Benefits
IBM Z IntelliMagic Vision for z/OS enhances mainframe API monitoring and profiling, providing crucial visibility to address issues at the API or service level, ultimately aiding performance analysts in better resource planning and management reporting.
Explore z/OS Connect Analytics
See Why IntelliMagic is Trusted by Some of the World’s Largest Mainframe Sites
Frequently Asked Questions
What is the source of the data you report?
The WebSphere module data comes from the SMF 120, subtype 9 record. In addition, data is available at the address space level, service class and report class, dataset level, etc. depending on the modules you are licensed for. JVM data such as garbage collection, method trace, etc. is not available in the SMF 120-9 and is not reported.
Can I split out my reporting by system, and by server?
Yes, all available metrics can be reported by system, by cluster, by server, by transaction, and more.
Can I see the CPU and zIIP time for my WebSphere transactions?
Yes, you can see general-purpose CPU and zIIP times at the transaction level, along with any CPU time that was zIIP eligible. This can all be reported at various levels of granularity: system, cell, cluster, server, transaction class, request type, and URI.
Do you support Liberty z/OS reporting?
Currently, the SMF 120 subtype 11 records for Liberty are not supported. This requirement is on our roadmap. Please reach out to IntelliMagic for more information if you need this data.
Can I report request payload data?
Yes, the size of the request and the size of the response payload are available at the same level of granularity as all other metrics.
Do you report on individual WebSphere transactions?
IBM Z IntelliMagic Vision for z/OS summarizes (rolls up) individual transactions to match your RMF/SMF intervals (e.g. 10 minutes). IntelliMagic has another offering if you need to see greater granularity than interval data. Please reach out to IntelliMagic if you would like more information.
Is any personally identifiable information (PII) visible?
No, the request/response payloads themselves are not contained in SMF data, so no PII data is exposed.
Can I see transaction response times, and response time components?
Yes, response times can be reported at the same levels of granularity mentioned for CPU/zIIP reporting. In addition, the response time components available in the SMF 120-9 record are reported, including time on the WLM queue and dispatch time.
Do you have a change detection capability?
Yes, key metrics including transaction volume, CPU time, zIIP time, and response time are available for statistical change detection to call out significant increases or decreases by URI, cluster, or transaction class.
Book a Demo or Connect With an Expert
Discuss your technical or sales-related questions with our mainframe experts today
Solutions for your Problems
Elevate IT Team Impact
Empower new staff and experts. Replace antiquated reporting with automated, intelligent analytics.
Benefits
Artificial Intelligence using built-in expert knowledge and statistics assesses and rates key metrics as good versus bad from a performance or efficiency perspective for the analyst.
Force multiplier - Invite AI to the team to help both new and expert team members in a tight job market.
Cloud Delivery - Immediate access with no maintenance needed.
Force multiplier - Invite AI to the team to help both new and expert team members in a tight job market.
Cloud Delivery - Immediate access with no maintenance needed.
Optimize & Reduce Costs Safely
Save money without compromising service levels or availability.
Benefits
Reduce cost with superior visibility into drivers of cost such as inefficient CPU utilization, configuration and priority issues, imbalance of workloads across hardware resources, consolidation opportunities, etc.
Reduce hardware spend without negative impact on service levels.
Avoid the costs of service delivery problems without both human cost and application unavailability cost.
Reduce hardware spend without negative impact on service levels.
Avoid the costs of service delivery problems without both human cost and application unavailability cost.
Prevent Performance Problems
Predict and Prevent many IT issues without incurring typical false positive and false negative issues.
Benefits
Automatically quantify risks in the z/OS infrastructure for peak workloads or configuration issues prior to production impact being felt by application end-users. Go beyond KPI to KRI (Key Risk Indicators) root cause monitoring.
Continuous Health Assessment of application and infrastructure stress; assesses millions of metrics using context-specific expert knowledge and statistical techniques.
Continuous Health Assessment of application and infrastructure stress; assesses millions of metrics using context-specific expert knowledge and statistical techniques.
Resolve Issues Quickly
Accelerate Mean Time To Resolution for unpredictable problems with AI-augmented diagnosis.
Benefits
Rapidly identify where problems are occurring with infrastructure wide exception (anomaly) tables, intelligent navigation through the data from big picture to extremely granular levels, automated compare of time periods, and more.
See and understand what applications are affected, what part of the infrastructure, what time frames, and get clues as to probable cause.
See and understand what applications are affected, what part of the infrastructure, what time frames, and get clues as to probable cause.
Flexible Deployment and Monitoring

In the Cloud
Cloud based deployment can be accessed from everywhere in the world and is easy to share with colleagues

Services & Support
Take advantage of IntelliMagic's experienced performance experts for standalone custom services or daily monitoring

On Premise
Install the software on premise and use it offline for total control of your installation
Track Response Time and Resource Consumption of WebSphere Transactions
Technical specialists responsible for the health of WebSphere applications need performance-management level data to supplement deep-dive APM solutions and monitors. Understanding the overall environment and workload characteristics and the ability to drill down to narrow a problem space are extremely helpful.
IBM Z IntelliMagic Vision for z/OS supports the WebSphere Application Server for z/OS transaction logging records (SMF 120 subtype 9), enabling you to track transaction response time and resource consumption. These records provide detailed transaction-level metrics on where the work runs and the nature of the work, including processor consumption, transferred bytes, and response times.
This enables you to:
- Ensure service level expectations from the users are met
- Identify any significant dispatch or queue delays that may occur
- Track the CPU and zIIP consumption for the WebSphere environment as a whole and for individual clusters or URI’s
- Compare different time intervals to investigate trends or changes, e.g. to check whether an application change has a measurable impact
IBM Z IntelliMagic Vision for z/OS offers you the out-of-the-box visibility and intuitive navigation to manage every component of your z/OS infrastructure under a single solution, facilitating collaboration across teams that have historically been isolated by siloed tool sets.
Continue Learning with These Resources
Brochures and Datasheets
Connect With an Expert
Discuss your technical or sales-related questions with our mainframe experts today