Monitor SAN Fabric Performance with IntelliMagic Vision
Monitor and manage the performance of your Brocade and Cisco fabric in a single view with the rest of your multi-vendor SAN system.
Expose the inner workings of your SAN fibre to prevent incidents and automatically identify common SAN issues such as buffer credit issues, malformed packets, performance over subscription, single path analysis, and zoning configuration issues.

Maximize Brocade and Cisco SAN Fibre Performance Management
IntelliMagic Vision for SAN provides end-to-end visibility required to manage fabric performance. When applied to your VMware, Storage and Brocade and Cisco Fabric, you can expose the inner workings of your SAN fabric and prevent incidents.
You will be able to answer questions such as:
- What do the SAN fabric metrics mean?
- What are the key SAN fabric metrics and what thresholds should I set?
- Do I have any slow drain storage or host devices?
- Do I have any ISLs with buffer credit issues?
- Are there any hosts with only single fabric paths?
- Who are the heavy hitters in my SAN fabric?
- Is multi-pathing working correctly on my VMware ESX Hosts?
This enables you to safely get the most value out of your SAN infrastructure.
Built-In Intelligence at Your Fingertips
Proactive Health Insights
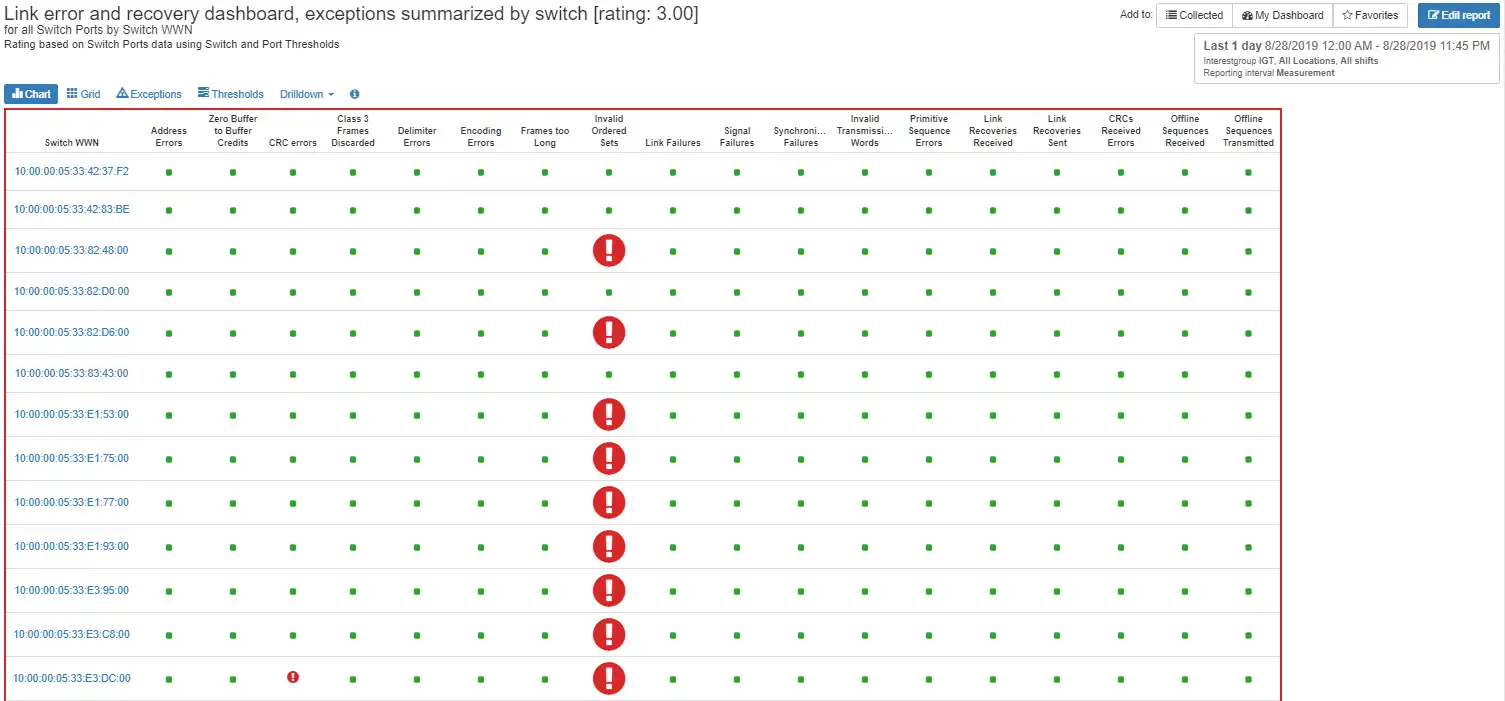
Visualize all storage switch exceptions in single pane of glass. Color coding of the KRIs provides an indication of the level of risk or problem severity for the infrastructure.
The AI-based analytics engine rates and correlates metrics to the specific hardware capabilities in order to minimize false positives.
End-to-End Topology
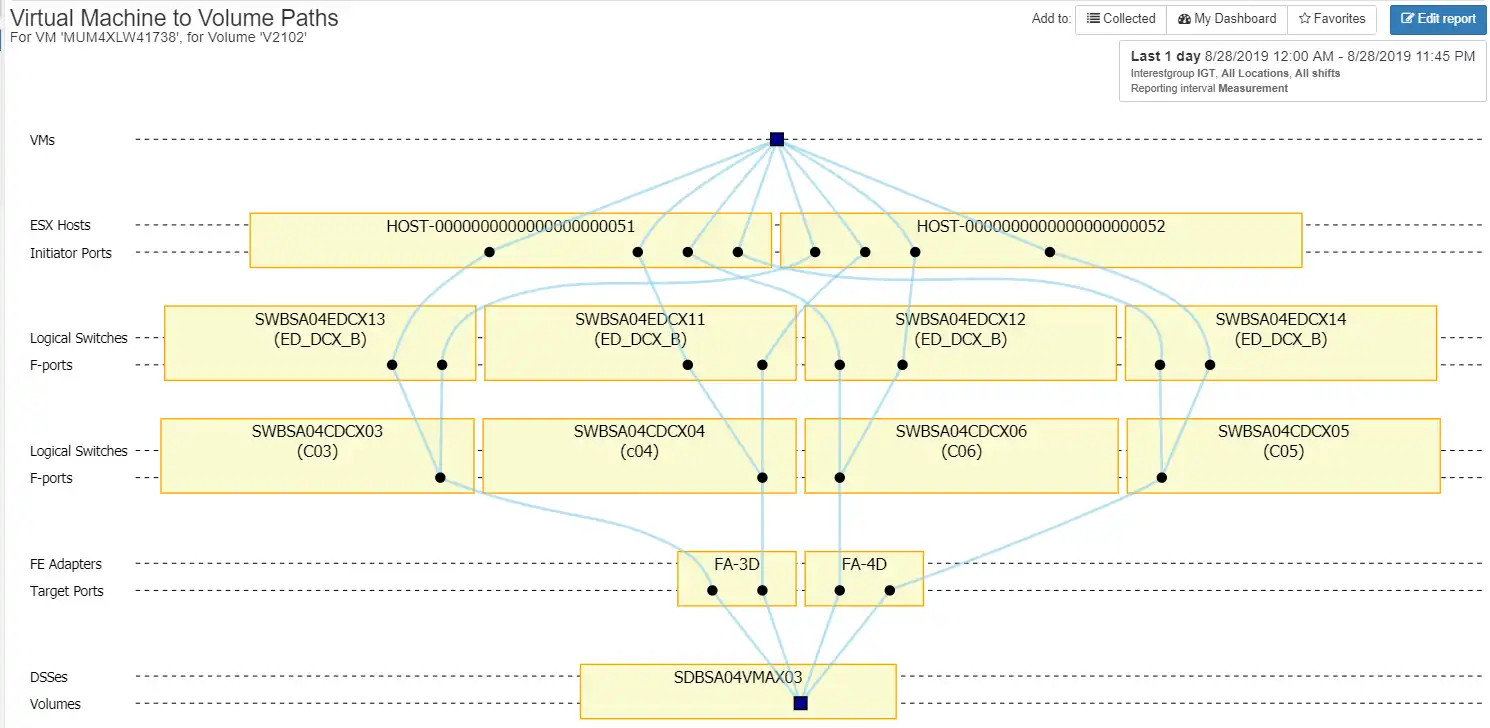
Interactive end-to-end topology represents fabric connectivity from the VMware guest all the way through to the back-end storage volume. At each point along the way, it is possible to drill down and diagnose root causes.
This interactive visualization allows you to identify single path issues as well as imbalances in the connectivity.
Rebalance Workloads for Maximum Performance
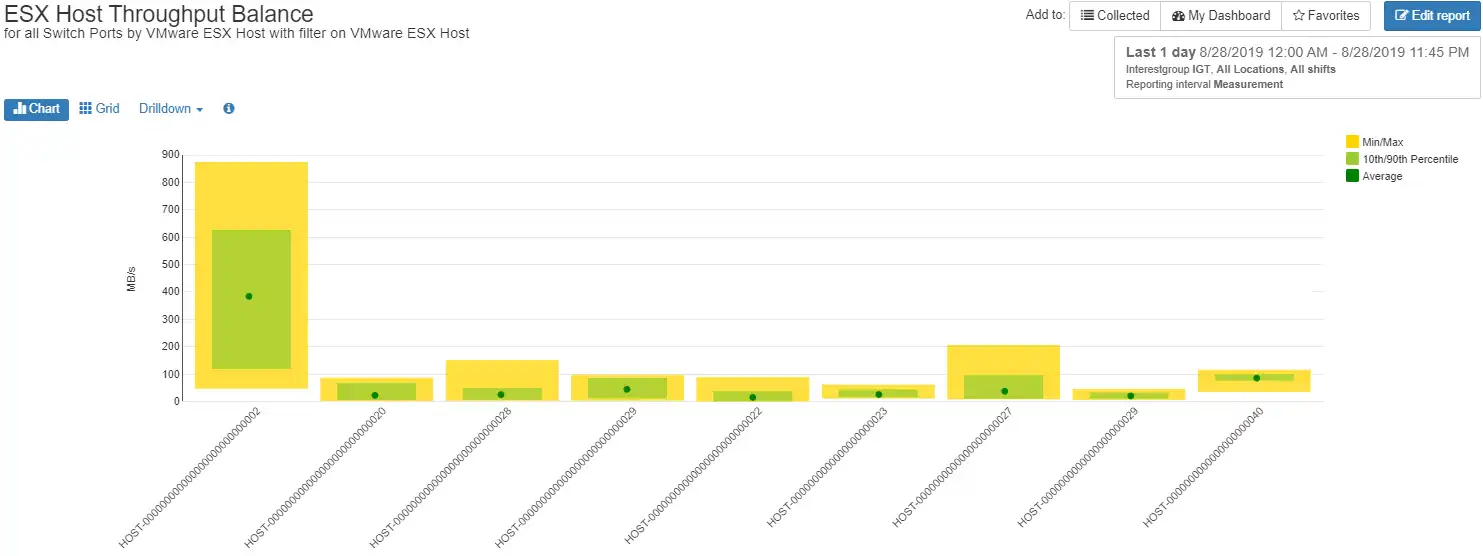
See at a glance where resources need to be reallocated to achieve maximum performance and the most efficient utilization of hardware resources.
Validate that host multi-pathing is working correctly with VMware ESX hosts, proactively make zoning decisions, adjust multi-pathing settings or rebalance workloads to avoid purchasing additional hardware.
Automatically Detect Zoning Issues
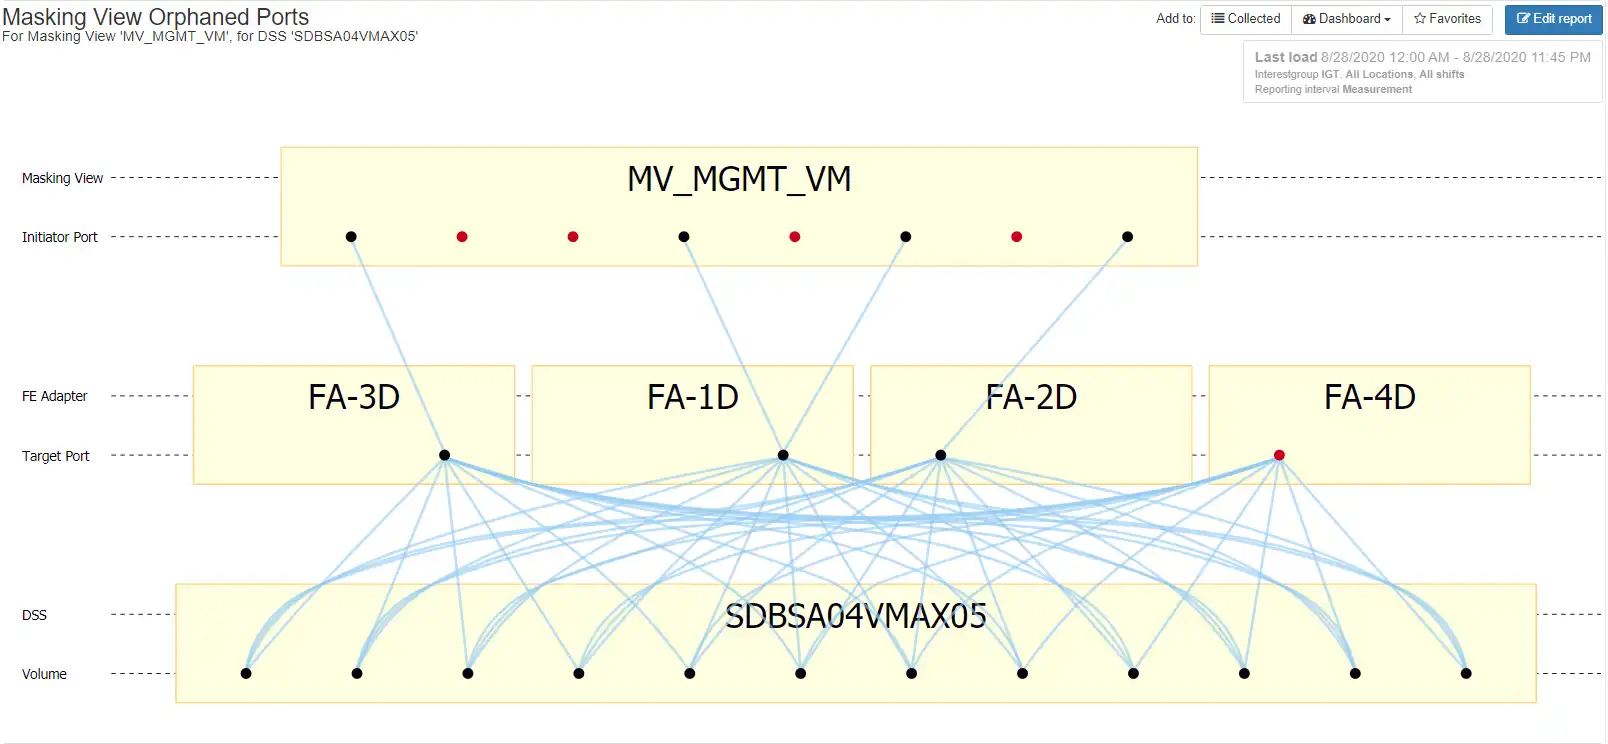
Automatically detect when hosts cannot reach intended storage target ports because zones are configured incorrectly.
Historical Trending
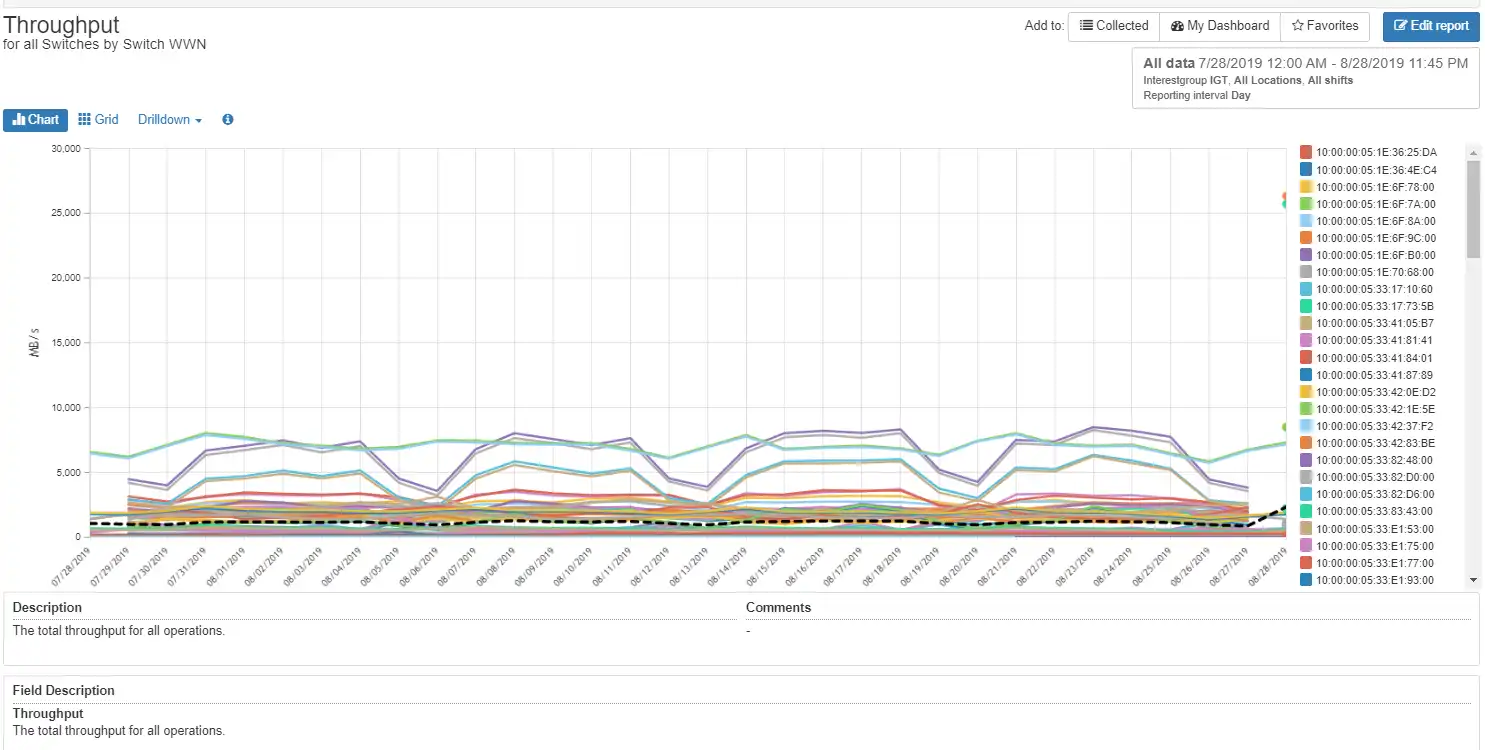
Performance and capacity metrics are kept at a detail level, and a daily level to allow for detailed performance analysis or long-term trending. You decide how long to keep detailed metrics.
Take advantage of specialized performance trend reports. With these you can track switch and switch port activity over the long term allowing you to assess trends of port utilizations, throughput and port usage.
Troubleshoot Connectivity, Performance, and Errors Issues
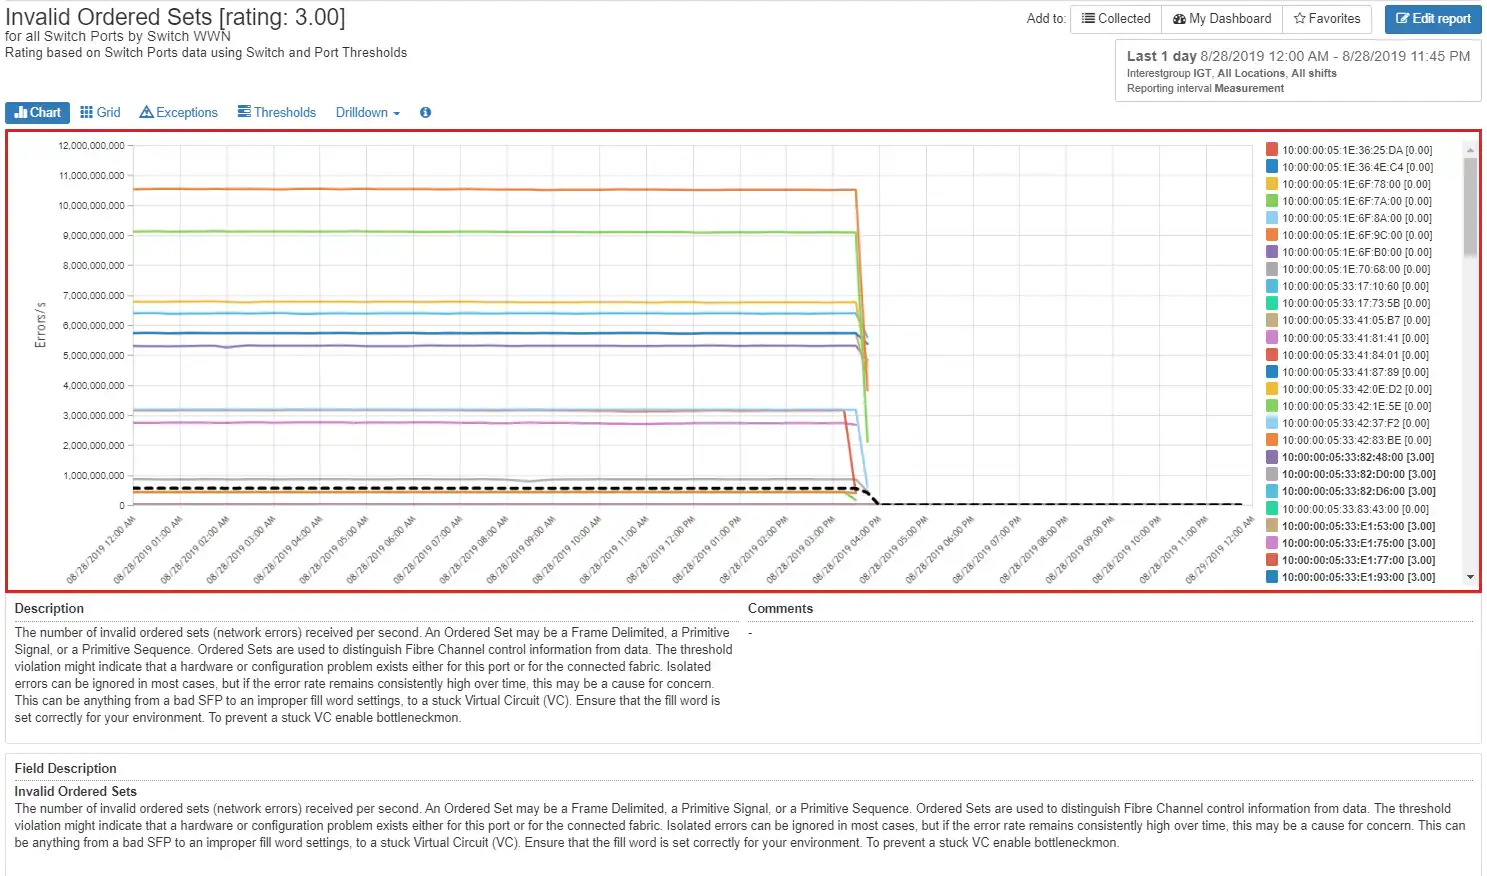
Visualize all of your heavy-hitting ports and easily drill down to see the connected storage or host ports.
View the performance of all the switches in your environment while maintaining the integrity of the roll-ups by surfacing problems. Switches identified with the highest rating have issues at the port level.
Take advantage of built-in guides to the port type for a selected switch and from there to a switch port that has a problem. The entire process takes only a few clicks and the ratings provide an easy guide to follow.
AIOps via SaaS Delivery

Advantages to adopting a cloud model include rapid deployment, minimal on-premise setup, offloading staff resources required to deal with on-premise installation, operations and product maintenance, and easy access to IntelliMagic consulting services to supplement local skills.
Proactive Health Insights
Visualize all storage switch exceptions in single pane of glass. Color coding of the KRIs provides an indication of the level of risk or problem severity for the infrastructure.
The AI-based analytics engine rates and correlates metrics to the specific hardware capabilities in order to minimize false positives.
End-to-End Topology
Interactive end-to-end topology represents fabric connectivity from the VMware guest all the way through to the back-end storage volume. At each point along the way, it is possible to drill down and diagnose root causes.
This interactive visualization allows you to identify single path issues as well as imbalances in the connectivity.
Rebalance Workloads for Maximum Performance
See at a glance where resources need to be reallocated to achieve maximum performance and the most efficient utilization of hardware resources.
Validate that host multi-pathing is working correctly with VMware ESX hosts, proactively make zoning decisions, adjust multi-pathing settings or rebalance workloads to avoid purchasing additional hardware.
Automatically Detect Zoning Issues
Automatically detect when hosts cannot reach intended storage target ports because zones are configured incorrectly.
Historical Trending
Performance and capacity metrics are kept at a detail level, and a daily level to allow for detailed performance analysis or long-term trending. You decide how long to keep detailed metrics.
Take advantage of specialized performance trend reports. With these you can track switch and switch port activity over the long term allowing you to assess trends of port utilizations, throughput and port usage.
Troubleshoot Connectivity, Performance, and Errors Issues
Visualize all of your heavy-hitting ports and easily drill down to see the connected storage or host ports.
View the performance of all the switches in your environment while maintaining the integrity of the roll-ups by surfacing problems. Switches identified with the highest rating have issues at the port level.
Take advantage of built-in guides to the port type for a selected switch and from there to a switch port that has a problem. The entire process takes only a few clicks and the ratings provide an easy guide to follow.
AIOps via SaaS Delivery
Advantages to adopting a cloud model include rapid deployment, minimal on-premise setup, offloading staff resources required to deal with on-premise installation, operations and product maintenance, and easy access to IntelliMagic consulting services to supplement local skills.
Book a Demo or Connect With an Expert
Discuss your technical or sales-related questions with our mainframe experts today
Secure and Flexible Deployment and Monitoring

In the Cloud
Cloud based deployment can be accessed from everywhere in the world and is easy to share with colleagues

Services & Support
Take advantage of IntelliMagic's experienced performance experts for standalone custom services or daily monitoring

On Premise
Install the software on premise and use it offline for total control of your installation
Continue Learning with These Resources
Connect With an Expert
Discuss your technical or sales-related questions with our experts today