
A key aspect of most mainframe modernization efforts in recent years has been to provide access to business-critical data and applications on z/OS to cloud, mobile, and other external applications. In today’s world that access is typically enabled through APIs (Application Programming Interfaces), with z/OS Connect serving as the gateway.
APIs provide a simple and intuitive way for developers to access mainframe transactions and data using interfaces that are familiar to them without needing to learn the specifics of z/OS or its subsystems. This approach is also attractive because it enables reuse of mainframe functionality without the need to modify applications or replicate data.
There is business value in having this access going both directions. In addition to distributed or cloud native applications accessing mainframe data resources, the functionality of mainframe applications can also be enhanced through the ability to call off-platform applications.
Calls in to your system from off-platform can be significant drivers of workload. You need visibility into these requests to manage your systems and to provide good service to these API calling applications.
In this blog we’ll review the data available to understand your systems’ z/OS Connect API activity, to help you manage service levels and demand for system resources.
API Provider
API Provider is the term for calls coming into your z/OS system, where a service is invoked to access transactions or data from back-end systems such as CICS, IMS, or Db2.
Figure 1 shows the major components in the request flow. Calls come in via APIs, are mapped to services which handle data transformations and route requests to the back-end service providers. The back-end systems are referred to as the System of Record (SOR) and include CICS, IMS, Db2 and others supported by z/OS Connect.
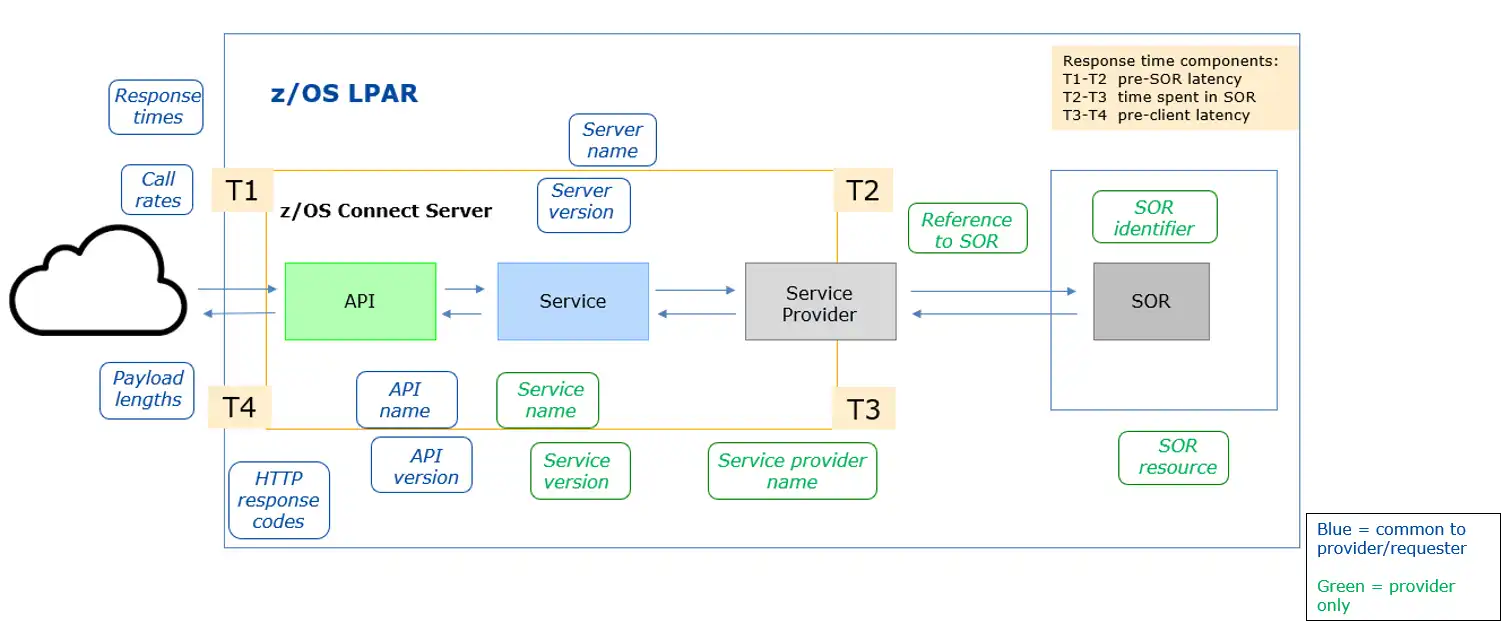 Figure 1: Key Metrics and Time Components for API Provider
Key API Provider Metrics in z/OS Connect (SMF 123.1 Records)
API Provider requests are captured in the SMF 123 subtype 1 record. Figure 1 shows some of the key metrics available to help you understand your API workload:
- Response times
- Call rates
- Payload lengths
- Server name
- Server version
- API name
- API version
- HTTP response codes
In addition, some metrics are specific to API Provider calls. These metrics are shown in green in Figure 1 and include:
- Service name
- Service version
- Service provider name
- Reference to SOR
- SOR identifier
- SOR resource (e.g., CICS region and transaction ID)
T1/T2/T3/T4 represent timestamps:
- T1 – time the incoming request was received by the z/OS Connect server
- T2 – time the request was sent to the System of Record
- T3 – time the response was received from the System of Record
- T4 – time the response was ready to be sent to the HTTP client
These and other metrics provide a great deal of flexibility for profiling your API workloads and investigating issues. You can filter or sort the data by any metric, or combination, to provide the view you need for any analysis.
Number of Requests: API Provider
Figure 2 shows the volume of requests for a specific API over the course of a day.
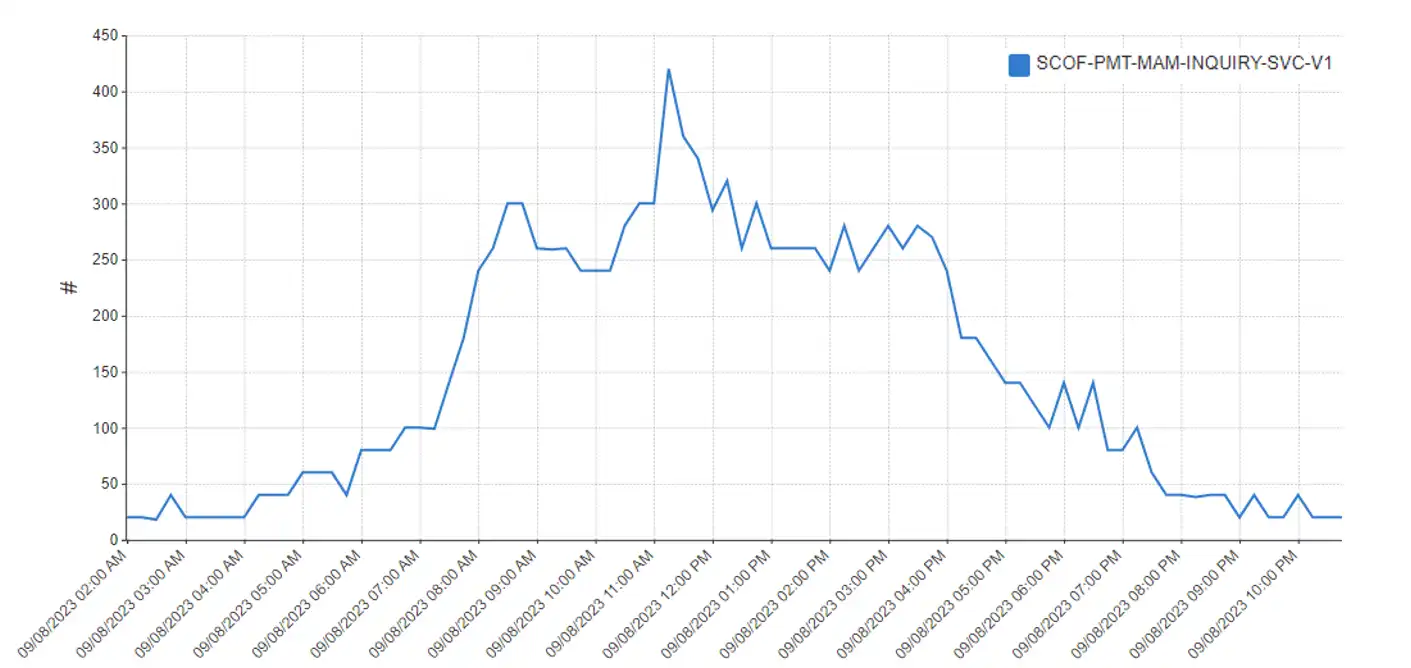 Figure 2: Volume of Requests for a Specific API and Service
In this example, the API Name and Service Name have a 1:1 mapping and similar names. That’s not always the case, so being able to report by API or service, and correlate the two, is necessary.
Understanding your API workloads will be very similar to understanding traditional workloads. You’ll want to:
- differentiate the work – by system/server/API/service/SOR
- understand time patterns, peaks and trends – by interval/day/week/month
- understand which back-end SOR is being called, in enough detail to assess resource consumption or investigate issues – e.g., CICS Applid and Tran ID
- understand the response times and components – normal vs. abnormal – e.g., time spent in SOR, time spent in server
Response Time Components
Figure 3 shows the request volume for the same API and adds the response time component breakdown. You can quickly see that response times do not increase as volume increases, and that time spent in SOR is the largest component.
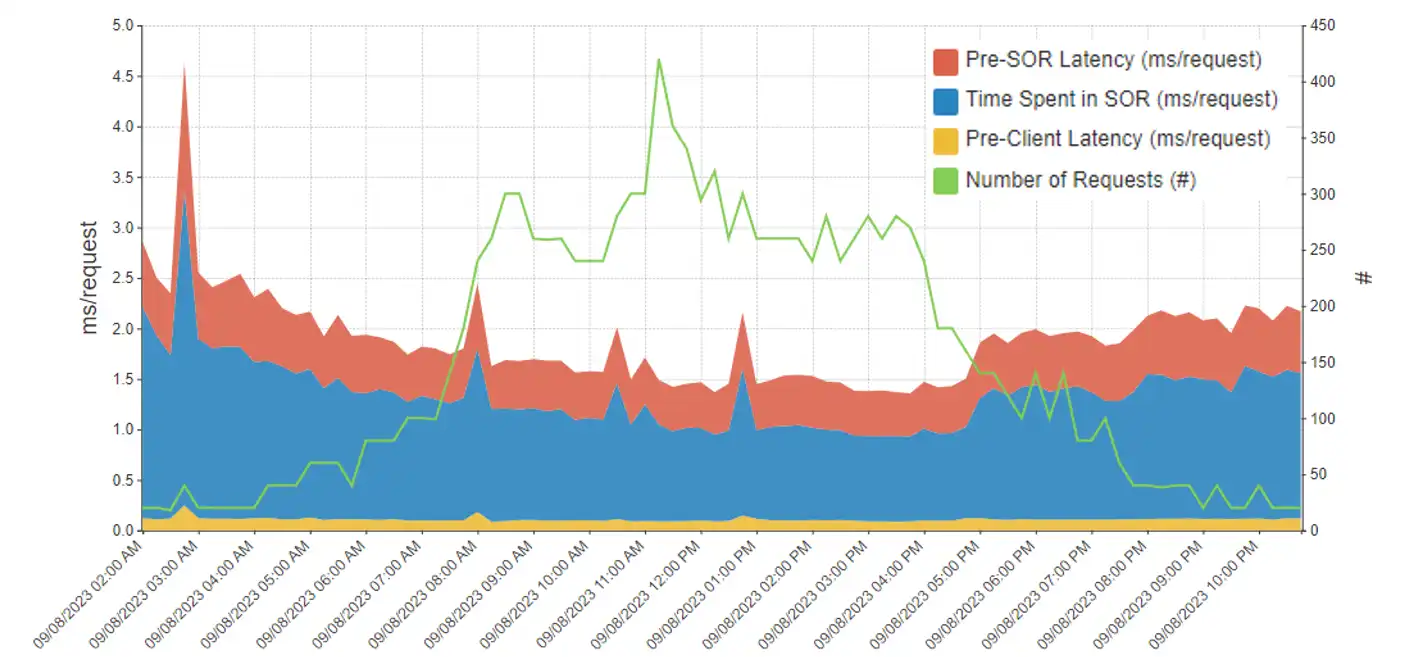 Figure 3: Request Volume and Response Time Breakdown for a Specific API (Provider)
You can also see several spikes in time spent in SOR. To investigate these spikes, you could drill down to the specific SOR being called, as shown in Figure 4.
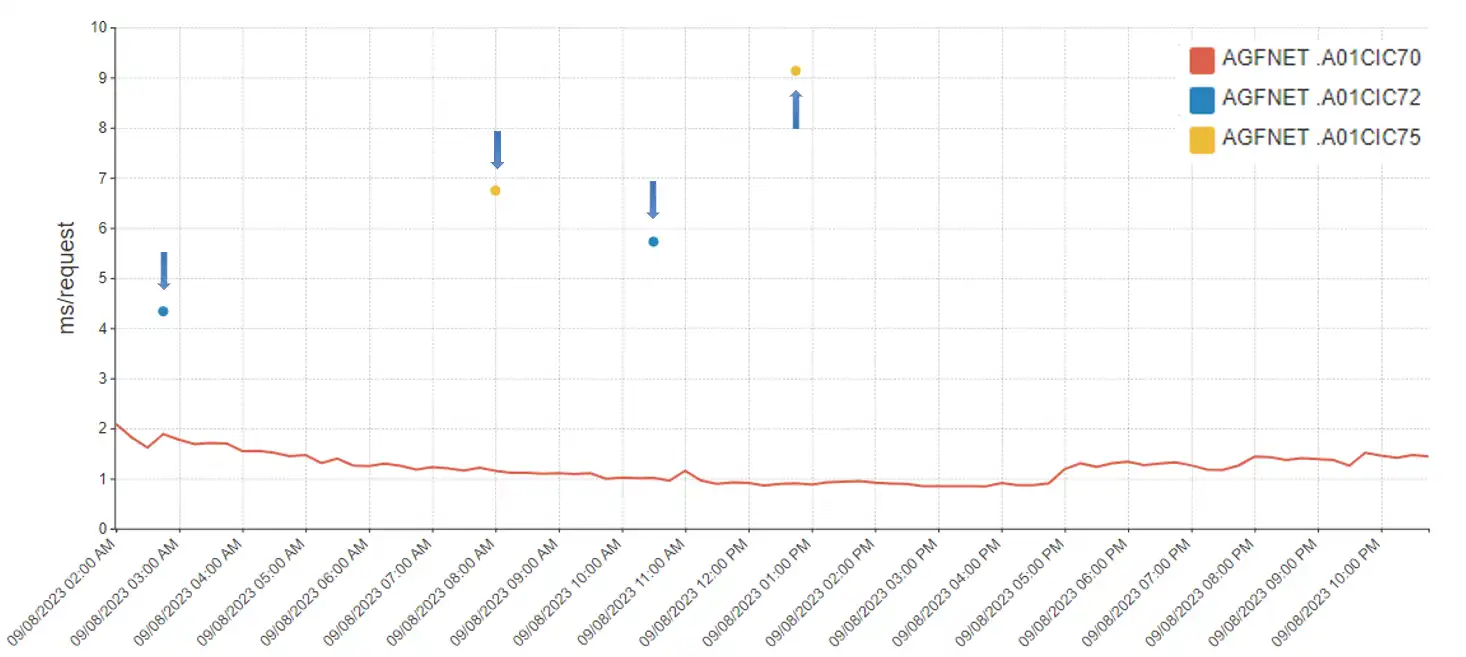 Figure 4: Time Spent in SOR, by SOR Called
Here we see that three different CICS regions serve this API, and higher response times are being delivered by two of them. Further investigation by system, by server, by rate and by time will help you narrow the problem space. You can also correlate with traditional data from WLM and address space data.
API Requester
API Requester is the term for calls originating from applications on your z/OS system, making HTTP calls to API’s that are off-platform. These are essentially the opposite of Provider calls. API Requester requests have some data fields that differ from Provider requests, and they are captured in the SMF 123 subtype 2 record.
Figure 5 shows the major components in the request flow and some of the key metrics describing them.
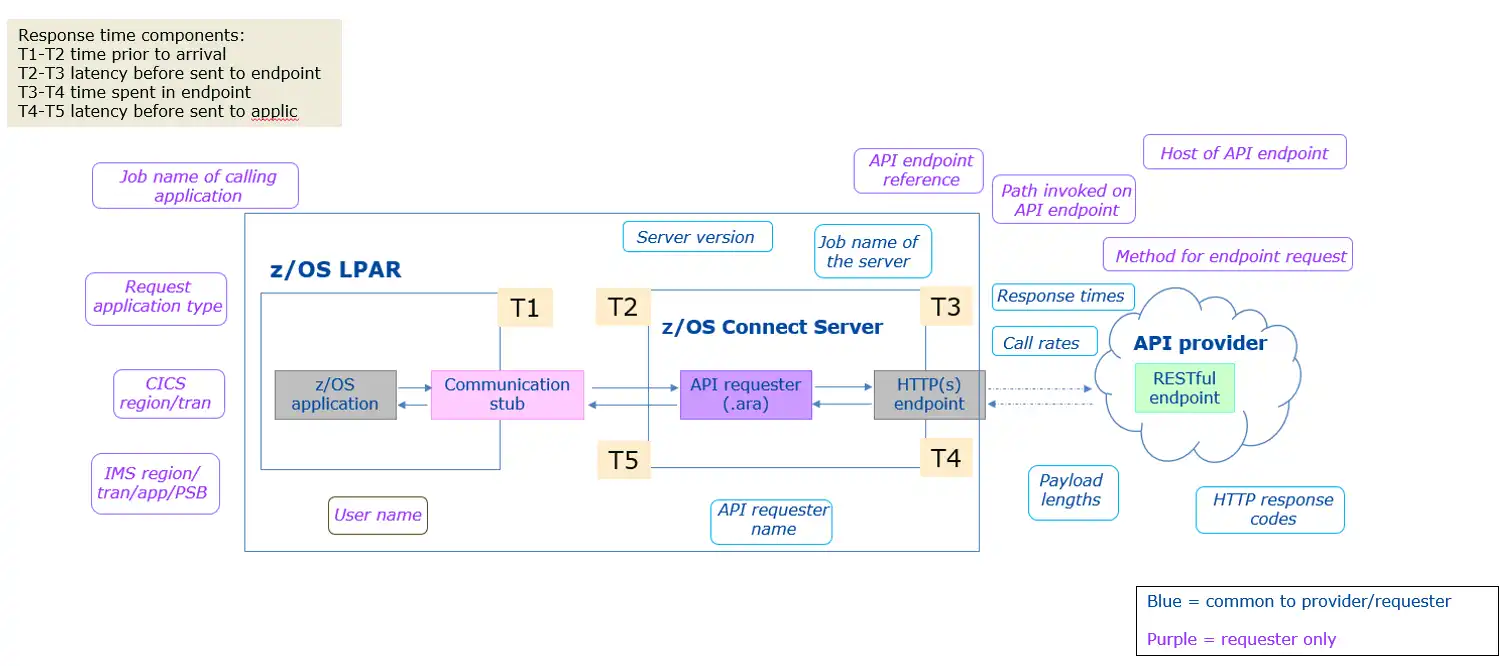 Figure 5: Key Metrics and Time Components for API Requester
Key API Requester Metrics in z/OS Connect (SMF 123.2 Records)
As with the API Provider metrics, from Figure 1, the common metrics across both areas include:
- Response times
- Call rates
- Payload lengths
- Server version
- Job name of the server (server name)
- API name
- API version
- HTTP response codes
The key metrics unique to API Requester include:
- Job name of calling application
- Request application type
- CICS region/tran
- IMS region/tran/app/PSB
- User name
- API endpoint reference
- Path invoked on API endpoint
- Host of API endpoint
- Method for endpoint request
Since the calls are made by z/OS applications, we have information about the caller and an additional time stamp for time the request left the calling application. We also have information about the endpoint request.
Number of Requests
Figure 6 shows request volumes for a specific API over the course of a day, broken down by calling application.
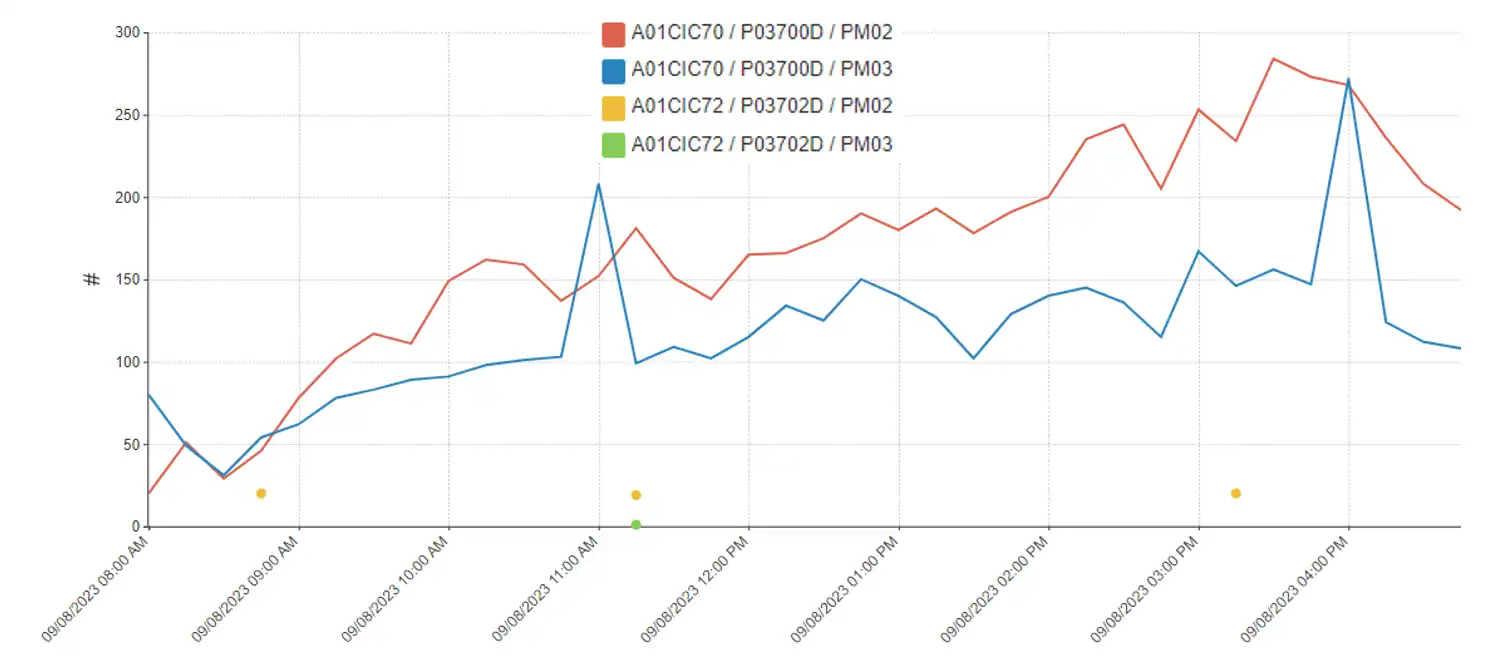 Figure 6: Request Volumes for a Specific API, by Calling Application
Almost all the activity comes from transactions PM02 and PM03 in APPLID A01CIC70 with address space name P03700D (red and blue lines), with rare calls from APPLID A01CIC72 (yellow and green dots).
In Figure 7 we break down API calls by path invoked on API endpoint.
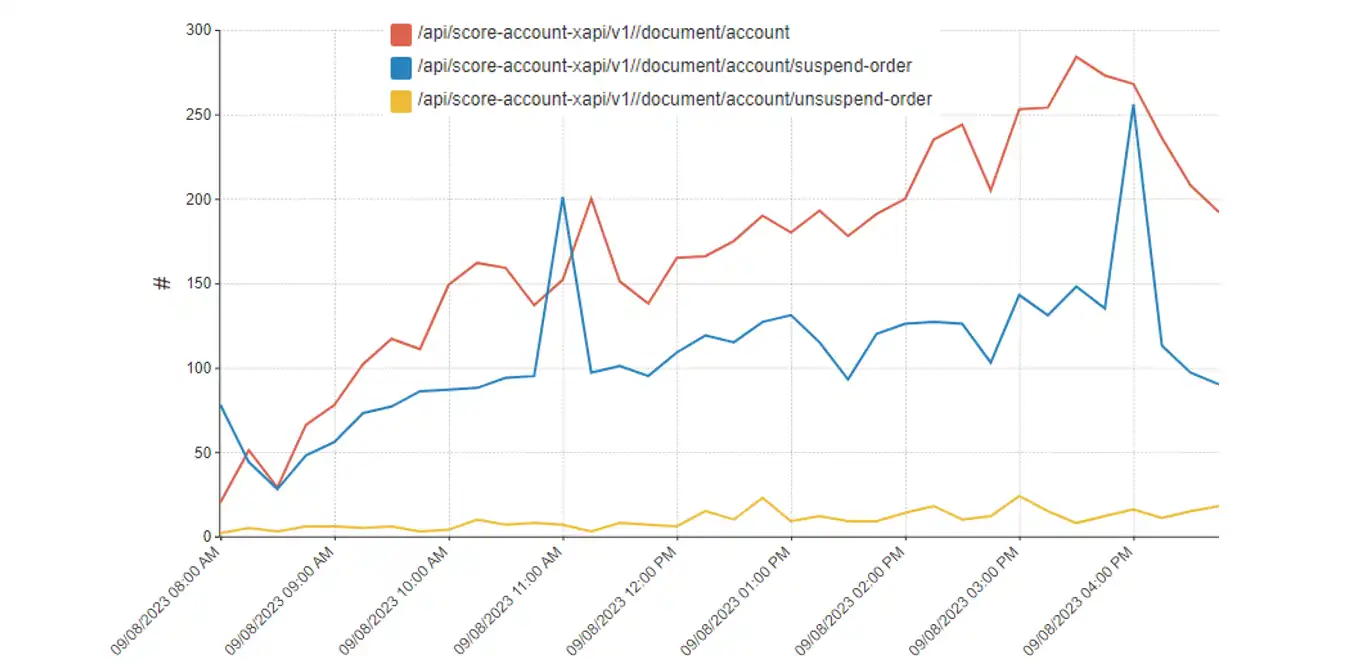 Figure 7: Number of Requests for Selected API Requester Name by Path Invoked on API Endpoint
By reviewing API endpoint reference, host, path, and method of the calls, as well as the calling application, you can gain valuable insight into the applications involved. As with traditional applications, the more you know about an application and the easier it is to share data, the better you can communicate and team with application owners and other stakeholders.
Response Time Components
As mentioned earlier, we have five response time timestamps for Requester calls. Figure 8 shows the resulting response time component breakdown.
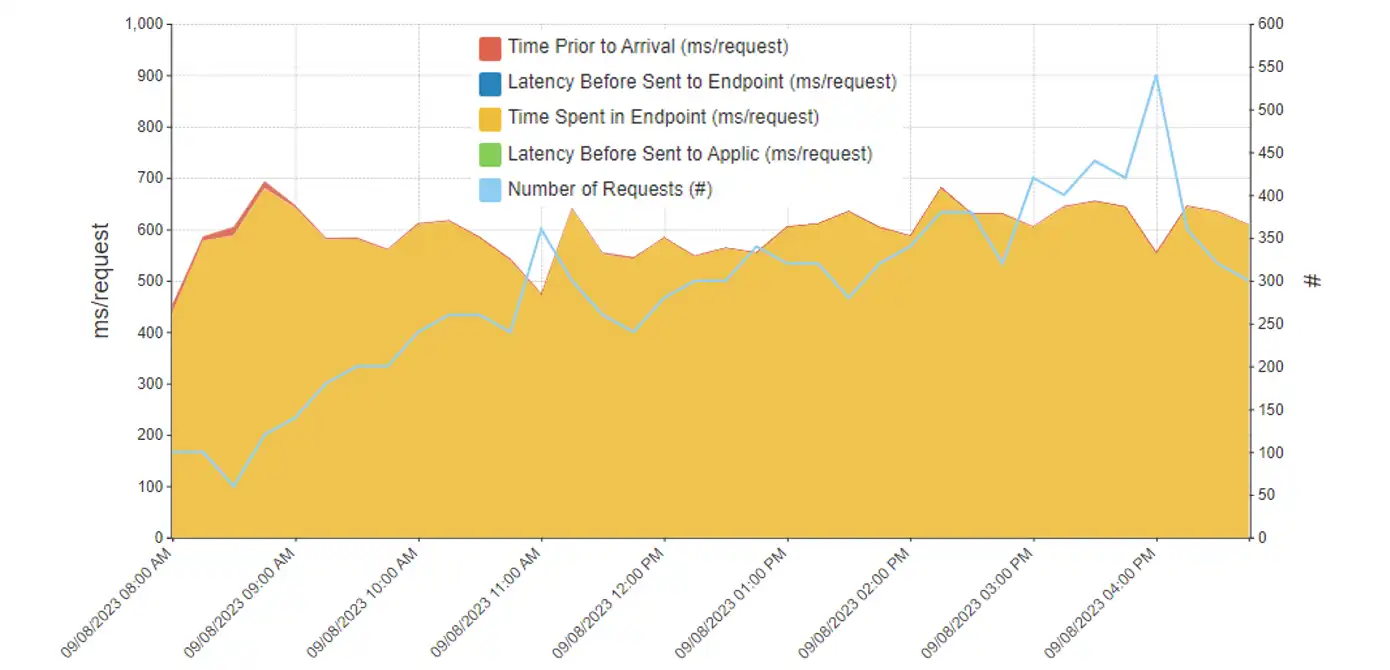 Figure 8: Request Volume and Response Time Breakdown for a Specific API (Requester)
It’s not surprising that most of the time is spent in the HTTP call to the endpoint, but if you had significant time spent in the z/OS Connect server you would see it here.
Payload Lengths
The length of payloads sent to and received from the API endpoint is captured in the Requester data and may serve to establish profiles.
The dashboard excerpt shown in Figure 9 reveals consistent profiles by CICS transaction ID and method. In this example, the values for bytes sent are very consistent: 830 for PM02 POST, 42 for PM03 POST, 24 for PM03 PUT. Bytes received back from the endpoint are also relatively consistent: 160 for PM02 POST, and near 60 for both methods for PM03.
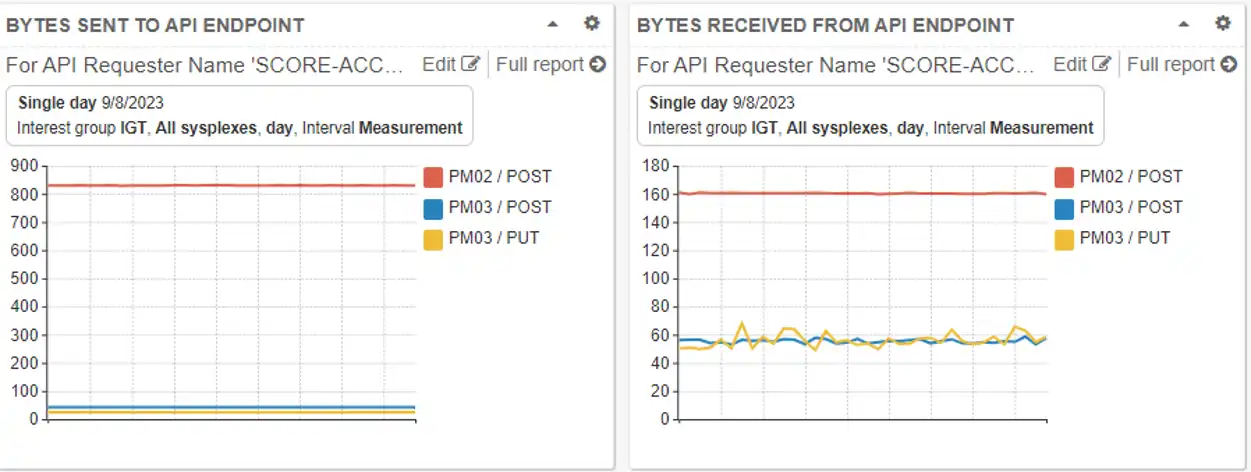 Figure 9: Payloads Sent & Received for API Requester Name by CICS Tran ID & Method for Endpoint Request
Visibility is Key
Although many companies have adopted APIs and z/OS Connect as a key component of mainframe modernization journeys, many shops still have limited visibility into these calls. You need visibility into these requests to provide good service and to understand what off-platform applications are driving demand for mainframe resources.
IntelliMagic Vision gives you an easy and comprehensive way to profile and monitor your environment, not just for z/OS Connect but for all of your various z/OS systems, components, and storage.
Please reach out to us if you’re interested in gaining further insights into ways to better manage your z/OS Connect implementations and enhance availability and performance.
This article's author
 Dennis Moore
 Share this blog
Profiling zHyperLink Performance and Usage
Profiling zHyperLink Performance and UsageYou May Also Be Interested In:
Should There Be a Sub-Capacity Processor Model in Your Future? | IntelliMagic zAcademy
In this webinar, you'll learn about the shift towards processor cache efficiency and its impact on capacity planning, alongside success stories and insights from industry experts.
Top 10 IntelliMagic Vision Features Released in 2023
With over 160 announced product updates, 2023 was a spectacular year of releases for users of IntelliMagic Vision for z/OS. In this blog we try to narrow it down to the 10 most popular, helpful, and groundbreaking.
Modernizing z/OS Connect Performance Analysis | IntelliMagic zAcademy
This webinar provides valuable insights into the principles that can help modernize your approach to z/OS Connect data analysis.
Book a Demo or Connect With an Expert
Discuss your technical or sales-related questions with our mainframe experts today