
Although zHyperLink has been available for several years now, many mainframe sites have yet to implement the technology into their production environment. In this blog, we’ll review one site’s recent production implementation of zHyperLink for reads, for Db2. We will provide examples of reporting at the PCIe adapter, volume level and data set level which you may find helpful to analyze your own results.
Introduction to zHyperLink
Over the years, there have been many significant advances in I/O technology. Today, I/O is really, really fast. So how can we gain further improvement? One approach is to take a subset of I/Os for data that resides in close proximity to the processor, add a new higher-speed link, and make them synchronous in order to avoid interrupt processing and task switching. This is what zHyperLink does.
Figure 1 shows the physical connectivity between the CPC and the Storage Control Unit.
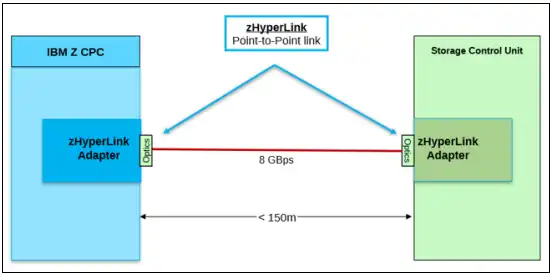
Figure 1: zHyperLink physical connectivity (Source: IBM Redbook “Getting Started with IBM zHyperLink for z/OS” Page 20)
zHyperLink provides a short distance direct connection of up to 150 meters. I/Os are synchronous, eliminating the overhead of z/OS dispatcher delays, I/O interrupt processing and processor cache reload. Latency improvements up to 4.5 times are possible with current hardware (z15s and DS8950Fs in this example). Think of 20 microsecond I/O times, as we’ll see below.
There is a CPU time price to be paid, since the I/Os are synchronous and the processor waits for them to complete. And there are limitations on which data sets and I/Os are eligible. However, the benefits outweigh the costs for most customers. If you need assistance analyzing your workloads for zHyperLink candidates and assessing the anticipated impacts, please contact us at IntelliMagic.
zHyperLink Connectivity Best Practices
Let’s look at data from a site who recently implemented zHyperLink and review the kinds of reports you can produce for your own analysis.
We’ll begin by verifying that our configuration adheres to best practices for connectivity. Figure 2 below shows a single LPAR and a single DS8950F subsystem. We see there are two Physical Channel IDs for PCIe, each with four PCIe Function IDs.

Figure 2: Best practice configuration for zHyperLink connections
Per best practices, you should be configured this way throughout your environment – 4 PFIDs per LPAR per zHyperLink connection (CEC, adapter ID, port #). We can also see the even distribution of I/O across PFIDs and ports. Including your other LPARs would also allow you to identify the busier LPARs.
Profile zHyperLink Usage and Performance
Now let’s look at our mix of zHyperLink and FICON I/O to start to profile our usage and performance.
Total I/O Rate
Figure 3 shows I/O rates over the course of a single day, from midnight to midnight.
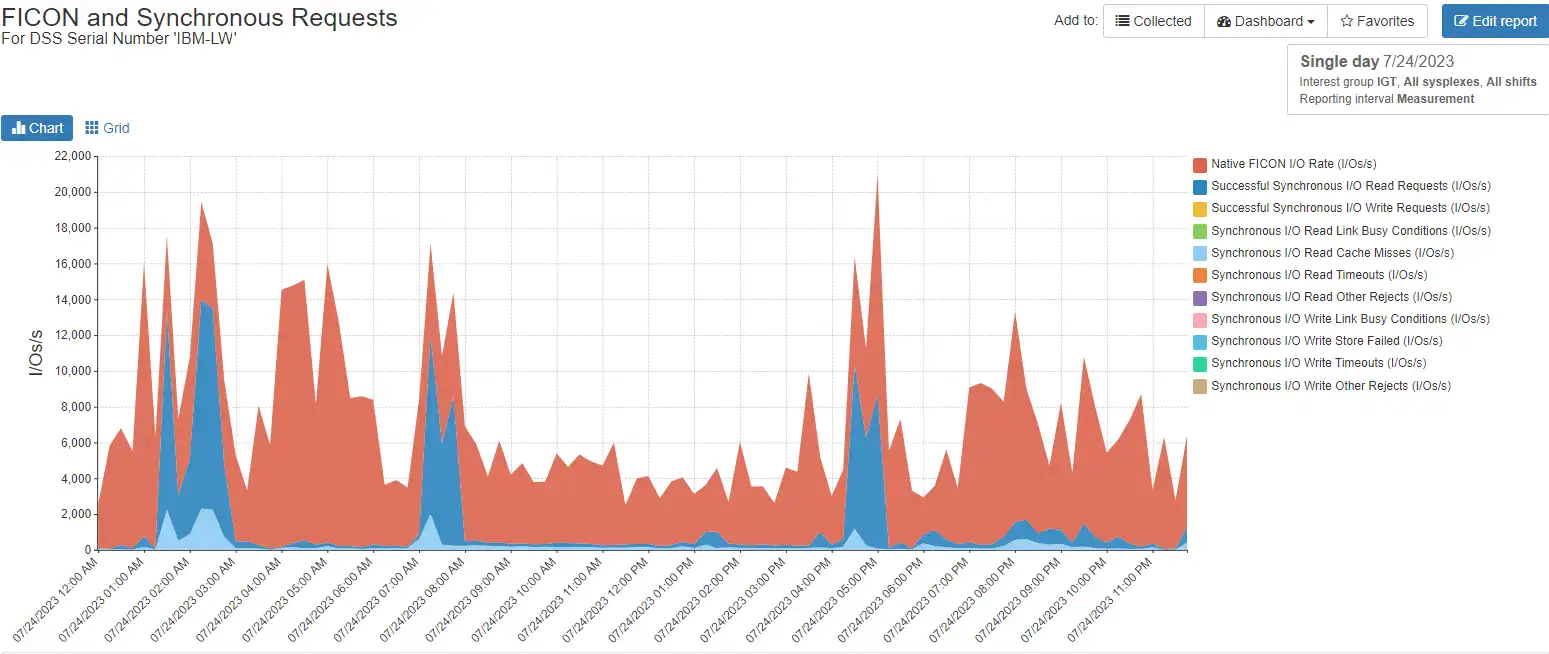
Figure 3: Total I/O rate including breakdown of synchronous I/Os
Most of the I/Os are native FICON as usual, but you now also see spikes of successful synchronous reads and some synchronous read cache misses. Note that only synchronous reads are currently enabled in this data, so no writes are shown.
Synchronous I/Os
Figure 4 examines the synchronous I/O without the native FICON, for easier visibility into patterns.
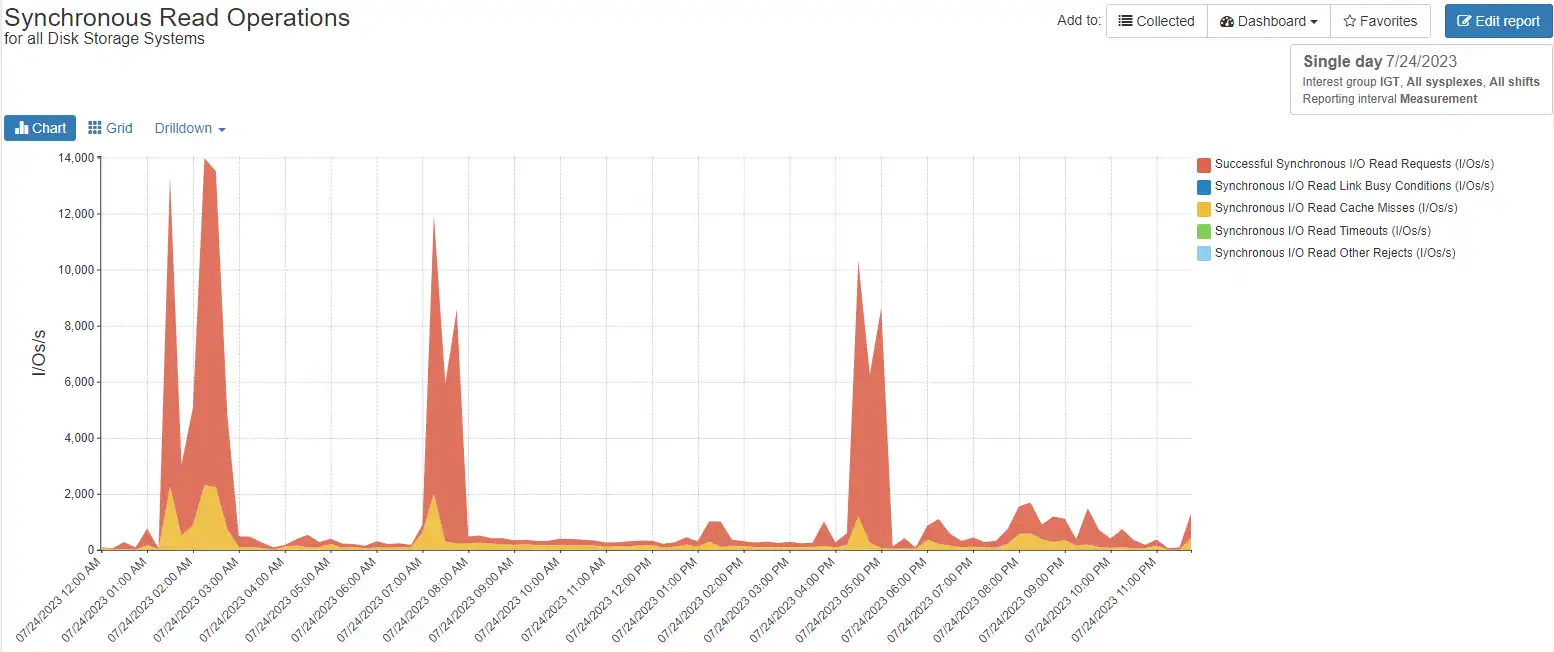
Figure 4: Synchronous I/O breakdown including hits and cache misses
We see there are three main spikes of activity, at 0100, 0700 and 1600, with more than 10,000 synchronous I/Os at peak. We also see the read cache misses are a small percentage of the synchronous I/Os and follow the peaks, as you might expect. Read cache misses are re-driven as native FICON I/O which incurs overhead, so you’ll want to keep an eye on misses going forward.
Synchronous Latency
Figure 5 compares latency to I/O rate for the synchronous read requests.
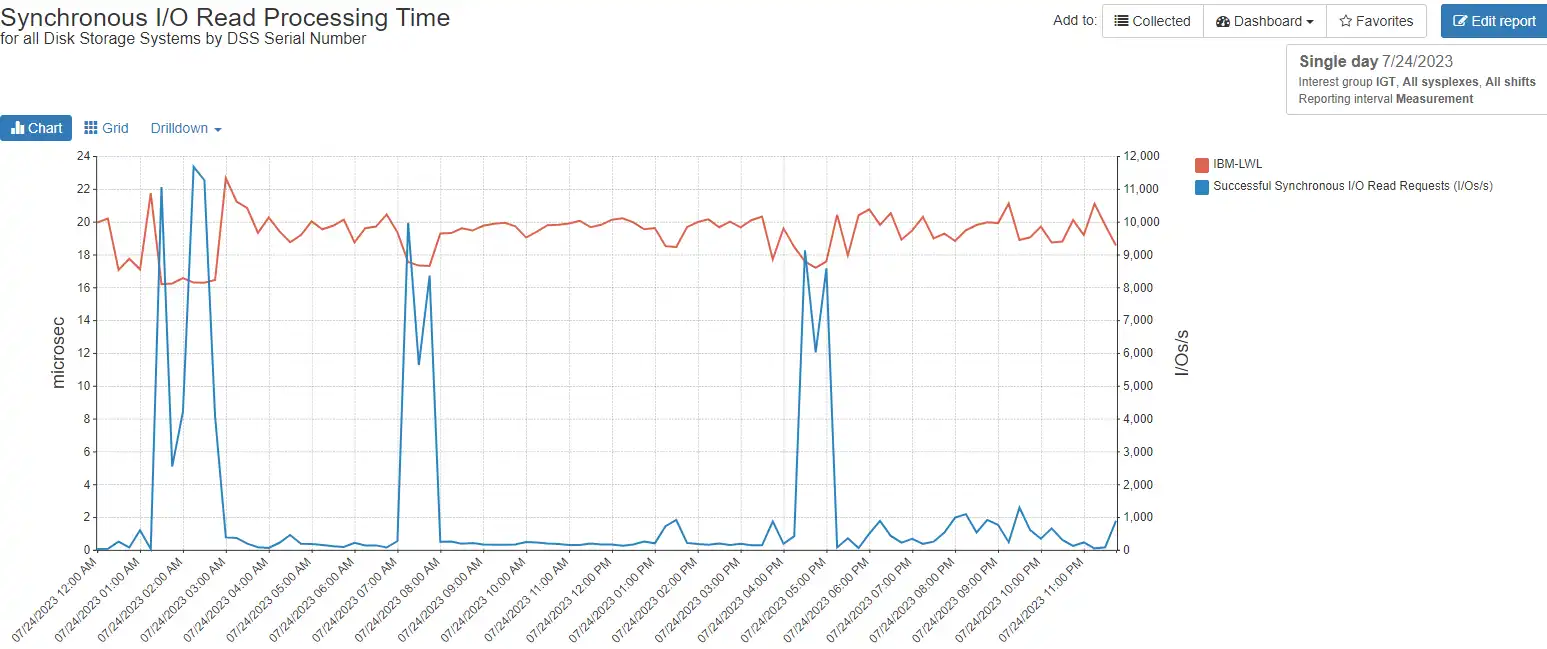
Figure 5: Synchronous latency versus I/O rate
The top red line shows latency, or response times, varying from 16-22 microseconds (way fast!) over the course of the day. The blue line of three peaks should look familiar by now, as the request rate. Note that as the request rate goes up, the response time comes down and is consistently under 20 microseconds.
Synchronous Read Hits
We can also report synchronous hits and misses by data set name. Figure 6 shows a daily summary by data set name, but you could display any of these over time as well.
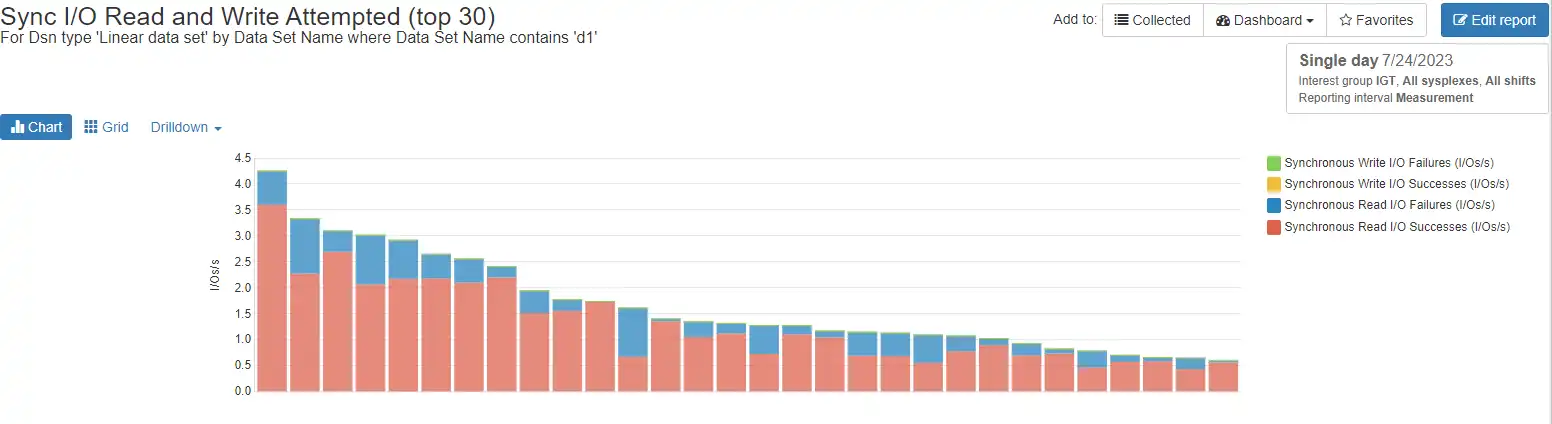
Figure 6: Synchronous read hits and misses by data set
This site turned on synchronous read processing for Db2, so we’re looking at the hit percentage for production Db2 data sets.
Time Pattern for Synchronous Requests
With any new implementation, it can be helpful to understand the time patterns that apply to the workload involved. Figure 7 shows that the single day we’ve been looking at is typical.
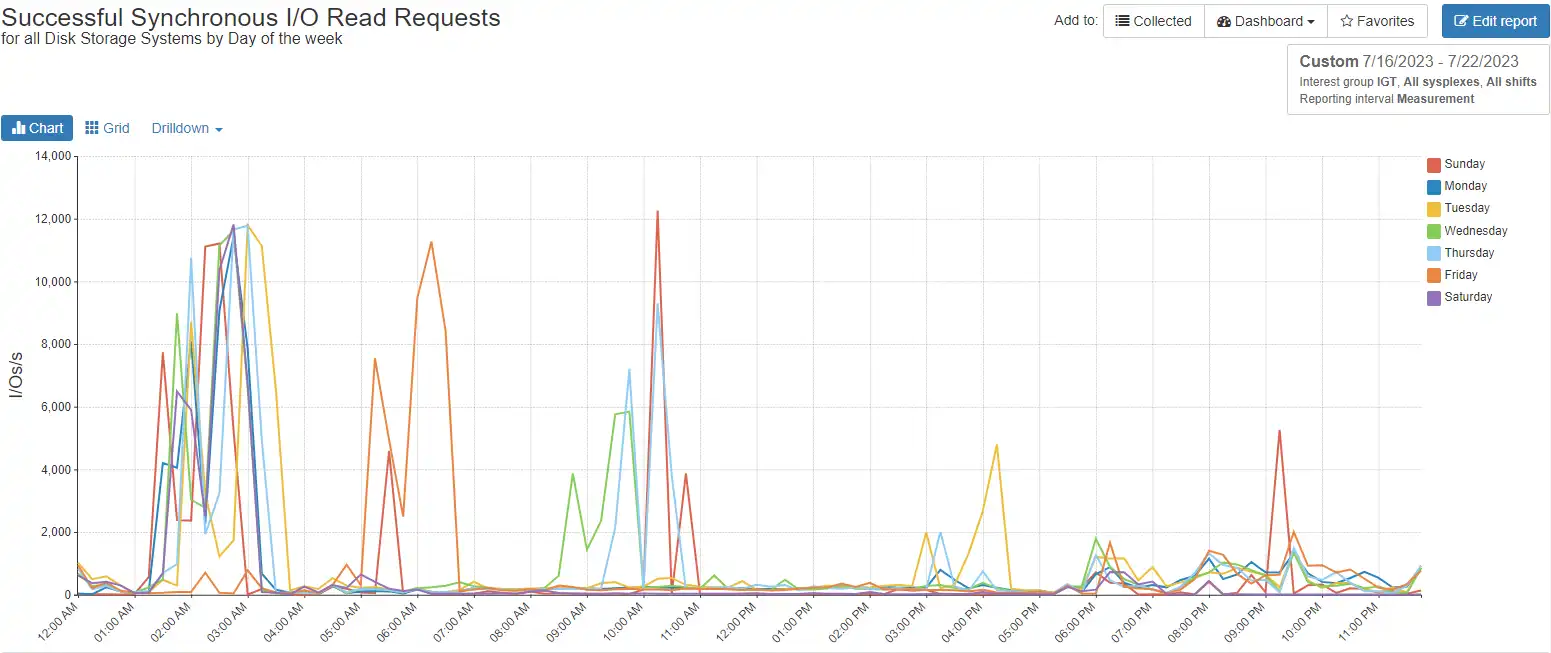
Figure 7: Time pattern for synchronous requests
This Db2 workload drives most of its synchronous I/O in the 0100-0300 hours consistently, with little change by day of the week.
Data Set Level Performance
Another way to look at data set level performance is shown in Figure 8.
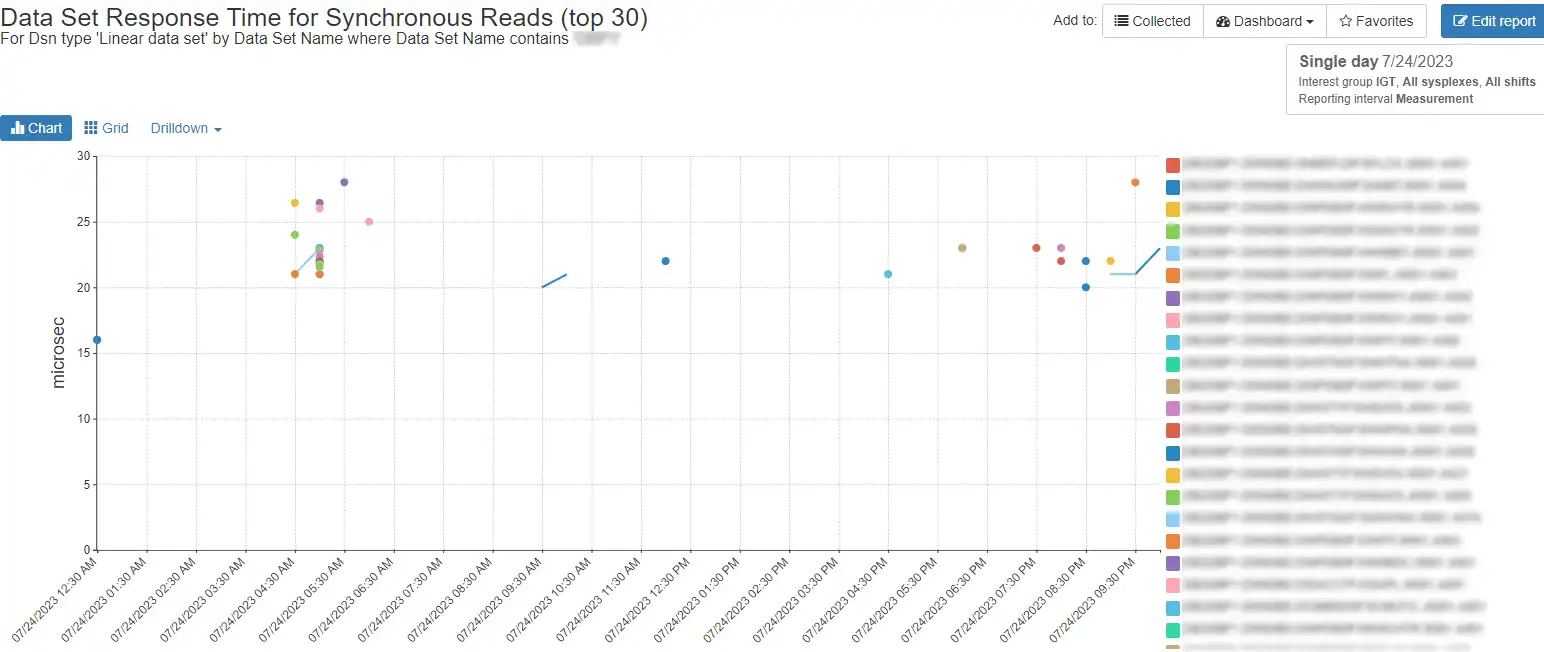
Figure 8: Times and latency for individual data sets
Figure 8 shows the top 30 linear data sets with ‘DBP1’ in their name, with response times and time of day when they were accessed. Reports like this, along with the related reporting in IntelliMagic Vision, provides a strong capability to profile your workload and understand technology benefits or diagnose problems or changes.
Demonstrating the Benefit of Improved Technology
zHyperLink utilizes improved technology including the PCIe bus and synchronous I/O to significantly improve latency for applications. This improvement can be shown explicitly from the RMF/SMF data and is key to justifying new technologies and new projects.
IntelliMagic Vision gives you an easy and comprehensive way to verify the benefit, not just for zHyperLink but for the many enhancements your teams implement each year.
This article's author
 Dennis Moore
 Share this blog

You May Also Be Interested In:
What's New with IntelliMagic Vision for z/OS? 2024.2
February 26, 2024 | This month we've introduced changes to the presentation of Db2, CICS, and MQ variables from rates to counts, updates to Key Processor Configuration, and the inclusion of new report sets for CICS Transaction Event Counts.
Viewing Connections Between CICS Regions, Db2 Data Sharing Groups, and MQ Queue Managers
This blog emphasizes the importance of understanding connections in mainframe management, specifically focusing on CICS, Db2, and MQ.
What's New with IntelliMagic Vision for z/OS? 2024.1
January 29, 2024 | This month we've introduced updates to the Subsystem Topology Viewer, new Long-term MSU/MIPS Reporting, updates to ZPARM settings and Average Line Configurations, as well as updates to TCP/IP Communications reports.
Book a Demo or Connect With an Expert
Discuss your technical or sales-related questions with our mainframe experts today