
One key success factor in managing today’s mainframe environments is having a good handle on the multitude of connections between CICS regions, Db2 data sharing groups and members, and MQ queue managers. Having good visibility into these complex configurations can help CICS, Db2, and MQ performance analysts and administrators improve maintenance planning, optimize traffic, and shorten mean-time-to-resolution for many issues.
In this blog and subsequent video walkthrough, I’ll demonstrate one approach to visualize these connections by leveraging views that integrate data from multiple SMF data sources.
Using Subsystem Topology to View CICS, Db2, and MQ Connections
Figure 1 below shows a screenshot of the Subsystem Topology viewer within IntelliMagic Vision. We can see the connections between CICS and connected Db2 and MQ subsystems.

Figure 1: CICS, Db2, and MQ Subsystem Topology View
Orienting to this view, the CICS functionality that issues SQL calls to Db2 members and or MQ commands to MQ queue managers appears in the center of the view with the MQ queue managers along the top and the Db2 members and their associated data sharing groups along the bottom.
Since there are hundreds of CICS regions at many sites, this top-level view begins at the level of customer defined CICS groups, which typically reflect business applications.
Identify CICS Component Regions
From this initial view, one next step could be to expand a CICS group to identify its component regions. In Figure 2 below, the CICS group included five regions. We can also identify connections to four MQ queue managers along the top and four Db2 members that all belong to a single Data Sharing Group along the bottom.
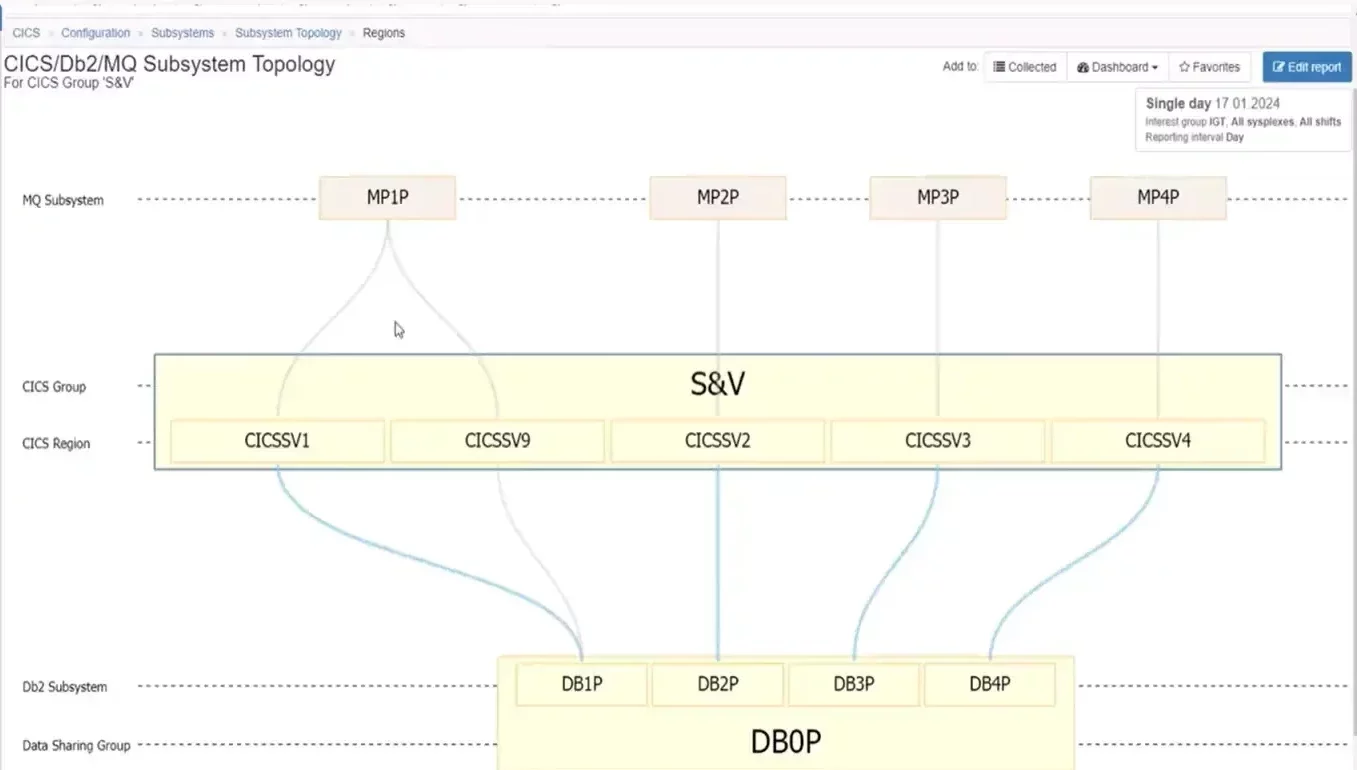
Figure 2: Isolating on a single CICS Group shows its regions and their MQ and Db2 connections
That same view for another CICS group, such as in Figure 3 below, involves a more complex set of relationships. It includes almost thirty CICS regions, but despite the fact these regions were grouped together from a business application perspective, we can see that they have very differing Db2 and MQ configuration profiles.
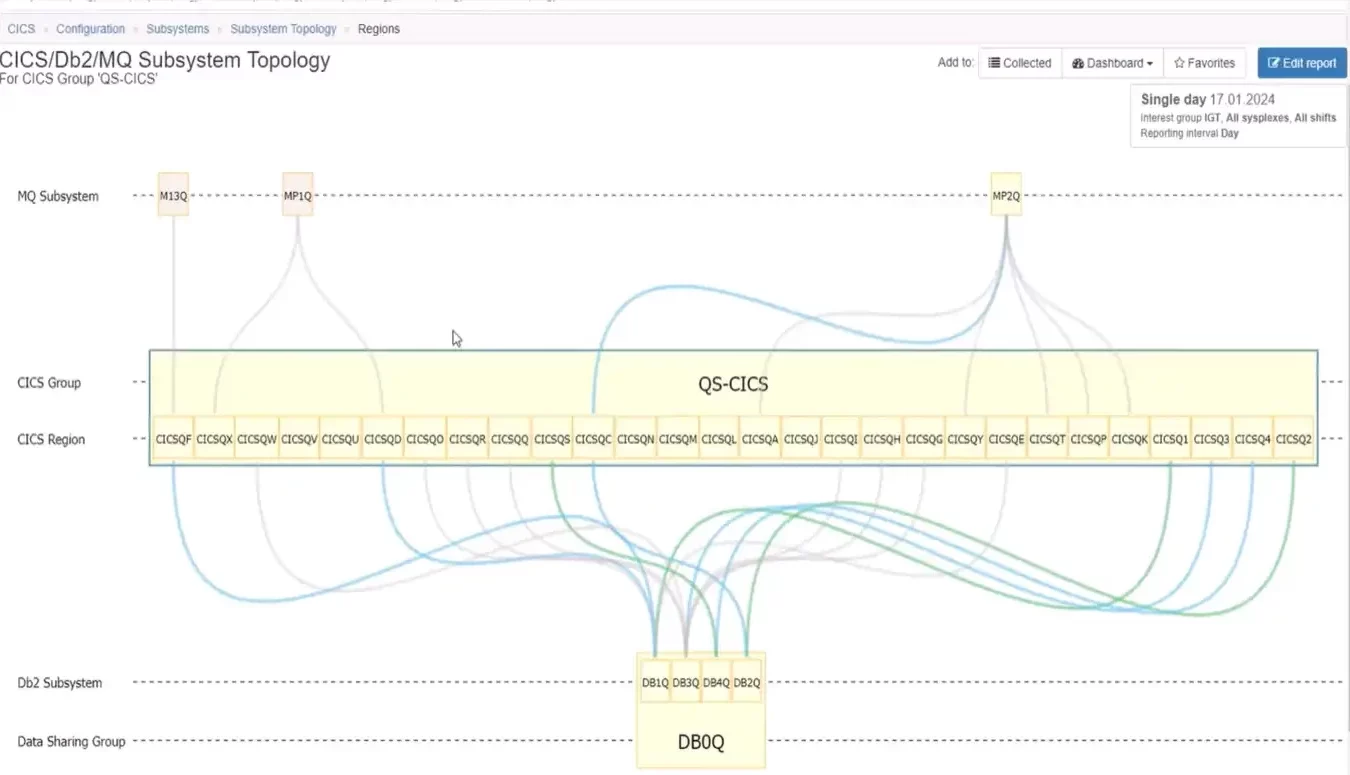
Figure 3: CICS Group with 30 Connections
This type of topology view clearly shows that some regions only have connections to a queue manager and not a Db2 member, while others have connections to a Db2 member, but not a queue manager. And some regions have connections to both MQ and Db2.
For groups that contain too many regions to have space to view all the region names, we can still gain overall insights into the configuration. In Figure 4 below it is apparent that all CICS regions that connect to Db2 do so to a single data sharing group, and there is general symmetry among most of the regions in this group to four primary MQ queue managers as seen along the top.
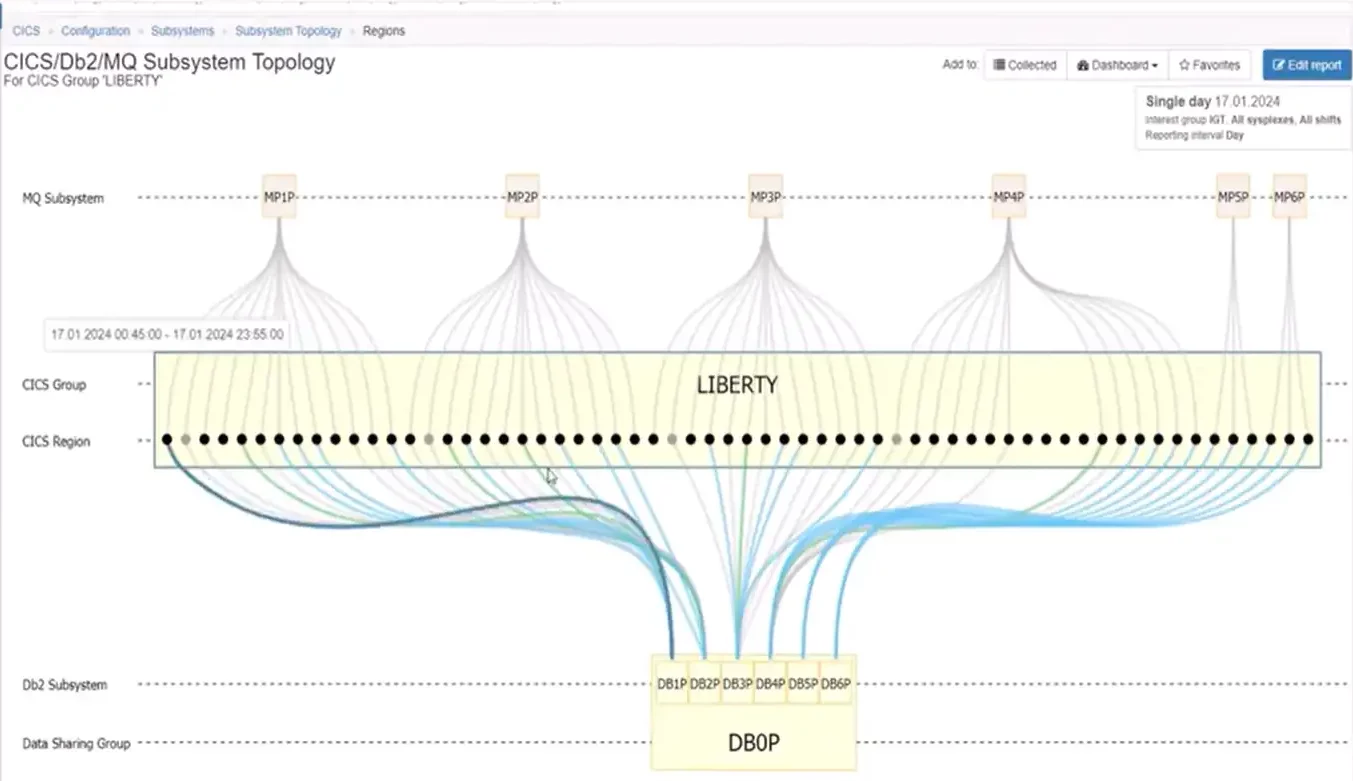
Figure 4: CICS Group with Over 60 Regions
Isolating Db2 Subsystem Views
So far we have approached the discussion from a CICS-centric point of view. Topology views can also be leveraged to create Db2-centric views, such as in Figure 5, which shows all the CICS groups that are connected to the selected data sharing group.
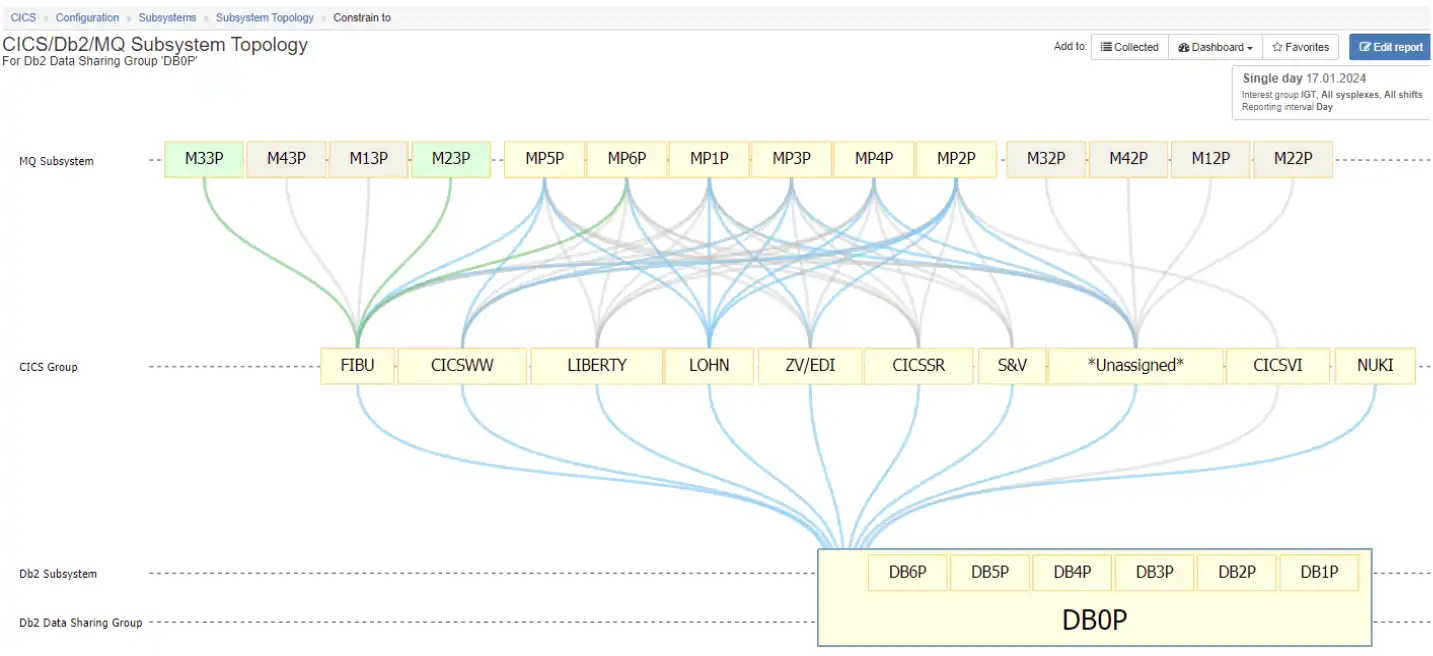
Figure 5: Db2-Centric View of Subsystem Topology Viewer
Isolating MQ Subsystem Views
MQ-centric views that show all the CICS groups that are connected to a particular MQ queue manager can also be helpful. Figure 6 surfaces a naming convention where almost all the CICS regions that connect with the selected queue manager have a “5” in their name. And the regions all connect to a Db2 member, which is also named with a five.
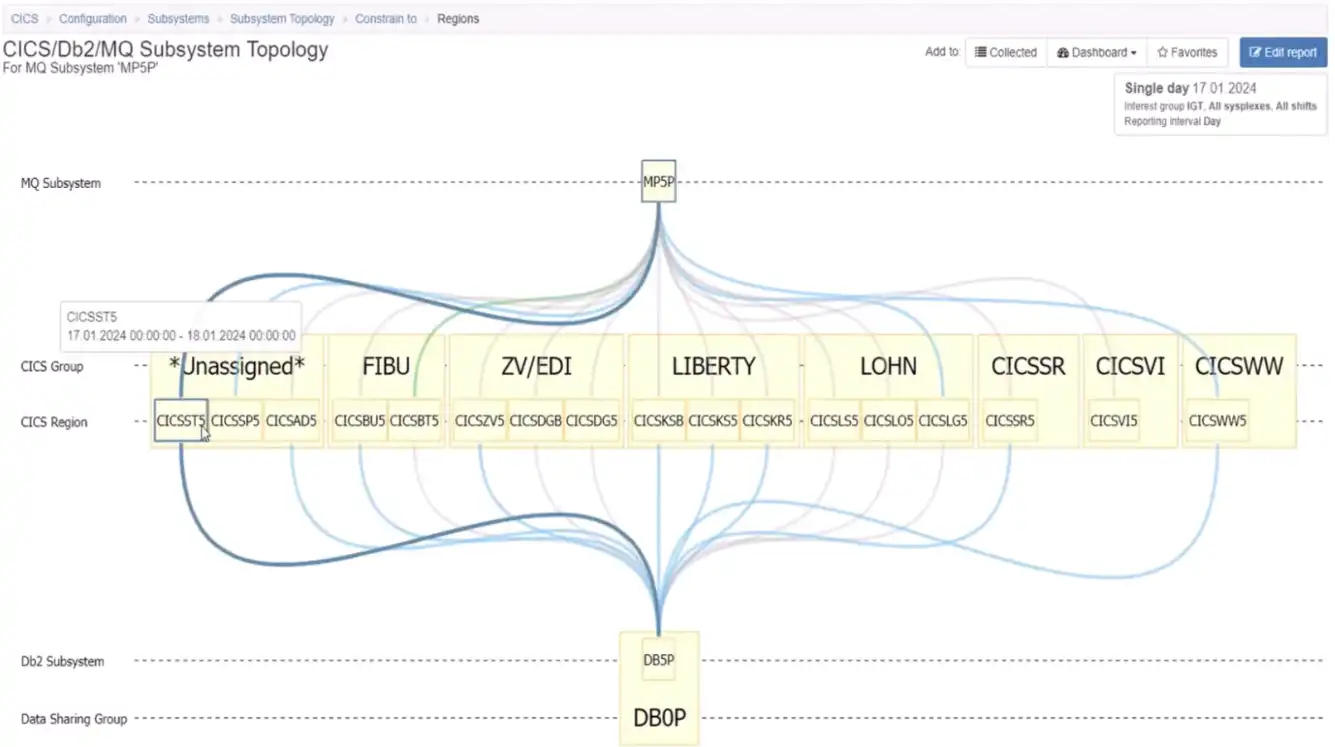
Figure 6: Topology Views Make it Easy to Identify and Isolate Naming Conventions
Subsystem Relationships with CECs and z/OS Systems
There can also be value in viewing relationships of CICS, Db2, and MQ in the context of their CEC and z/OS system relationships, as shown in Figure 7.
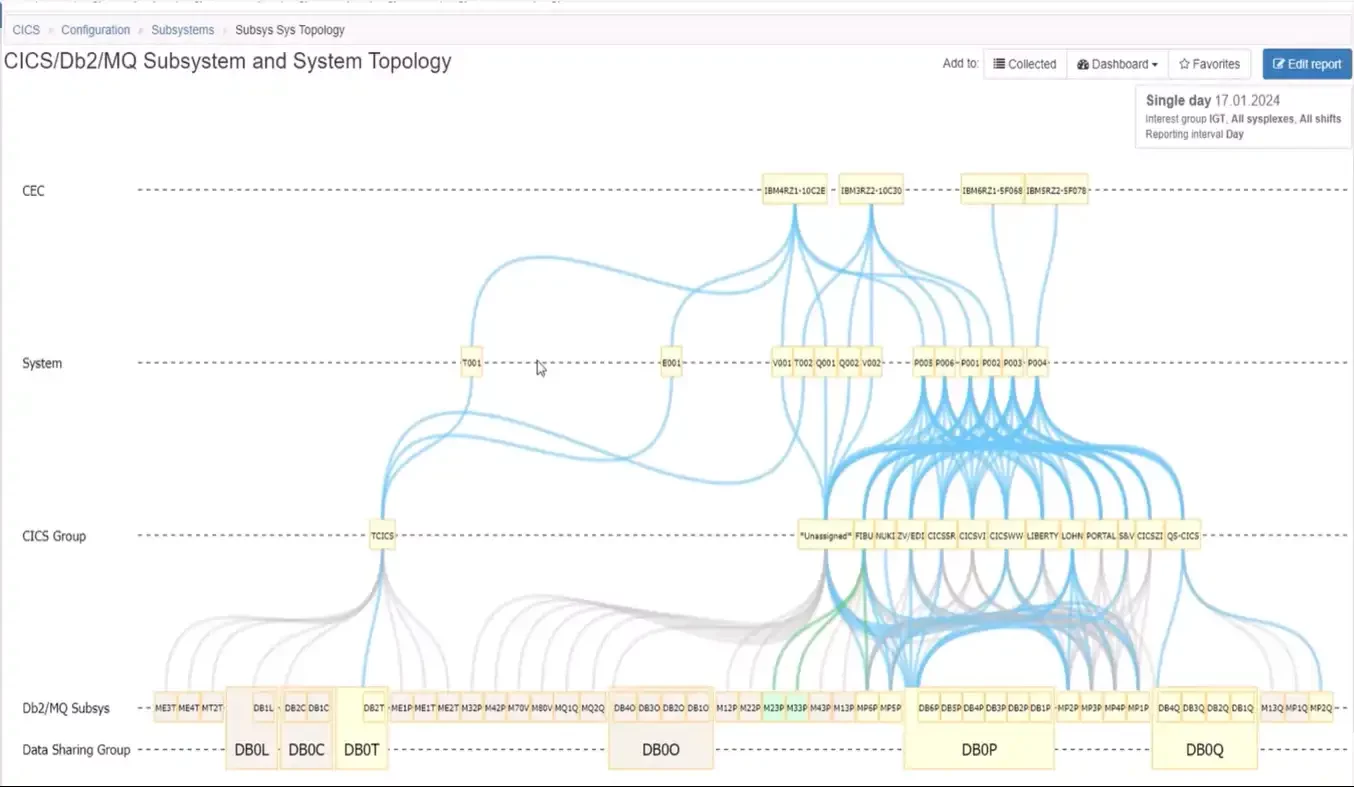
Figure 7: Viewing Subsystem Topology through CEC and System Relationships
Validate High Availability Design
Focusing the view on a selected CICS group, Figure 8 enables us to view the high availability design for that group. The four regions from this CICS group are distributed across four z/OS systems on four CECs.
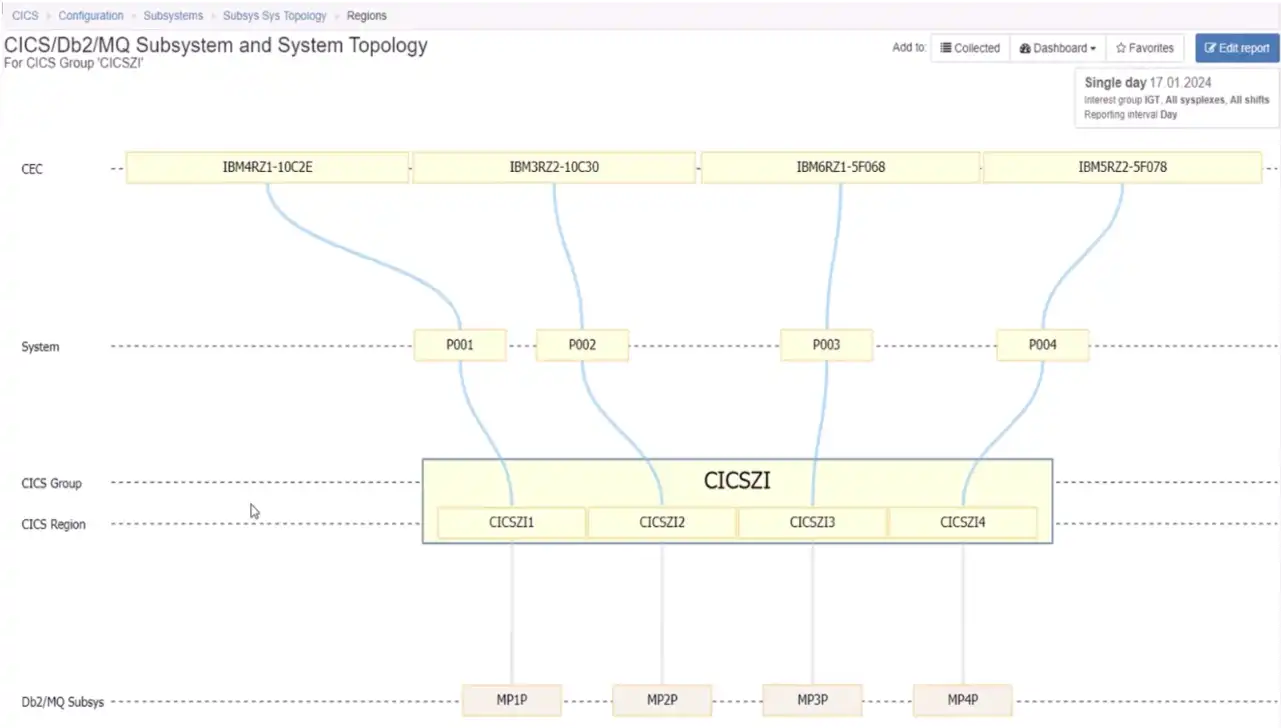
Figure 8: Topology Views Can Help Validate High Availability Design Objectives are Met
This view validates a configuration that is likely to deliver on the design objective that only about 25% of available capacity is ever lost no matter what component fails anywhere throughout the stack.
Examine Impact of Maintenance Downtime
Another common use case is to examine the scope of impact of downtime for maintenance on a given system. The view reflected in Figure 9 makes this immediately apparent for the system identified in the title.
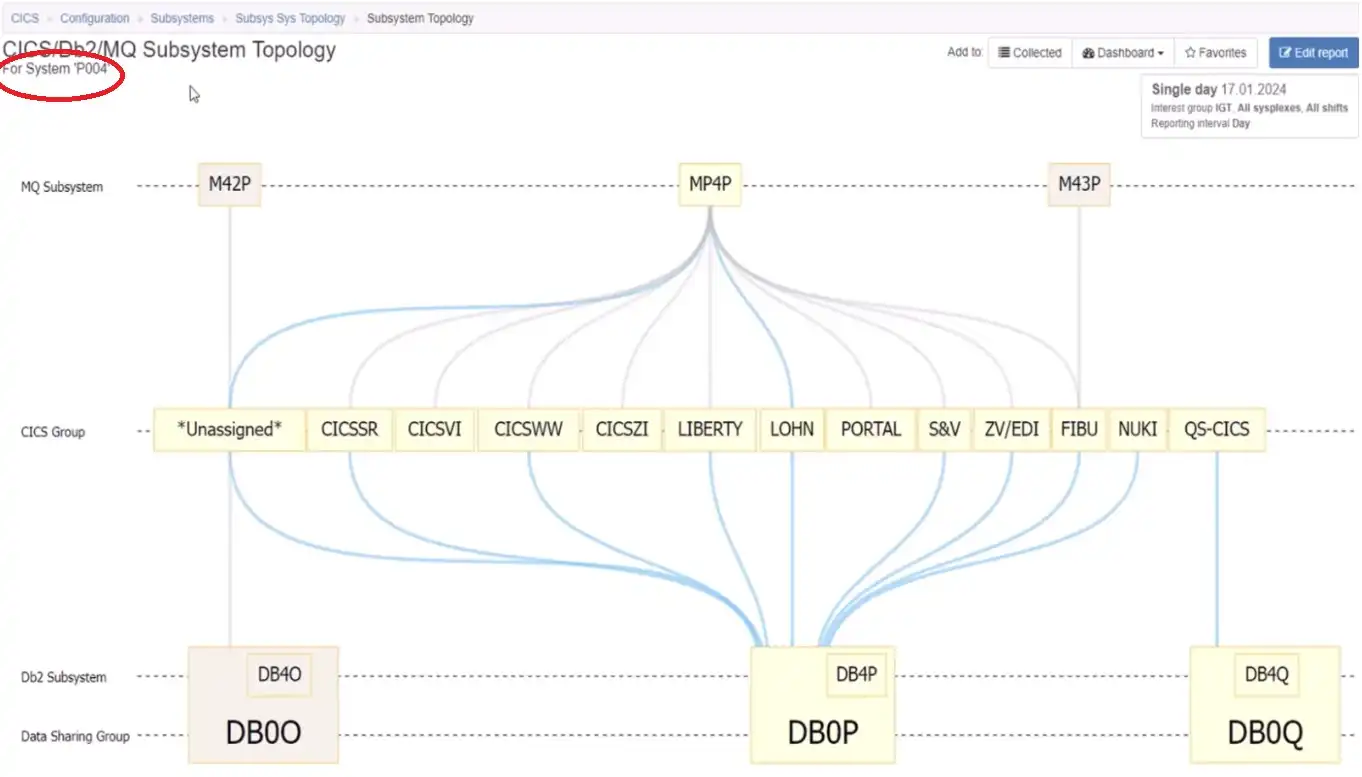
Figure 9: Topology Views Indicate Components that Would be Affected by System Downtime
From there, we could proceed to identify the CICS regions from one of the groups that would be impacted by scheduled downtime on that z/OS system.
Viewing CICS Transactions
The next step down the stack is to move from CICS groups and regions into transactions that are executing in a selected group, such as in Figure 10 below.
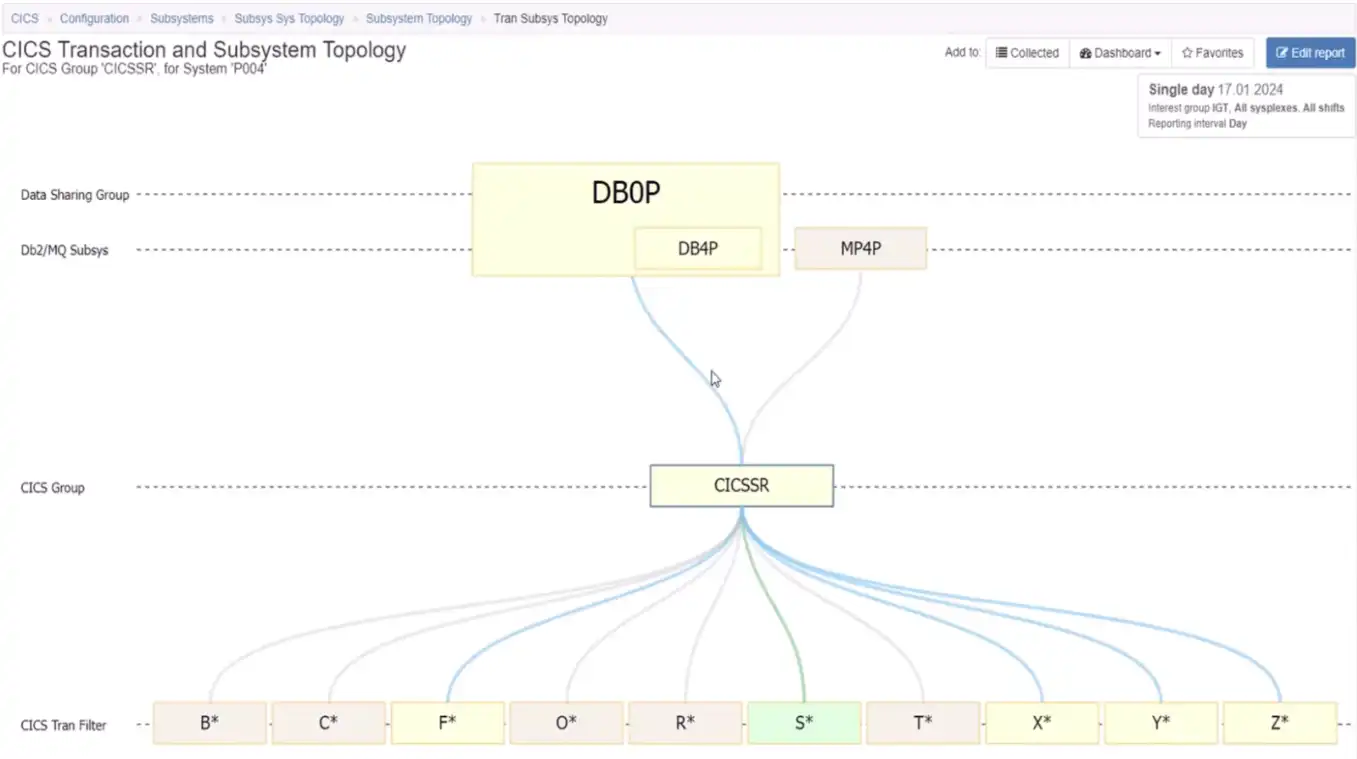
Figure 10: Identify Which CICS Transactions Execute in a Specific Group
Since we may expect this scope to include many distinct transaction IDs, this view begins by grouping the transactions by the first letter of the ID. From here we might want to expand that to the transaction IDs that begin with “X”, as seen in Figure 11 below.
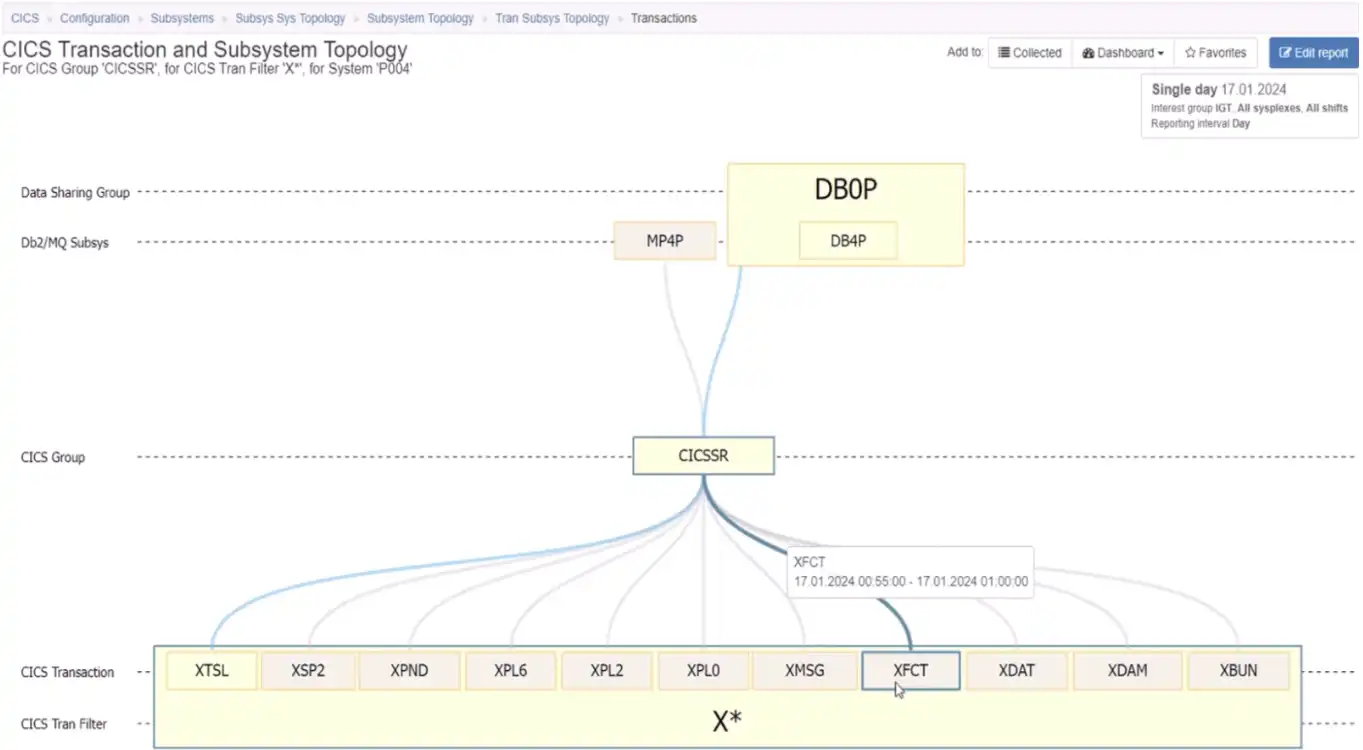
Figure 11: Isolating CICS Transactions that Begin with the Letter “X”
From there, we could expand the group and identify the CICS region, the Db2 member and the MQ queue manager that support the selected transaction on this selected system seen in Figure 12 below.
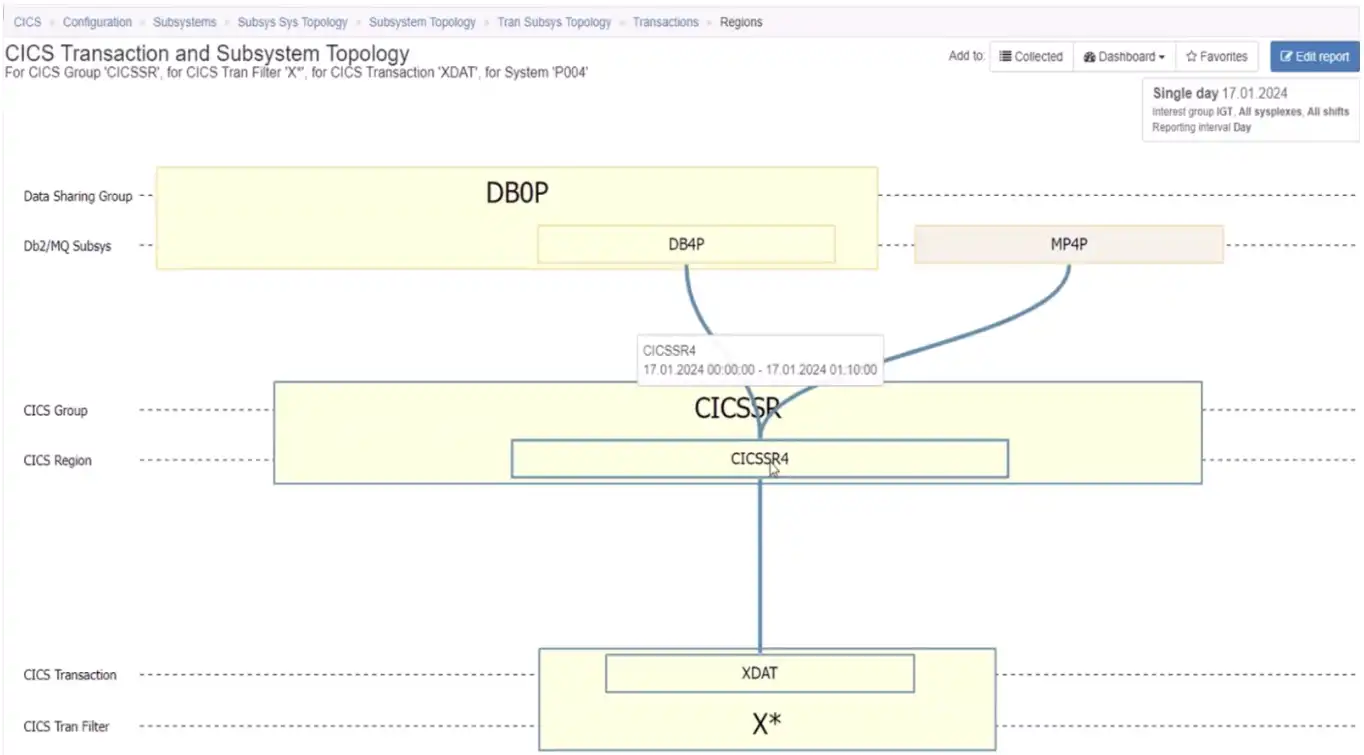
Figure 12: Visualizing the Full Stack Connections of a Specific CICS Transaction
From here we might choose to remove the system constraint and view the topology for this transaction as it executes across many regions in the group, along with their associated Db2 members and MQ queue managers.
Subsystem Topology Views Enable Faster Analysis and Understanding
Far from the days of manually taping topology views onto a wall to view subsystem connections, interactive Topology Views such as those in IntelliMagic Vision for z/OS offer analysts a wide array of views enhancing understanding of their system and subsystem configurations.
This ultimately enables us to:
- visualize the connections between CICS regions and associated Db2 and MQ subsystems
- visualize the relationships with supporting CECs and z/OS systems
- provide specifics down to the CICS transaction ID level
The video below demonstrates the z/OS Subsystem Topology Viewer in action. Feel free to contact one of our experts to set up a custom demonstration for your site. Or continue exploring with resources below.

This article's author
 Todd Havekost
 Share this blog
You May Also Be Interested In:
What's New with IntelliMagic Vision for z/OS? 2024.2
February 26, 2024 | This month we've introduced changes to the presentation of Db2, CICS, and MQ variables from rates to counts, updates to Key Processor Configuration, and the inclusion of new report sets for CICS Transaction Event Counts.
What's New with IntelliMagic Vision for z/OS? 2024.1
January 29, 2024 | This month we've introduced updates to the Subsystem Topology Viewer, new Long-term MSU/MIPS Reporting, updates to ZPARM settings and Average Line Configurations, as well as updates to TCP/IP Communications reports.
Top 10 IntelliMagic Vision Features Released in 2023
With over 160 announced product updates, 2023 was a spectacular year of releases for users of IntelliMagic Vision for z/OS. In this blog we try to narrow it down to the 10 most popular, helpful, and groundbreaking.
Book a Demo or Connect With an Expert
Discuss your technical or sales-related questions with our mainframe experts today