
With over 160 announced product updates, 2023 was a spectacular year of releases for users of IntelliMagic Vision for z/OS. Between the release of our latest module (zOS Connect), breakthrough releases on the topology viewer, and countless more, we delivered a lot in the last year!
Pushing out major new features every month is a lot of work on our developers, but it’s also a lot of work on our users to keep track of everything new. In this blog, I’ll try to highlight some of the most popular, helpful, and groundbreaking 2023 IntelliMagic Vision for z/OS releases.
#10 New “Changes” tables to identify changes in the WLM policy and ZPARM definitions (12.10)
One of the first actions typically taken when trying to isolate a problem is to answer the question “what has changed?” Identifying these changes manually, particularly ones in the configuration, can be a very time-consuming task.
IntelliMagic Vision has historically contained built-in reports that identify changes in many areas including disk storage, CEC, and LPAR configurations. IntelliMagic Vision 12.10 added reports to identify changes in the system Workload Manager (WLM) policy, including goal type and settings, service class period duration, and other service class settings. Reporting was also added to identify changes for Db2 ZPARM settings in many areas including application, DDF, stored procedures, and thread settings.
#9 Count Fields Added for CICS Transaction Data (12.2)
The CICS Transaction (monitoring) data (SMF 110.1) combines timing data and counts into what it calls “clock” fields. Prior releases of IntelliMagic Vision provided access to the timing component of these fields enabling detailed response time analysis.
With IntelliMagic Vision version 12.2 the count fields are now also captured in a new “CICS Transaction Clocks” data source. This release allows users to perform advanced CICS transaction analysis requiring access to both timing and count fields.
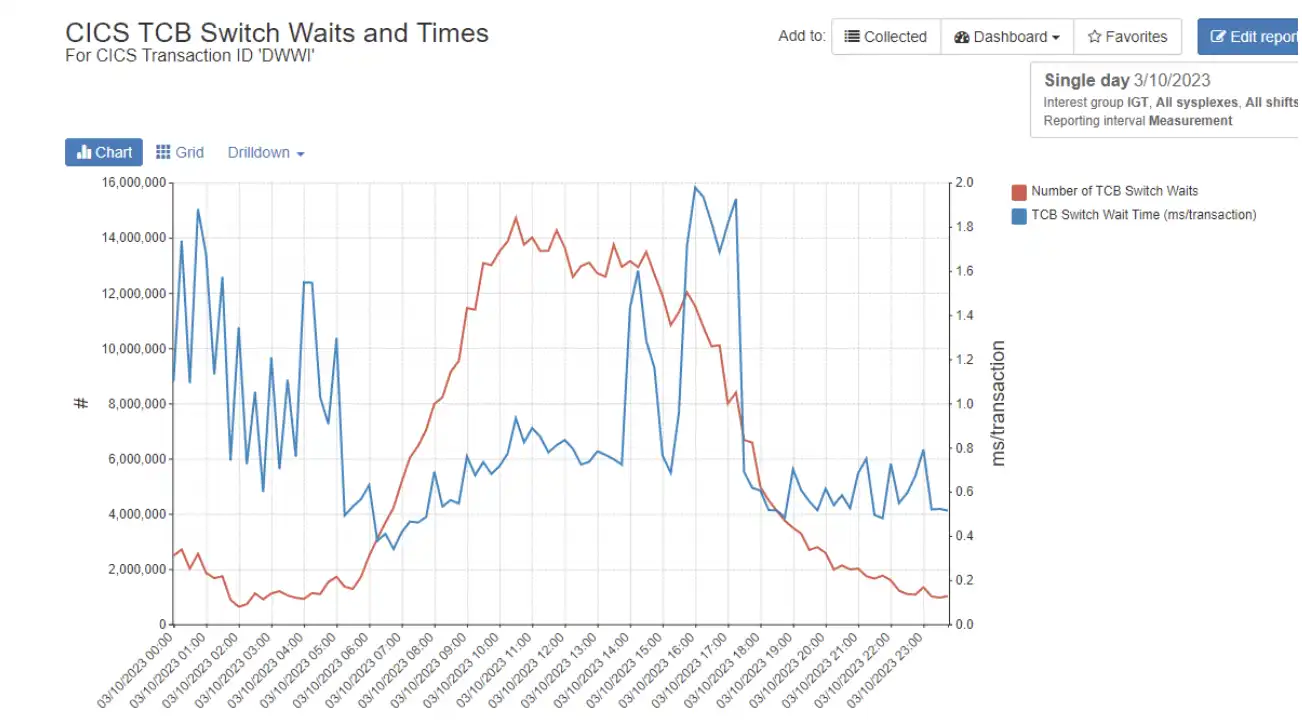
CICS TCB Switch Waits and Times report in IntelliMagic Vision
#8 Organize Shared Dashboards Into Folders (12.3)
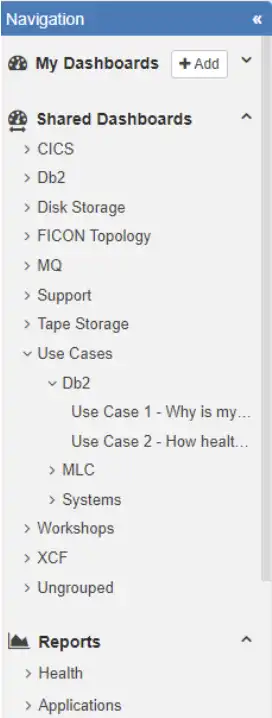
After the 2020 introduction of Personal Dashboards, it is now common for sites to have dozens if not hundreds of personally customized dashboards shared across their user communities. With version 12.3, users can now organize shared dashboards for all users into folders and sub-folders.
Authorized users can group dashboards into a multi-level folder-like structure to enhance ease of locating desired dashboards for users across their company. Users assigned the “Dashboard Group Administrator” role will be able to create, change, and remove shared groups and populate dashboards into those groups.
The capability to organize shared dashboards for users across the organization represents another major step forward enhancing the power and usability of dashboards and thus the analytical effectiveness of IntelliMagic Vision users.
#7 Interactive Sysplex Topology Viewer (12.8)
Following the FICON Topology Viewer, IntelliMagic Vision 12.8 expanded the graphical topology displays with a new Sysplex Topology view.
The Interactive Sysplex Topology Viewer presents the z/OS systems in your environment and identifies on which CEC they reside and to which sysplex they belong. Easy visibility into these system relationships are helpful to everyone on teams that manage the z/OS environment, particularly for staff who only occasionally require this information and whose previously printed reference documents quickly become out of date.
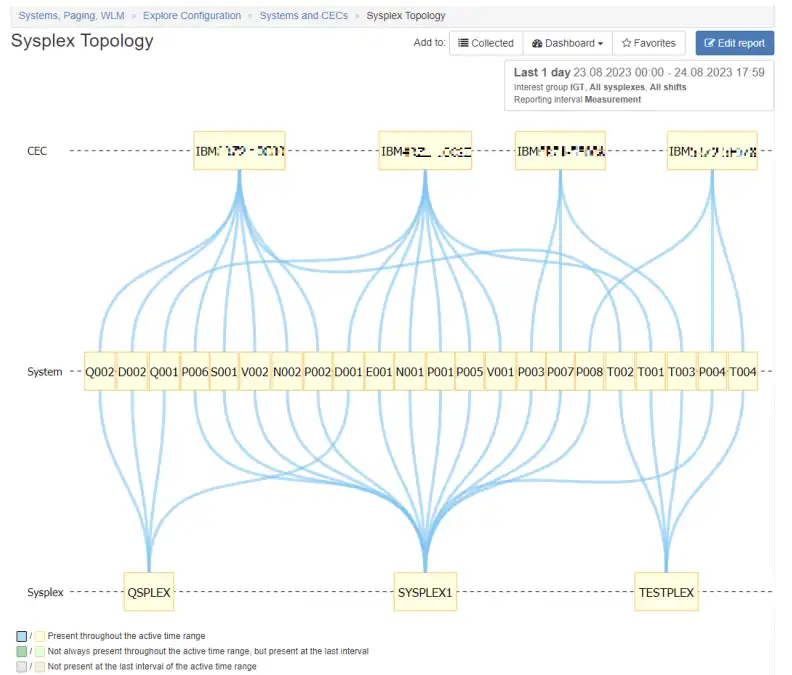
Sysplex Topology Viewer in IntelliMagic Vision
#6 Live-Edit SMF Field Name Mapping (12.1)
IntelliMagic Vision has long supported the ability to no-code and live-edit reports directly in our GUI. With the release of 12.1 IntelliMagic Vision provides the capability to reference and add variables by the SMF field names found in IBM documentation, significantly enhancing analysis capabilities and explainability. This enables users to easily identify and investigate potential correlations with other variables that involve specific SMF field names in their calculations.
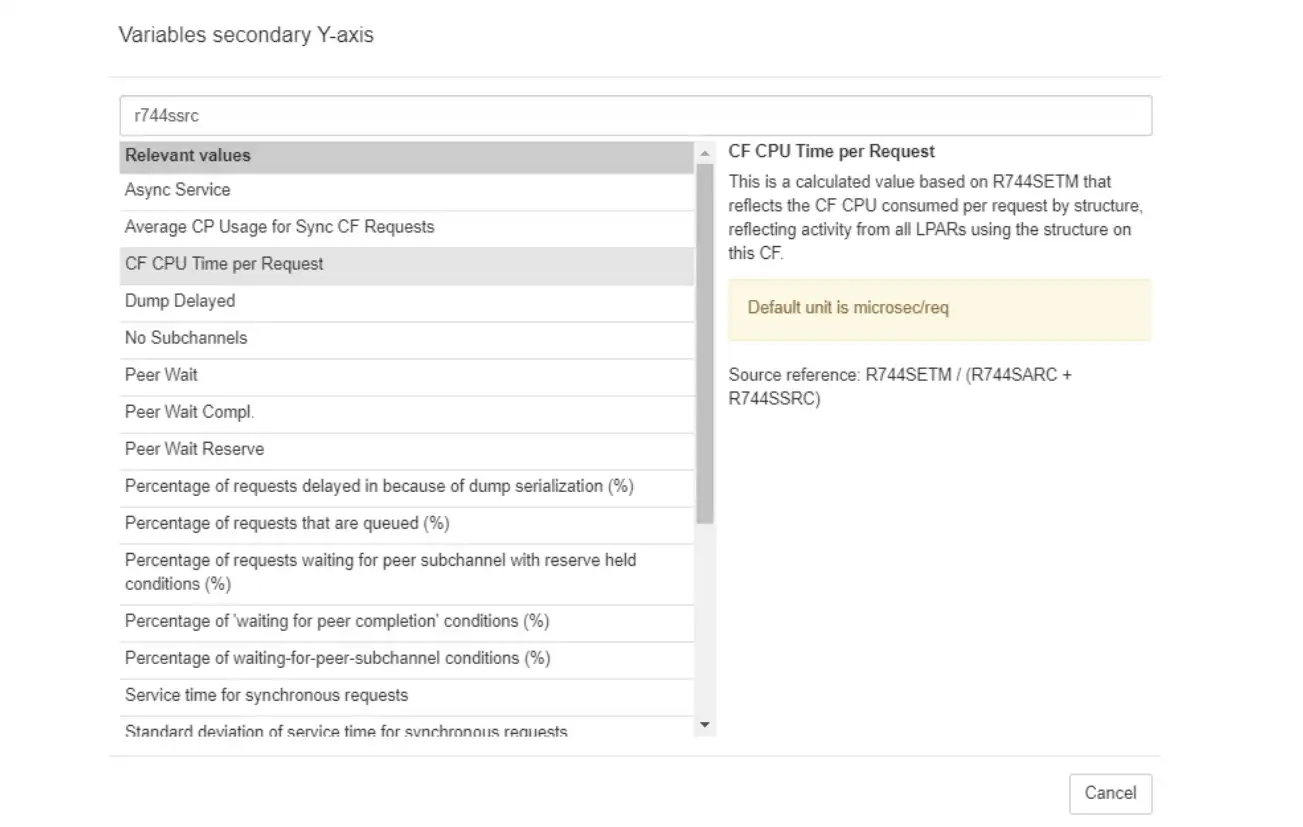
Searching by SMF field name under Variables displays all other variables utilizing that SMF field
Learn more about SMF Field Name Mapping and view demo
#5 Shareable Dashboard Templates (12.0)
IntelliMagic first released a Dashboard Sharing feature in 2020, allowing users within the same organization to share their custom dashboards with one another – a feature that was widely popular and heavily used.
With our 12.0 release, we released the Shareable Dashboard Templates feature. This allows users to save and export their custom dashboards as a template and import dashboards shared by others.
IntelliMagic Vision customers who take advantage of IntelliMagic’s expert consultants for daily monitoring, health assessments, and other standalone services will benefit from the ability to easily import dashboards used by our consultants (rather than recreating them manually) and continue using them well after a service engagement or consultation ends. Customer sites that have multiple on-premises Web Reporters will also find much use out of this latest feature.
IntelliMagic Consultant, Jack Opgenorth, used this feature to develop and share reports among customers, and prospects to highlight obsolete cipher use as defined by the NIST (National Institute of Standards and Technology) Risk Management Framework.
With the launch and release of shareable Dashboard Templates, IntelliMagic hopes to continue closing the knowledge gap of z/OS performance analysts and make it possible to quickly share best practice information from worldwide experts in the field.
Learn more about Shareable Dashboard Templates
#4 Interactive FICON Topology Viewer (12.5)
Having an accurate picture of FICON topology is essential for identifying configuration errors or sub-optimal configuration within the z/OS infrastructure. With the release of 12.5, IntelliMagic Vision introduced an interactive FICON Topology Viewer.
Prior to this breakthrough release, mainframe analysts hoping to achieve an accurate picture of their FICON topology were forced to manually print out their topology and then tape it to a wall. This process was necessary to visually evaluate the FICON configuration and spot errors when software was not advanced enough to do it for the analysts.
IntelliMagic Vision users are now able to save countless hours of manual examination in their analysis with this automatic visualization and error highlighting. Using the FICON Topology Viewer, performance analysts can now visualize, and interact with, their entire FICON infrastructure.
IntelliMagic consultant and IBM Distinguished Engineer, Joe Hyde, uses the FICON topology viewer to: Conduct root cause analysis of channel activity imbalance within a channel path group, Identify changes to the channel infrastructure, and Identify if tape and disk have their own FICON channels or not
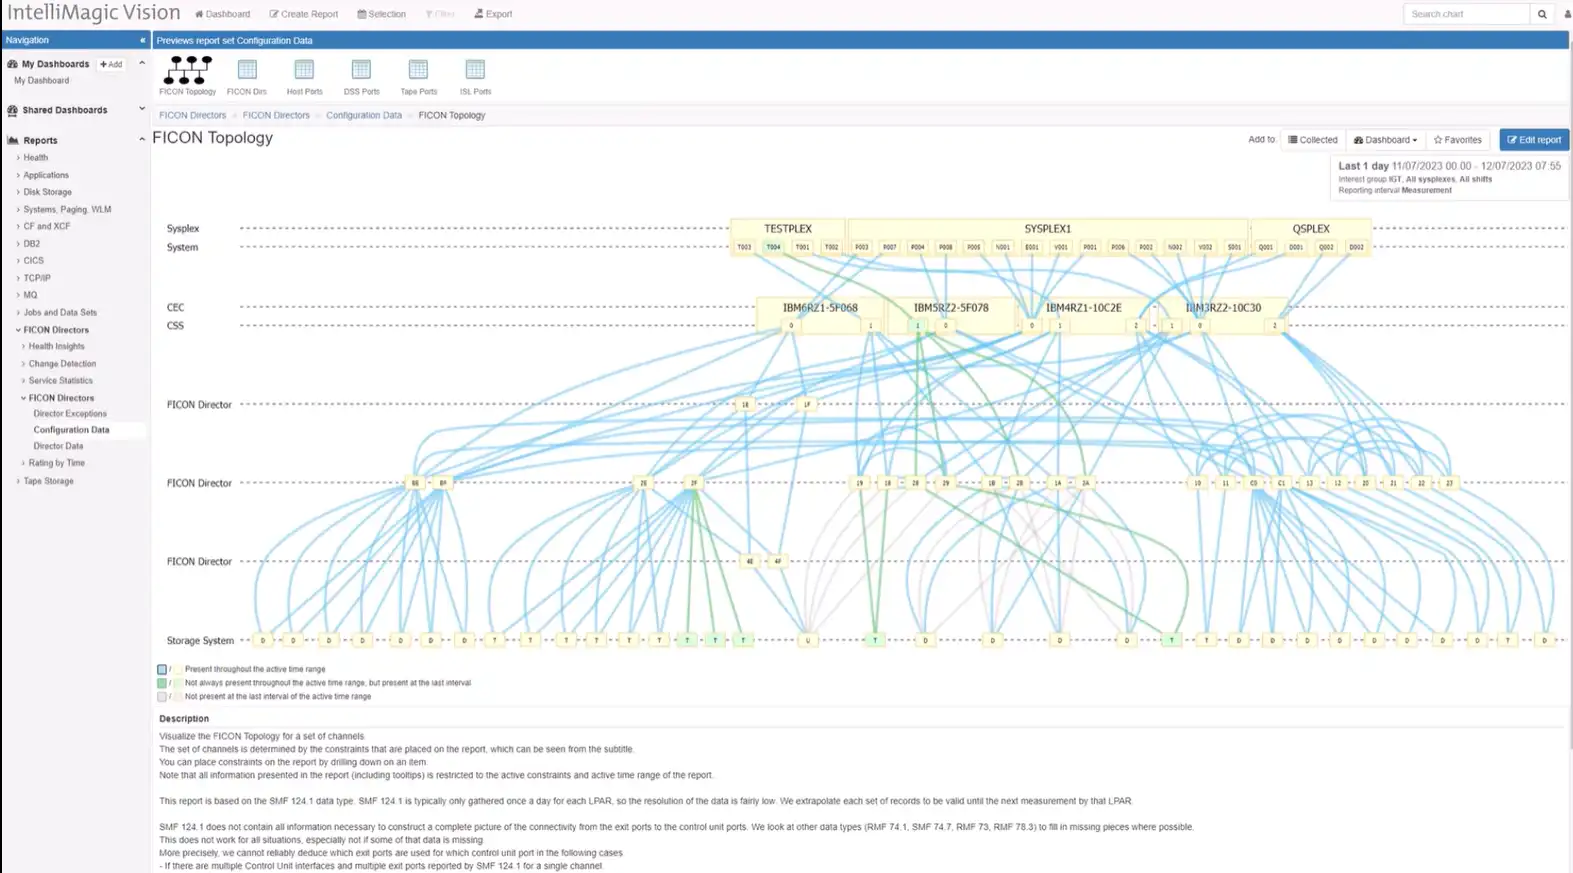
Interactive FICON Topology report in IntelliMagic Vision
Learn more about the Interactive FICON Topology Viewer and view demo
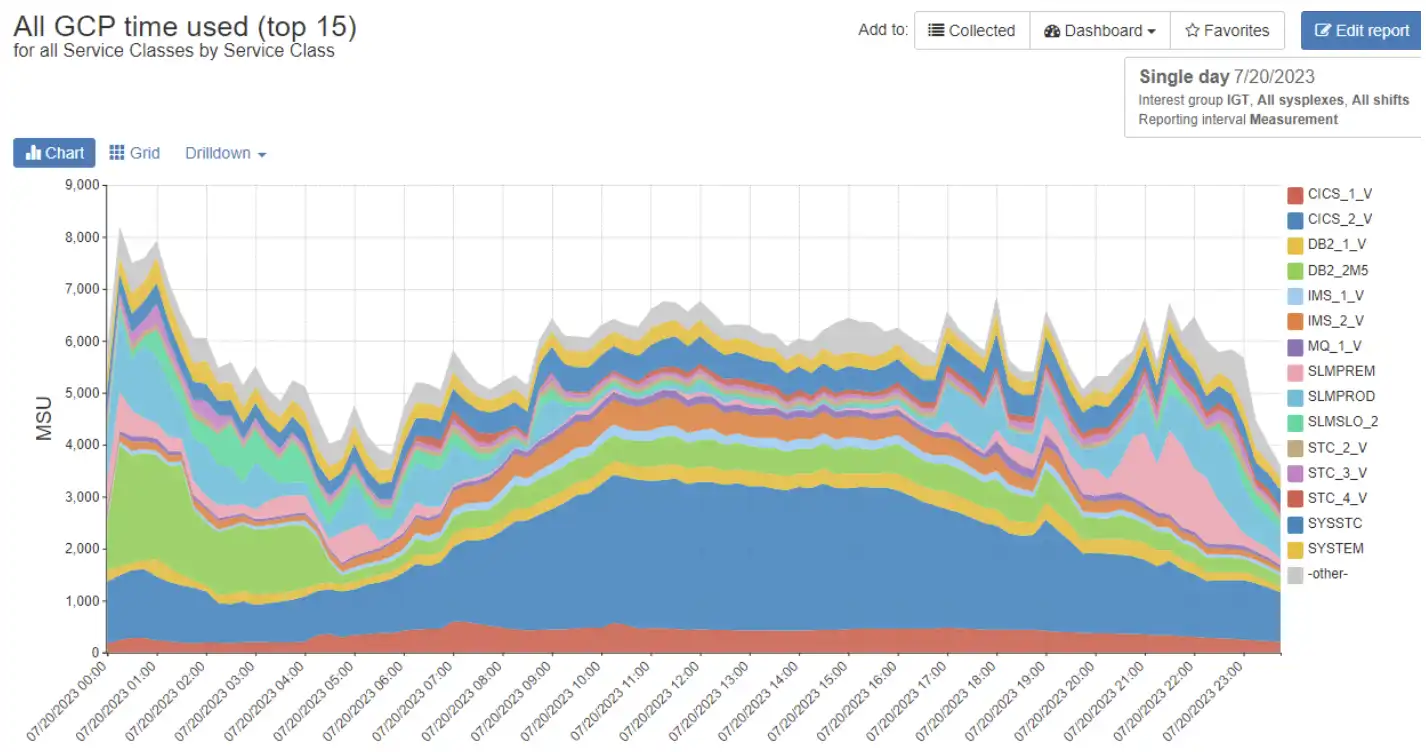
#3 “Other” Series (12.7)
To facilitate effective reporting on metrics with many discrete values, IntelliMagic Vision supports a “Top N” capability to select the top values sorted by a user-specified metric. Users viewing “Top N” reports may also be interested in understanding the extent to which the displayed values represent the total. In some cases, the displayed “Top N” values may capture most of the activity, while in other situations it may reflect only a fraction of the total.
IntelliMagic Vision 12.7 provides the capability to display the sum of all “Other” values not represented in the “Top N”. Users may set “Other series” to be “On” for a given report in the “Edit report” interface, as shown here.
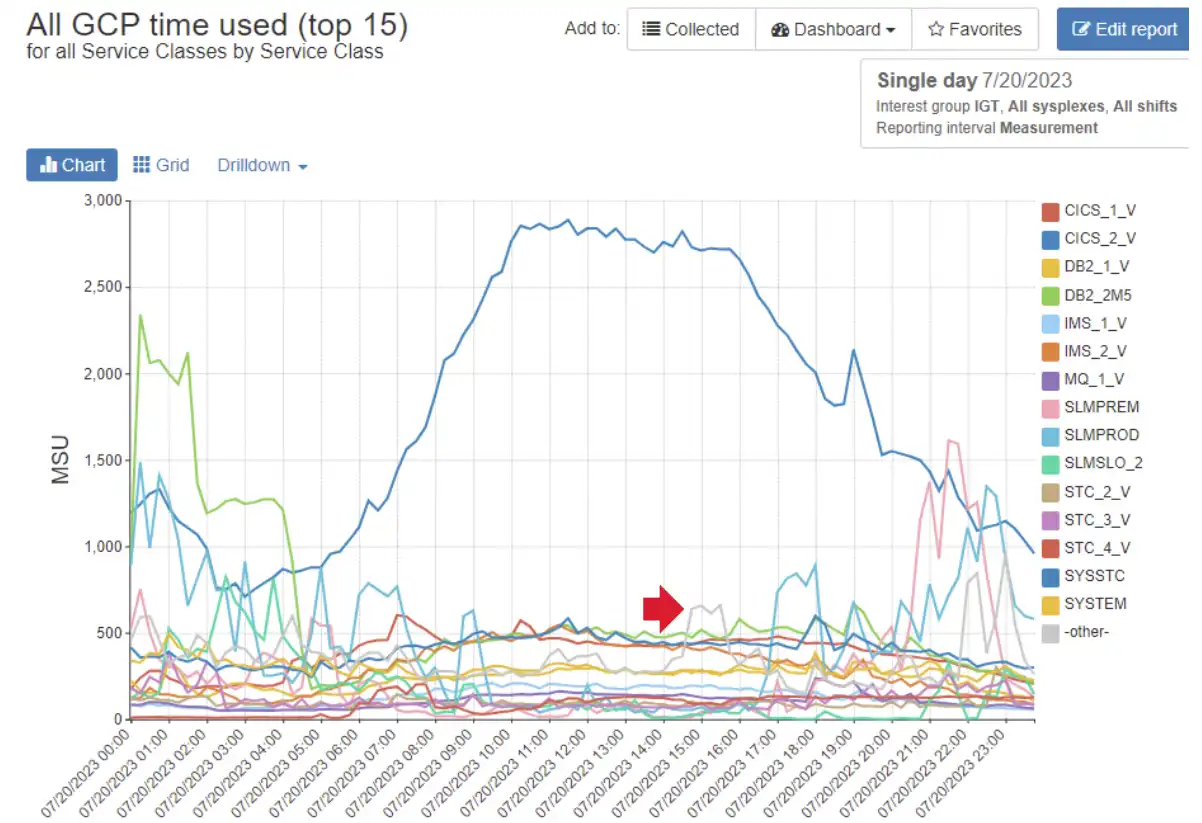
Sample reports where “Other” has been specified appear below. In the first case of CPU usage by the top 15 service classes, the “Top N” values reflect most of the CPU, with a narrow gray area across the top of the chart indicating the CPU consumption by all remaining service classes.
Even though the overall CPU consumption of the “Other” service classes is relatively minor, viewing this data as a line chart shows that cumulatively they do consume more CPU than all but one service class in multiple intervals around 1500.
There may be situations where an analyst suspects the “Top N” represents a small fraction of the total and thus may want to quantify the cumulative “Other” values. Such is the case in this second example below of top 15 CPU consuming address spaces, where most of the CPU is consumed by address spaces that fall outside the top 15 and thus are not listed on the report.
#2 zOS Connect (12.9)
IntelliMagic Vision release 12.9 added support for z/OS Connect, adding IntelliMagic Vision’s world-leading end-to-end mainframe analytics capabilities to API calls and back-end services.
A key aspect of mainframe modernization efforts in recent years has been to provide access to business-critical data and applications on z/OS to cloud, mobile, and other off-platform applications. In today’s world that access is typically enabled through APIs (Application Programming Interfaces), with z/OS Connect serving as the gateway.
IntelliMagic Vision’s support for z/OS Connect now enables IT teams to manage and optimize their mainframe API environment, and to profile the requests coming into the system. This is essential for management reporting and resource planning.
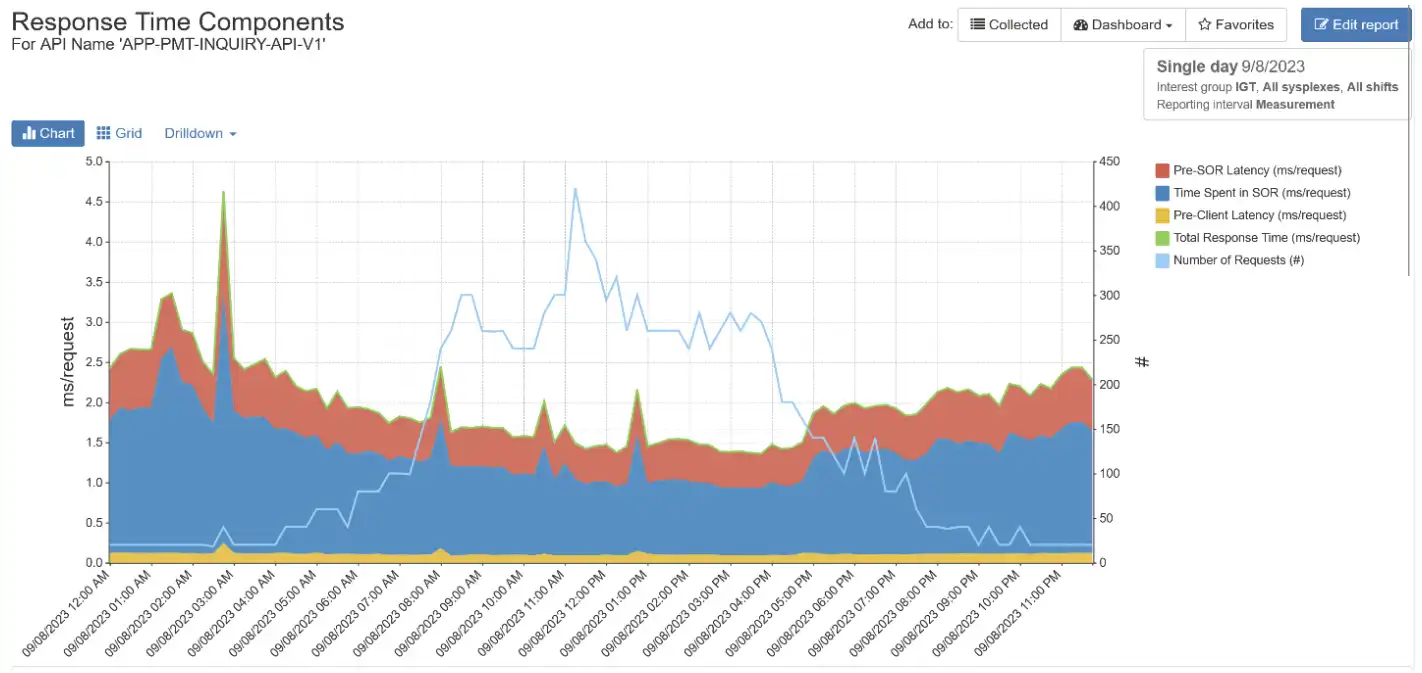
z/OS Connect Response Time Components report in IntelliMagic Vision
Learn more about IntelliMagic Vision for z/OS Connect
#1 Interactive Subsystem Topology Viewer (12.10)
Within the z/OS mainframe, CICS, Db2, and MQ are three vitally important components that often work together to support the processing of business applications and data. With the release of 12.10, IntelliMagic Vision introduced our interactive z/OS Subsystem Topology Viewer. This new release provides the same support as our other interactive topology viewers, and offers an easy and interactive way to analyze subsystem connections.
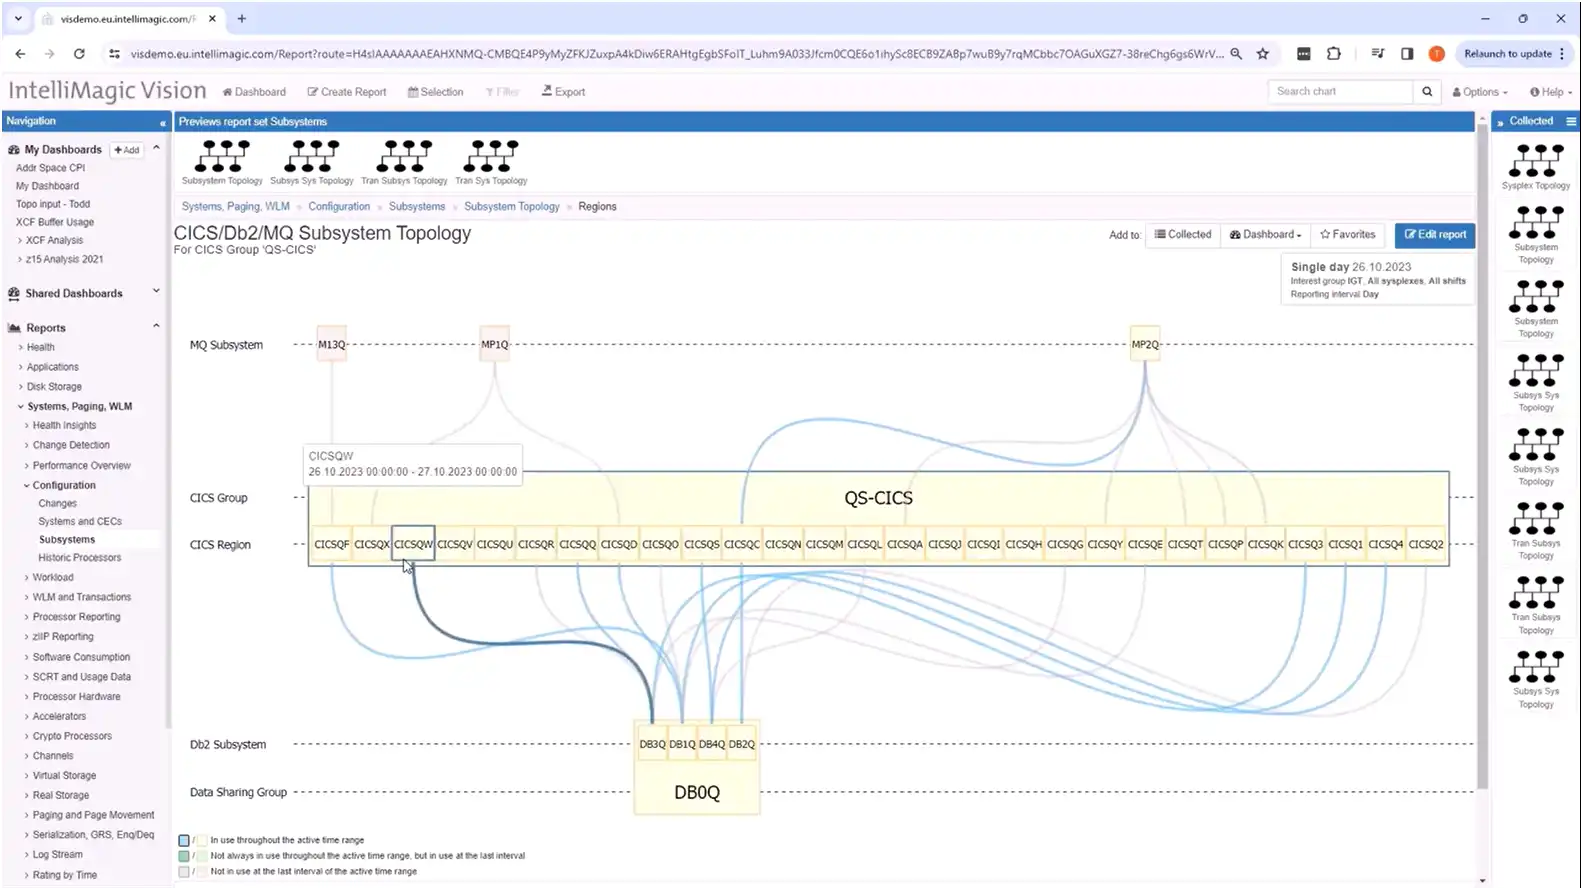
CICS/Db2/MQ Subsystem Topology Viewer in IntelliMagic Vision
The new Subsystem Topology Viewer helps analysts identify the relationships between subsystems, their supporting CECs and z/OS systems, and even down to CICS region levels.
Learn more about the Interactive z/OS Subsystem Topology Viewer and view a demo
A Whirlwind Year of Mainframe Performance Enhancements
And there we have it – 160 announced product updates boiled down to a top-10! As 2024 gets off to a great start, we hope you’re taking advantage of the full range of features available to you within IntelliMagic Vision for z/OS to make your lives easier and your analysis more fruitful.
Please never hesitate to reach out to us about enhancements you want to see added to IntelliMagic Vision, or for custom demos of any of our features.
If you aren’t yet a user of IntelliMagic Vision, feel free to get in touch with one of our technical or sales experts to answer all of your questions.
This article's author
 Morgan Oats
 Share this blog
You May Also Be Interested In:
What's New with IntelliMagic Vision for z/OS? 2024.1
January 29, 2024 | This month we've introduced updates to the Subsystem Topology Viewer, new Long-term MSU/MIPS Reporting, updates to ZPARM settings and Average Line Configurations, as well as updates to TCP/IP Communications reports.
What's New with IntelliMagic Vision for z/OS? 2024.2
February 26, 2024 | This month we've introduced changes to the presentation of Db2, CICS, and MQ variables from rates to counts, updates to Key Processor Configuration, and the inclusion of new report sets for CICS Transaction Event Counts.
Viewing Connections Between CICS Regions, Db2 Data Sharing Groups, and MQ Queue Managers
This blog emphasizes the importance of understanding connections in mainframe management, specifically focusing on CICS, Db2, and MQ.
Book a Demo or Connect With an Expert
Discuss your technical or sales-related questions with our mainframe experts today