
In normal situations our two eyes work together to provide the many facets of visibility we typically take for granted. If a setback occurs that causes the loss of sight in one eye, studies show this negatively impacts our ability to accurately track moving objects, judge distances, and perceive depth.
The mainframe produces via SMF data an incredibly rich set of metrics far superior to other infrastructure platforms. The great potential for leveraging this data to enhance availability and performance is widely recognized, but unfortunately many sites face major challenges as they seek to realize that potential value.
One of these challenges arises from the widespread use of analytical tooling that is siloed across the components of the z/OS platform. Commonly, each infrastructure team uses specialized tooling unique to their area that has its own formidable learning curve and creates barriers to cross-team collaboration and learning.
One undesirable outcome of this patchwork of tooling is that each area analyzes a situation looking only at the SMF data type generated by their component using the analytical product unique to their area. Any insights into this situation that could be provided from other SMF data types are not directly available to them. They are limited to “tossing questions over the wall” to other areas for them to analyze other SMF data types using tooling specific to that discipline.
One way to describe this (paralleling the introductory analogy of vision) is that in this scenario SMF data is being viewed “with one eye.” The effectiveness of analysis is negatively impacted by the inability to leverage potential insights available from complementary data types. But a common, intuitive, integrated interface that provides visibility across the many types of SMF data can overcome that obstacle by giving all teams access to the insights provided by components across the entire z/OS platform.
This is the first in a series of blogs identifying real-life scenarios where analytical effectiveness is greatly enhanced by having easy visibility into insights derived from multiple types of SMF data. This first example will involve WLM service class goal (RMF 72.3) and CICS transaction (SMF 110.1) data.
View 1: WLM Perspective
RMF 72 records capture data at the Workload Manager (WLM) service class level, including the performance index (PI) reflecting the degree to which a service class is meeting its goal. A PI less than 1 indicates the service class is exceeding its goal.
Figure 1 shows a CICS service class where response times are much faster than the WLM goal for most of the day but fail to achieve the goal during a few intervals around 7 PM.
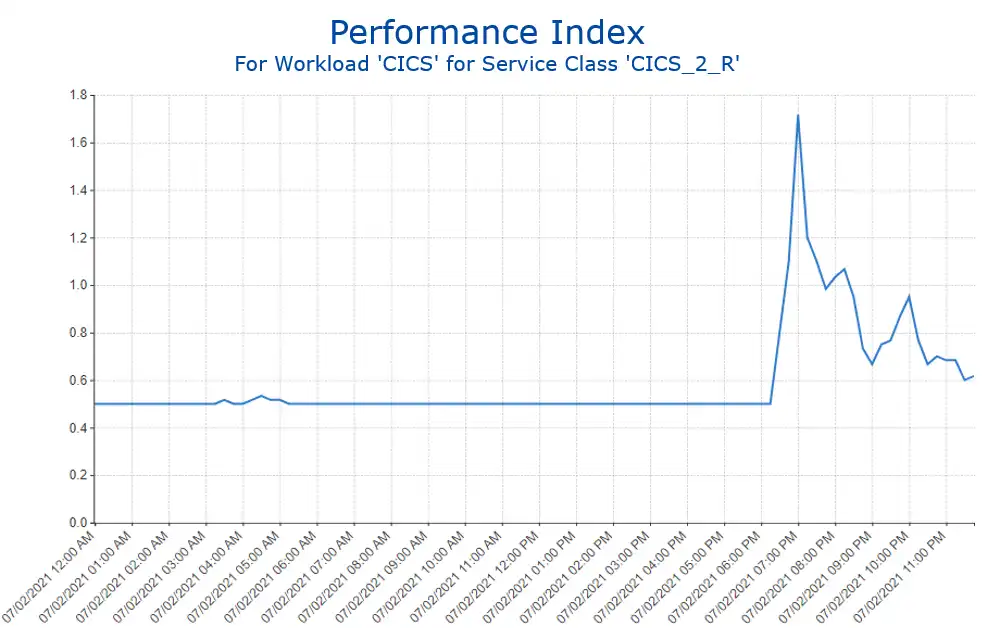
Figure 1: Performance Index
Examining the WLM data from a percentile view (Figure 2) shows that this service class has a goal of 90% of the transactions (light blue line) less than 325 milliseconds (orange line). For most of the day more than 90% of the transactions are completing within half of the goal (162 ms, red line), but for intervals around 7 pm the goal is not met as less than 90% of transactions are completing within the 325 ms goal (blue line and arrow).
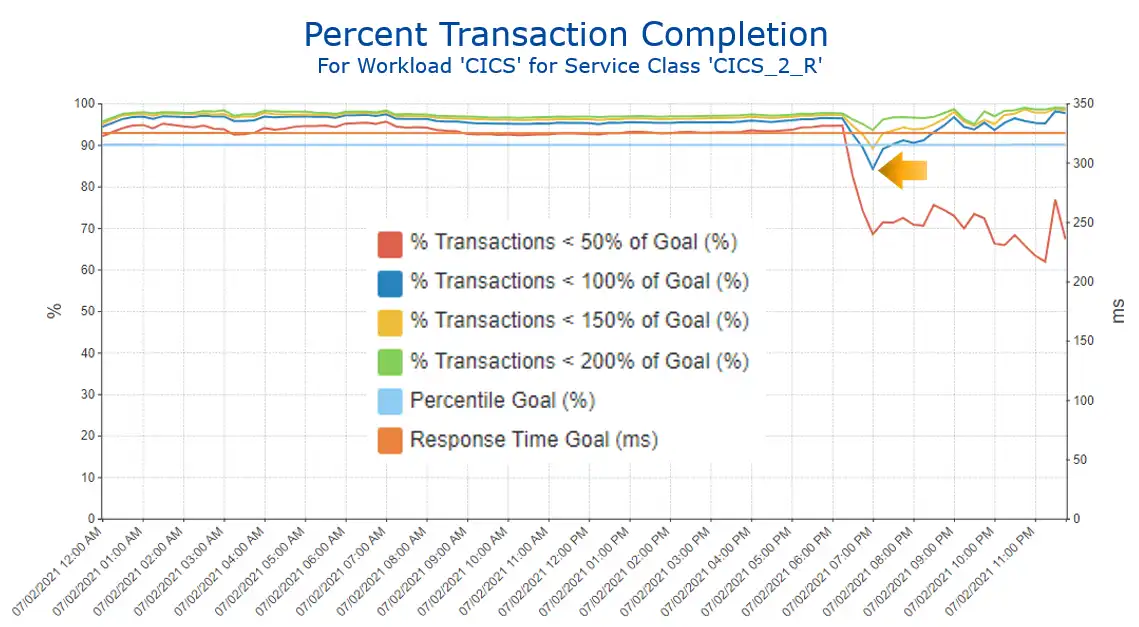
Figure 2: Percent Transaction Completion
At this point in the analysis, if the WLM team’s access is limited to RMF 72 data, a dead end has been reached. But if the team also has easy access to view CICS transaction data, analysis can proceed.
View 2: CICS Transaction Perspective
Since the WLM service class goal is 90% less than 325 ms, one logical starting point in viewing the CICS transaction data would be to identify any transactions with average response times that are typically longer than the 325 ms value from the goal. Figure 3 shows this to be the case for the first 3 transactions in the legend.
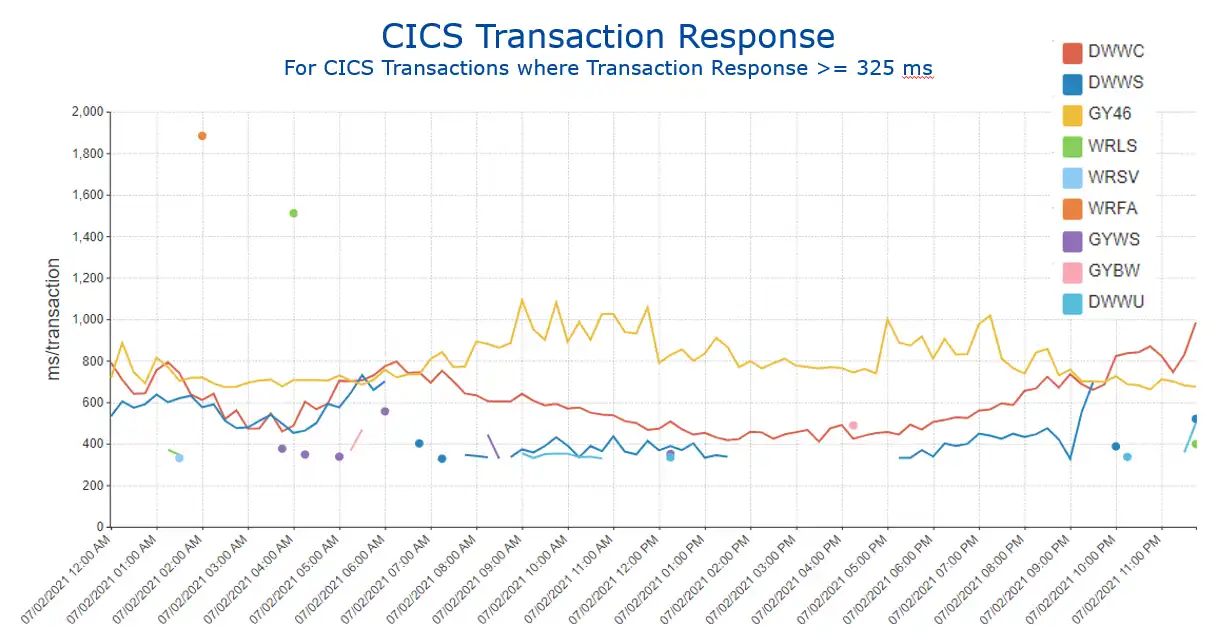
Figure 3: CICS Transaction Response: Transactions with average response time >= 325 ms
Viewing transaction rates over time while continuing to filter for transactions with average response times exceeding 325 ms (Figure 4) indicates a big spike in volume for one of those long running transactions (DWWS in red) coinciding with the 7 PM time frame when the WLM goal was being missed.
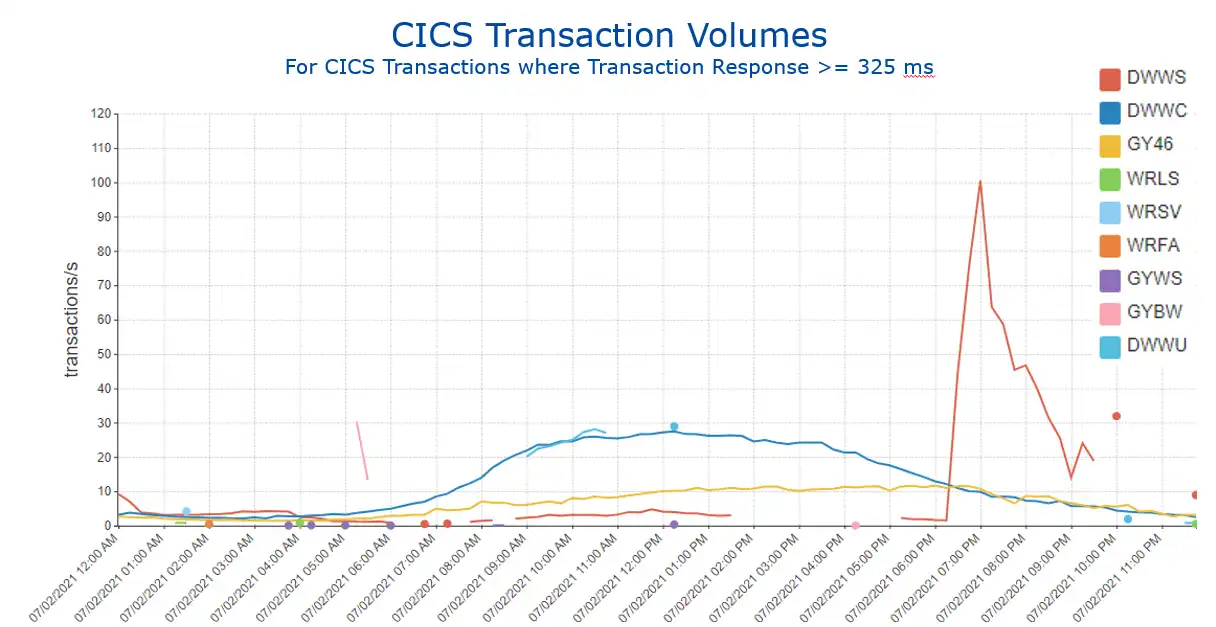
Figure 4: CICS Transaction Volumes: Transactions with average response time >= 325 ms
With this clue that transaction mix may be an important consideration, a likely next step would be to view the distribution for all transactions focusing on the time frame when the service class goal is not being achieved.
Figure 5 narrows the selection interval to only include 7 PM and the two adjacent intervals and presents the data in a pie chart. That DWWS transaction (in light blue with arrow) that characteristically runs longer than 325 ms makes up over 9% of the total transaction mix during this 45-minute time frame.
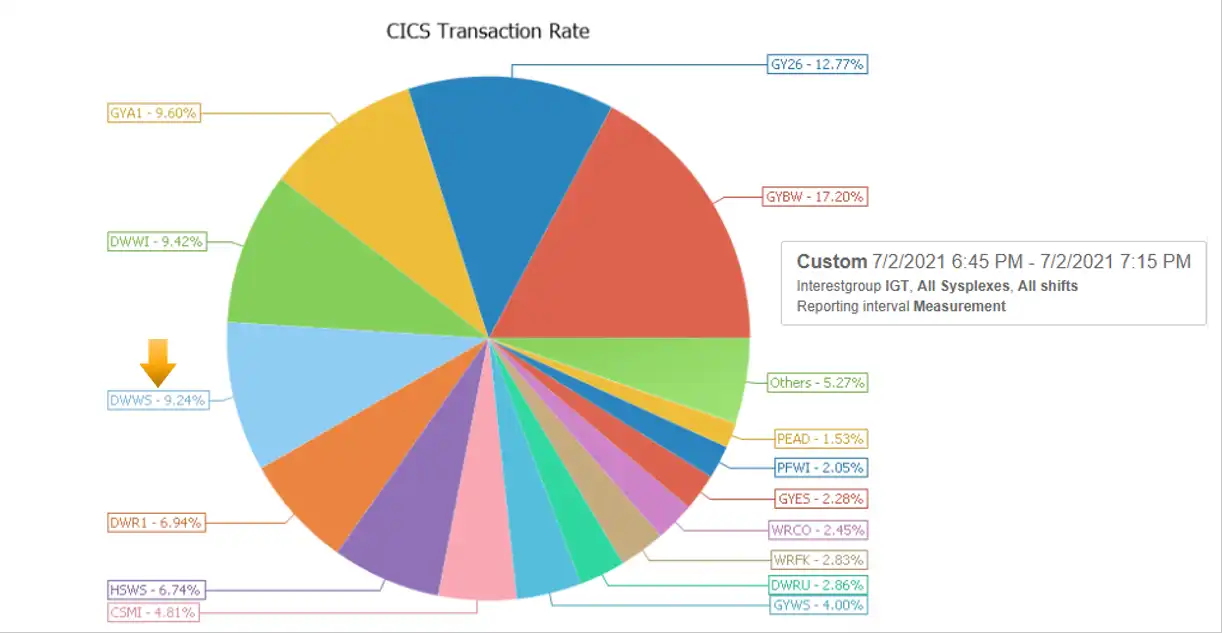
Figure 5: CICS Transaction Rate: Limited time interval
Exploring the CICS transaction data enables easy identification that the cause of missing the WLM goal is a dramatic shift in the transaction mix. It’s tough to make a 90% goal when the volume of a transaction that consistently runs longer than the goal represents almost 10% of the total volume.
Analysis Enhanced through Viewing Multiple Types of SMF Data
This use case illustrated how having a common interface across data types enhanced analysis by enabling collaboration between WLM and CICS teams to quickly identify the cause of missing a WLM goal.
Subsequent blogs in this series will provide examples of other real-life scenarios where visibility into insights derived from multiple types of SMF data enhances analysis by providing a more complete perspective into the operation of a z/OS environment.
The below video demonstrates the navigation involved in creating these views using IntelliMagic Vision.

This article's author
 Todd Havekost
 Share this blog
Related Resources
What's New with IntelliMagic Vision for z/OS? 2024.2
February 26, 2024 | This month we've introduced changes to the presentation of Db2, CICS, and MQ variables from rates to counts, updates to Key Processor Configuration, and the inclusion of new report sets for CICS Transaction Event Counts.
Viewing Connections Between CICS Regions, Db2 Data Sharing Groups, and MQ Queue Managers
This blog emphasizes the importance of understanding connections in mainframe management, specifically focusing on CICS, Db2, and MQ.
What's New with IntelliMagic Vision for z/OS? 2024.1
January 29, 2024 | This month we've introduced updates to the Subsystem Topology Viewer, new Long-term MSU/MIPS Reporting, updates to ZPARM settings and Average Line Configurations, as well as updates to TCP/IP Communications reports.
Book a Demo or Connect With an Expert
Discuss your technical or sales-related questions with our mainframe experts today