
How do you make Enterprise SAN performance, capacity and availability approachable for the Operations teams? You start by simplifying complex relationships between the VMware guests, associated fabric connections and external storage and summarizing the overall health into a few simple to understand dashboards. You then display the important information on these dashboards: one for VMware and hosts, one for SAN fabric and one for storage systems.
In a Network Operations Center (NOC), it is popular to have large monitors display the latest health of the environment. The dashboards provide easy to understand and actionable warnings and exceptions when issues arise in the environment.
NOC dashboards can be customized and set up for different teams that focus on their primary areas, or for the same team wanting to keep track of multiple areas of the infrastructure.
The Storage NOC Dashboard
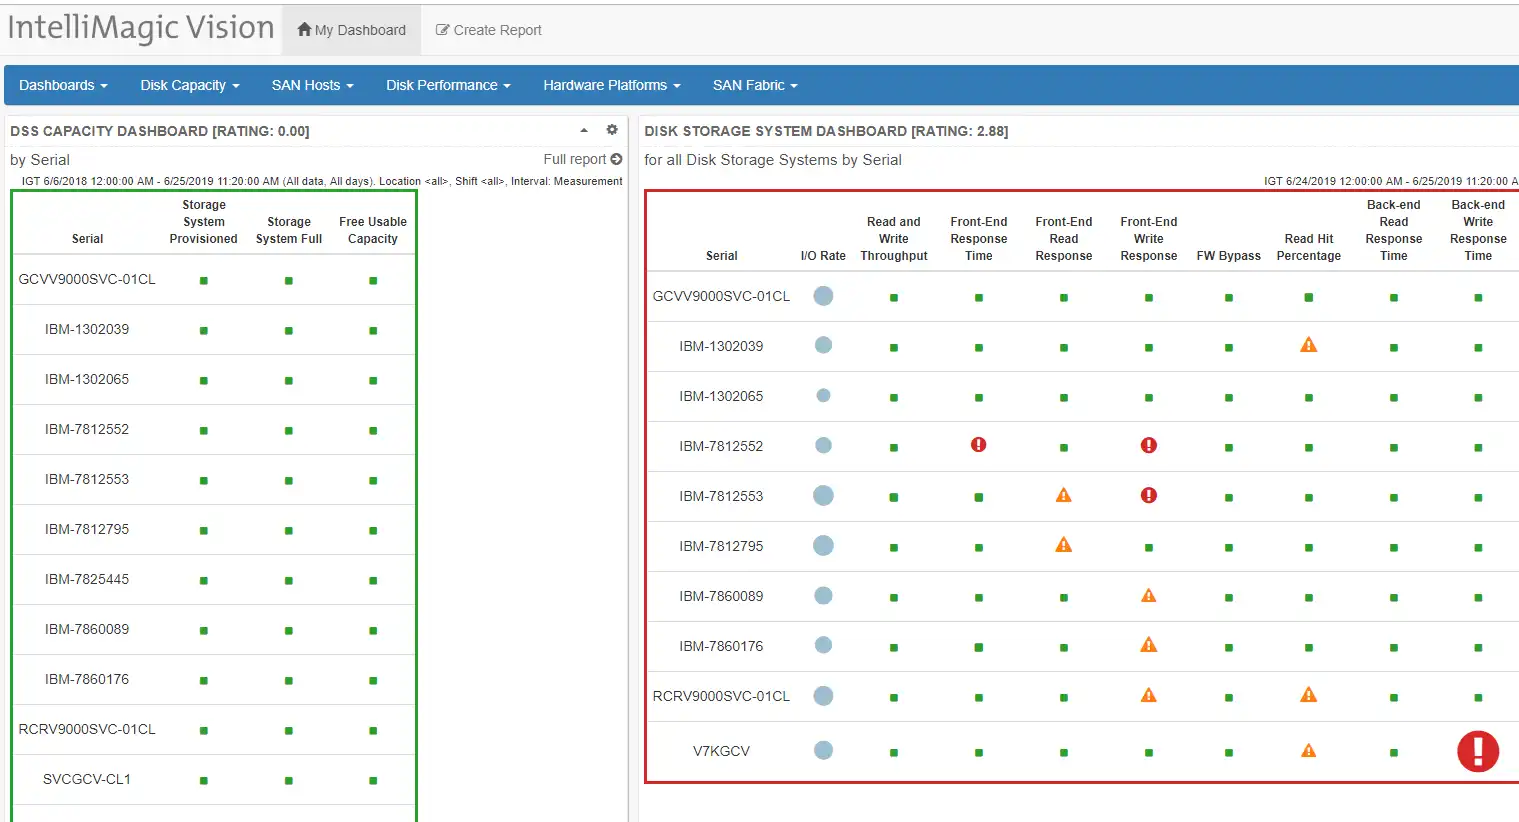
For a NOC dashboard focused on storage, I want to keep track of my capacity and performance health. In the example above, I combined a few of the IntelliMagic Vision pre-built, purpose-built dashboards.
In this case I have added a DSS Capacity Dashboard and a Disk Storage System Dashboard. The DSS Capacity Dashboard monitors the Storage System Provisioned capacity, the Storage System Full % and the amount of Free Usable Capacity. Thresholds can be set to ensure that you do not exceed the desired amount of utilized storage.
The Disk Storage System Dashboard monitors the I/O rate, Read and Write Throughput, Front-end Response Time, Front-end Read Response Time, Front-End Write Response Time, FW Bypass, Read Hit Percentage, Back-end Read Response Time and Back-end Write Response Time.
These are all metrics that track the health of storage systems and their ability to do more work. When systems are experiencing high front-end response times the hosts accessing the storage will be impacted negatively. Both dashboards use a stoplight metaphor (red/yellow/green) to indicate the health and risk in the environment. The frame color also indicates the health of the items represented in the dashboard.
The Host NOC Dashboard:
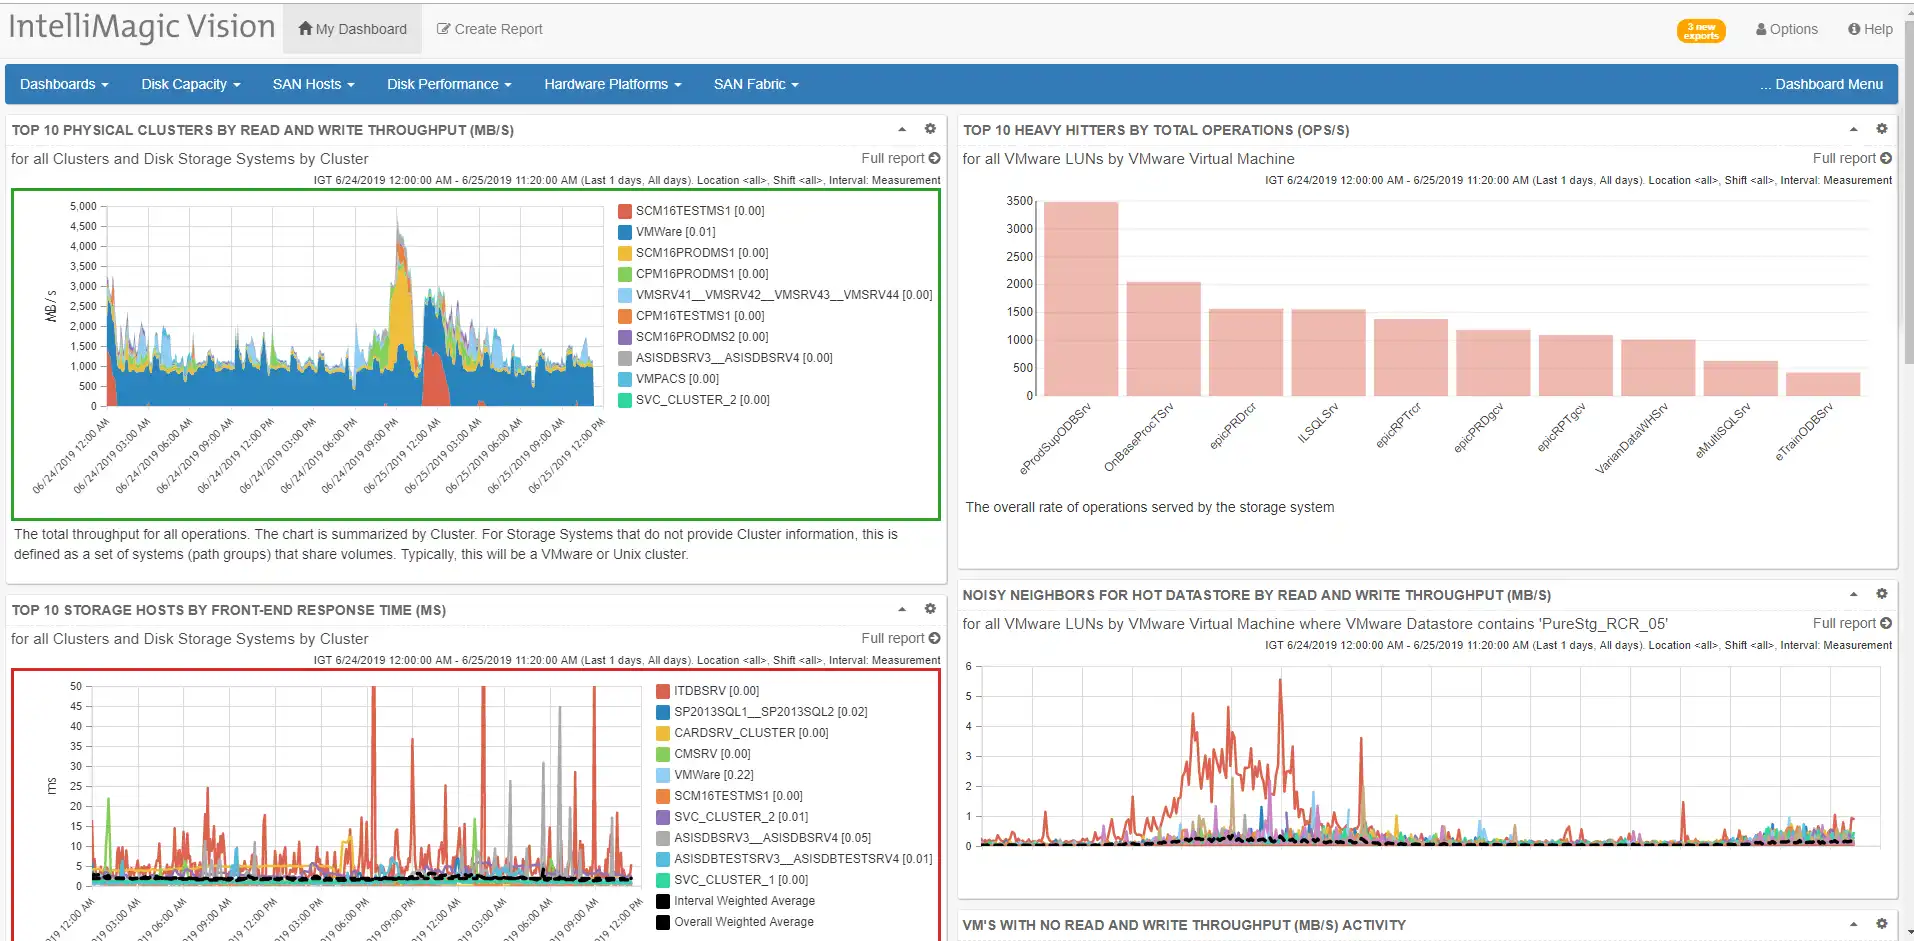
For a NOC dashboard focused on SAN hosts, I want to be able to easily see the most important areas of my SAN hosts and configuration in a single view.
Again, using IntelliMagic Vision’s pre-built dashboards, I’ve added the following charts to my Host NOC:
- Top 10 Physical Clusters by Read and Write Throughput (top left image)
- Top 10 Heavy Hitters by Total Operations (top right image)
- Top 10 Storage Hosts by Front-End Response Time (bottom left image)
- Noisy Neighbors for Hot Datastore by Read and Write Throughput (bottom right image)
The host dashboards show you the top 10 physical hosts by throughput and response time as well as the busiest VMware guests in the environment. The rated charts highlight any hosts with performance issues. Conversely, the “VMs with no read and write throughput (MB/s) activity” shows those VMs that are candidates for reclamation. This can result in significant cost savings.
Another benefit of using IntelliMagic Vision for your NOC dashboards, is that investigating any issues or areas of interest is as simple as clicking on the area of any of these charts you would like to investigate further.
Fabric NOC Dashboard
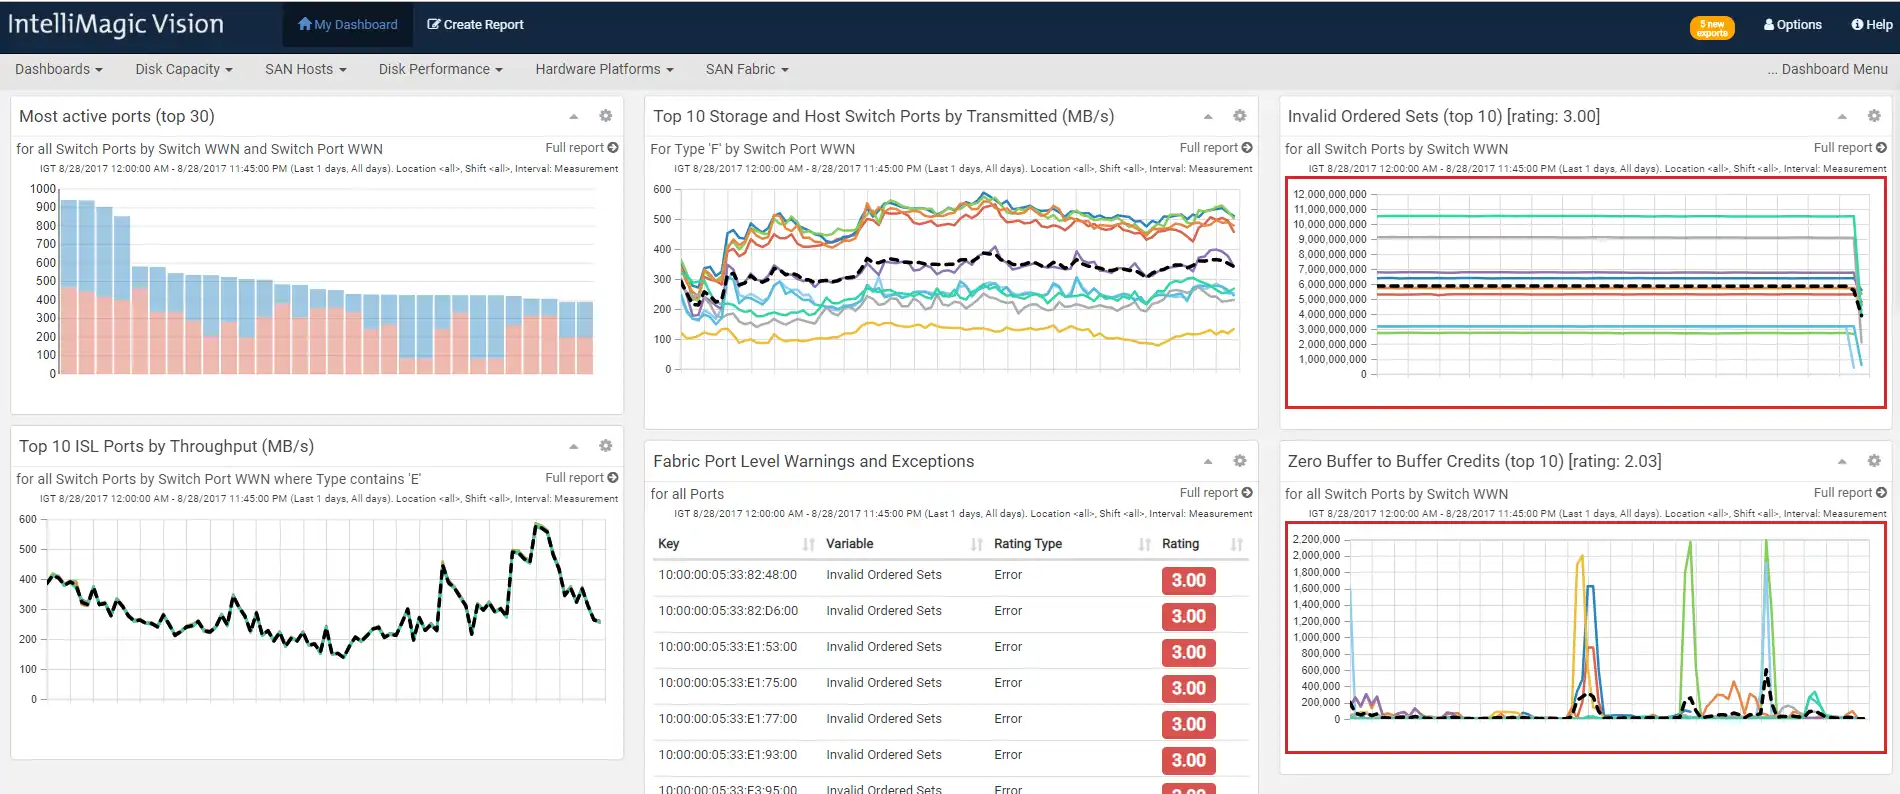
The NOC-style SAN Fabric dashboard is an excellent place to keep an eye on the busiest ports by throughput as well as any error conditions that are present in the fabric. Error conditions may indicate potential hardware failures in the SAN fabric and should be addressed as soon as possible.
In the NOC I created above using IntelliMagic Vision I included the following dashboards:
- Most Active Ports (Top 30) (top left image)
- Top 10 Storage and Host Switch Ports by Transmitted (top middle image)
- Invalid Ordered Sets (top right image)
- Top 10 ISL Ports by Throughput (bottom left image)
- Fabric Port Level Warnings and Exceptions (bottom middle image)
- Zero Buffer to Buffer Credits (bottom right image)
Network Operations Center for SAN Infrastructure
IntelliMagic Vision is a great Network Operations Center (NOC) solution that allows you to monitor the performance and capacity health of your entire SAN infrastructure in a single pane of glass. In the examples above, I created NOC’s for three specific areas, but you could just as easily create a single view for all three areas, or any area or areas that you are interested in.
Forget about the days of installing and maintaining multiple heavy tools from many vendors to monitor your environment. With IntelliMagic you can view your I/O components seamlessly with a single, normalized view of the data from your VMware, Fabric and storage systems.
IntelliMagic Vision Software as a Service is a lightweight solution for monitoring the health of your enterprise SAN environment. It is flexible, easy to implement and provides detailed drill downs that facilitate analysis of any warnings or exceptions that are surfaced in the NOC dashboards. If you would like to see how IntelliMagic can simplify your enterprise SAN reporting and reduce risk shoot us an email at support@intellimagic.com
This article's author
 Brett Allison
 Share this blog
Related Resources
Improve Collaboration and Reporting with a Single View for Multi-Vendor Storage Performance
Learn how utilizing a single pane of glass for multi-vendor storage reporting and analysis improves not only the effectiveness of your reporting, but also the collaboration amongst team members and departments.
A Single View for Managing Multi-Vendor SAN Infrastructure
Managing a SAN environment with a mix of storage vendors is always challenging because you have to rely on multiple tools to keep storage devices and systems functioning like they should.
Should There Be a Sub-Capacity Processor Model in Your Future? | IntelliMagic zAcademy
In this webinar, you'll learn about the shift towards processor cache efficiency and its impact on capacity planning, alongside success stories and insights from industry experts.
Request a Free Trial or Schedule a Demo Today
Discuss your technical or sales-related questions with our availability experts today