 Joe Hyde -
Remember the first time you looked at pond water under a microscope? Who knew such creatures even existed, let alone in a drop of water that appears clear to the naked eye.
IBM z/OS also provides a microscope. It’s called the Generalized Trace Facility, GTF for short. With a GTF I/O summary trace you can look deeply into the inner world of your storage systems. What appears innocuous at the RMF level can have some surprising characteristics when put under the GTF microscope. However, GTF contains so much data that it is not easy to “focus” this microscope and get out all the information. Fortunately, IntelliMagic now created software to process and analyze GTF I/O summary traces, such you can focus on the gems that are hidden in GTF I/O traces using IntelliMagic Vision.
To illustrate the value of analyzing GTF data, here is a story on how I used this feature to show something otherwise invisible. I recently blogged about DB2 work volumes that were exhibiting high device busy delay times. A DS8870 firmware upgrade eliminated this problem, but only when I analyzed the GTF I/O summary trace using the new feature could I really explain why the firmware upgrade made such a marked improvement.
First, these are the performance statistics for the thirty DB2 work volumes after the firmware upgrade, as reported by RMF at 15 minute intervals.
| RMF Time Stamp | I/Os per sec | Resp (ms) | IOSQ (ms) | Pend (ms) | Conn (ms) | Disc (ms) |
| 11:00 AM | 38.5 | 1.17 | 0 | 0.12 | 0.61 | 0.44 |
| 11:15 AM | 34.8 | 1.48 | 0 | 0.28 | 0.74 | 0.46 |
| 11:30 AM | 32.8 | 1.20 | 0 | 0.12 | 0.61 | 0.47 |
| 11:45 AM | 67.2 | 1.37 | 0 | 0.14 | 0.61 | 0.62 |
You can see that the I/O rates are modest and the response times are pretty good. So at the RMF 15 minute interval level there is no indication of a high number of concurrent I/Os. If you compute the “15-minute average I/O concurrency” by multiplying the number of I/Os with the response time, you get an average I/O concurrency of just 0.09 for the busiest interval at 11:45 AM. Such a low number might suggest that the chances that I/Os are simultaneously happening is low. However, from 15-minute averages it is impossible to see how activity is distributed within the interval. There may have been stretches of idleness alternating with bursts of intense activity. With GTF I/O summary trace data, you can clearly see short-lived bursts of activity, and you can also determine whether those bursts are attempting to write to extents that are overlapping, which was exactly the condition that the firmware upgrade addressed.
We started our GTF analysis by looking at the I/O rates at a much finer granularity than RMF’s 15 minutes.
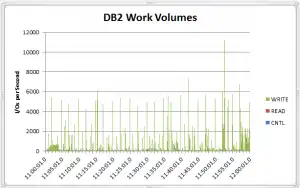 From this chart, you can tell the DB2 I/O arrival pattern was indeed very bursty. In the RMF table we saw that the average I/O rate for the busiest 15 minute interval was 67 I/Os per sec, but at these microscopic 0.1 second intervals, the I/Os peak at more than 10,000 I/Os per second. These bursts happen when DB2 exceeds the ‘modified data’ thresholds in its buffers and starts a few hundred tasks at once to write data to the disks.
I next computed how many I/Os overlapped in both I/O extent and wall clock time with any of the following or preceding I/Os. If there is a lot of overlap, this would explain why the firmware fix had such a positive effect on performance. Below is a chart for write I/Os that have both wall clock and I/O extent overlap (labeled Write & True in the chart).
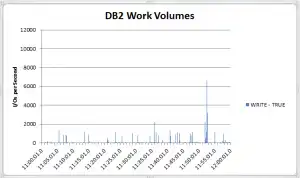
From the chart, one can see recurring high amounts of overlapping I/Os. This explains why the firmware change that allows concurrent execution of I/Os with overlapping extents for DB2 volumes had such a compelling effect on performance.
I also used the GTF trace to see how DB2’s propensity for creating these “batched arrivals” of writes to the DB2 work volumes affects HyperPAV usage. There are two LPARs and the 30 DB2 work volumes are spread across two Logical Control Units (LCUs), each with 128 HyperPAVs. Looking at the I/O rates and response times in RMF, you would expect the number of HyperPAVs in use to be quite small. But again, the GTF trace data shows a different picture. Below is a chart for the LPAR and LCU with the highest number of base and HyperPAV addresses in use, which shows the addresses in use at a granularity of 0.1 second intervals.
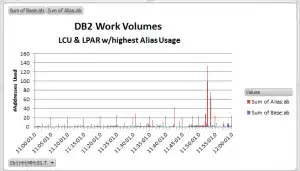
The graph shows a peak of 6 base addresses and all 128 HyperPAVs in use. I checked whether the I/Os overlapped in time and indeed all 128 HyperPAVs were active at the same time.
The impact of DB2 batched arrivals can also be measured using the response time components from the I/O summary trace. Below is a chart showing the I/O response time components in 0.1 second intervals.
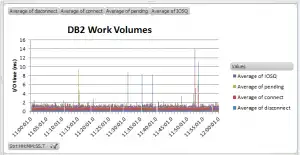
Although almost all response times were below 2ms, there were some outliers, especially around the highest address consumption time period. Since you cannot prevent DB2 from doing these batched writes, you’ll want to spread your DB2 work volumes over as many LCUs and channels as you have available to spread the activity as much as possible when these batched arrivals occur.
Even after having worked with GTF traces for over 30 years, I was still amazed by how much I could see using the GTF trace microscope in combination with this new IntelliMagic Vision feature. If you have any applications on your system you’d like to put under the microscope, just let us know and we can use IntelliMagic Vision to do this for you.
This article's author
 Joe Hyde
 Share this blog
Related Resources
IntelliMagic Vision Support for Hitachi VSP SMF Records from Mainframe Analytics Recorder
Learn how to gain insight into the health of the Hitachi Virtual Storage Platforms VSP 5000 series and VSP F/G1x00 storage systems using the SMF records created by the Hitachi Mainframe Analytics Recorder.
From Taped Walls to Your PC: z/OS Configuration Made Simple with Topology | IntelliMagic zAcademy
In this webinar, we explore a technique that integrates diverse data sources from z/OS, presenting them in a clear, concise, and interactive visual format.
Banco do Brasil Ensures Availability for Billions of Daily Transactions with IntelliMagic Vision
Discover how Banco do Brasil enhanced its performance and capacity management with IntelliMagic Vision, proactively avoiding disruptions and improving cross-team collaboration.
Book a Demo or Connect With an Expert
Discuss your technical or sales-related questions with our mainframe experts today