
This blog was originally published on November 20, 2017.
Each distributed system platform has unique nuances. In Part 1 of this blog, I demonstrated how having a single view to manage your multi-vendor SAN infrastructure helped ensure performance and understand the overall health, performance and capacity. What is equally important to these common views is a solution that is capable of getting the detailed performance data capable of supporting vendor specific architectures.
New storage system platforms are popping up every year, and it’s impossible to stay ahead of all of them and provide the detailed, intelligent, performance views necessary to manage your SAN infrastructure and prevent incidents. However, IntelliMagic Vision supports a wide variety of SAN platforms for which we provide our end-to-end capabilities.
EMC VMAX Auto-Tier Breakdowns
For EMC, there are several aspects that are important in terms of performance management:
Visibility into the Storage Group Performance and their associated Tiers (Policies)
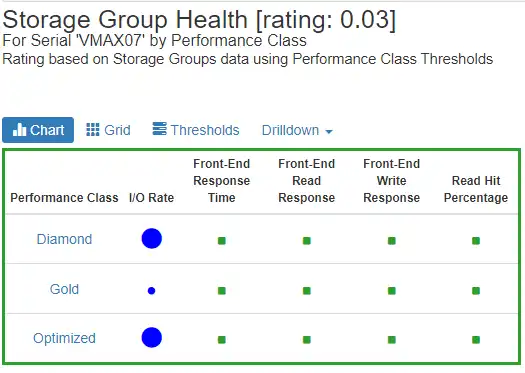
Figure 1 Storage Group Health
Ability to drill down to a Performance Class’s Storage Groups over time
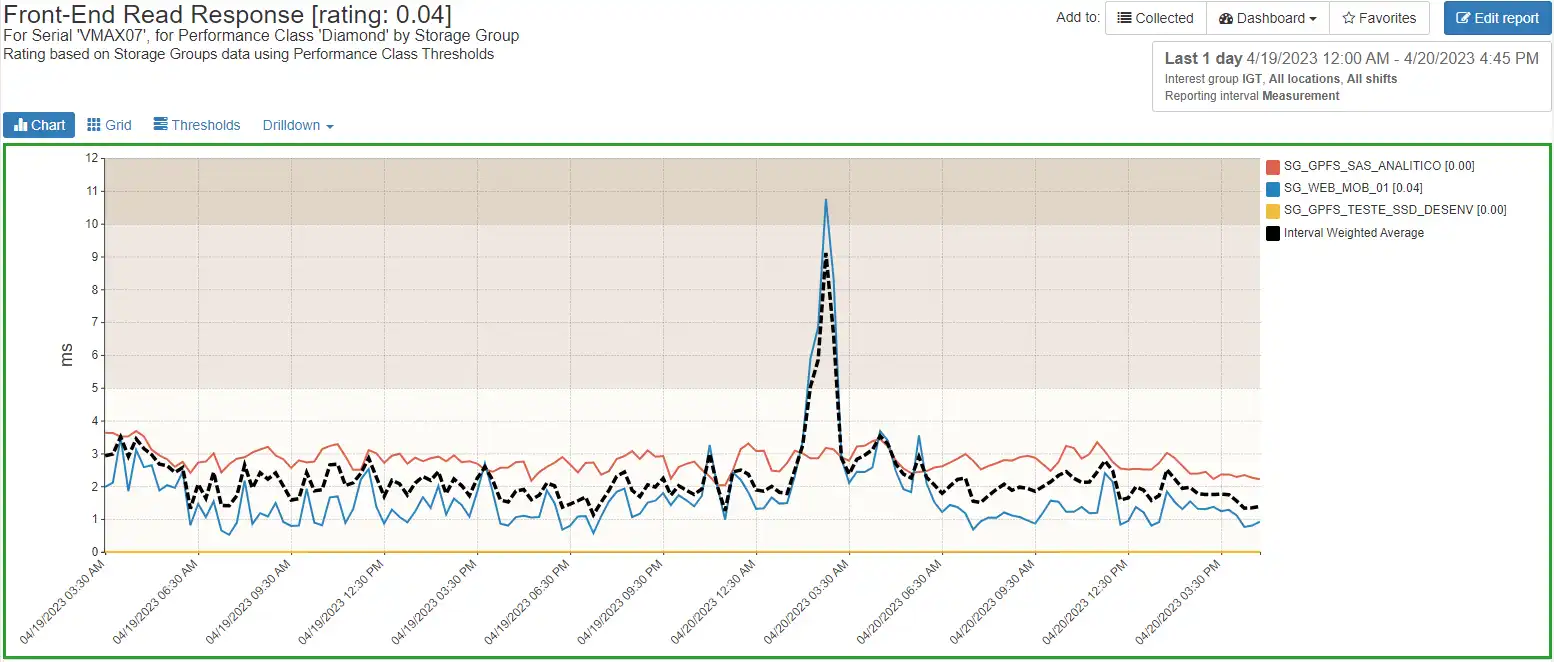
Ability to drill down to a storage group’s volumes performance metrics over time
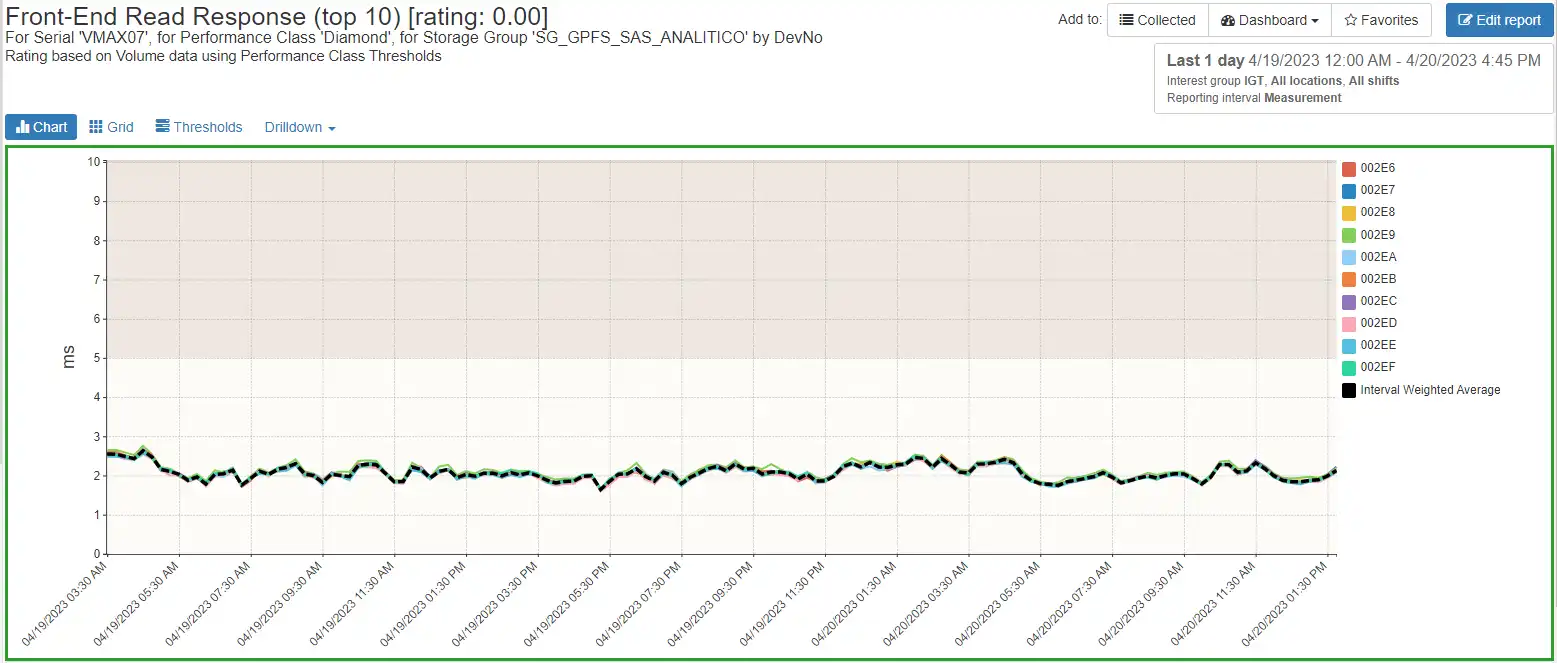
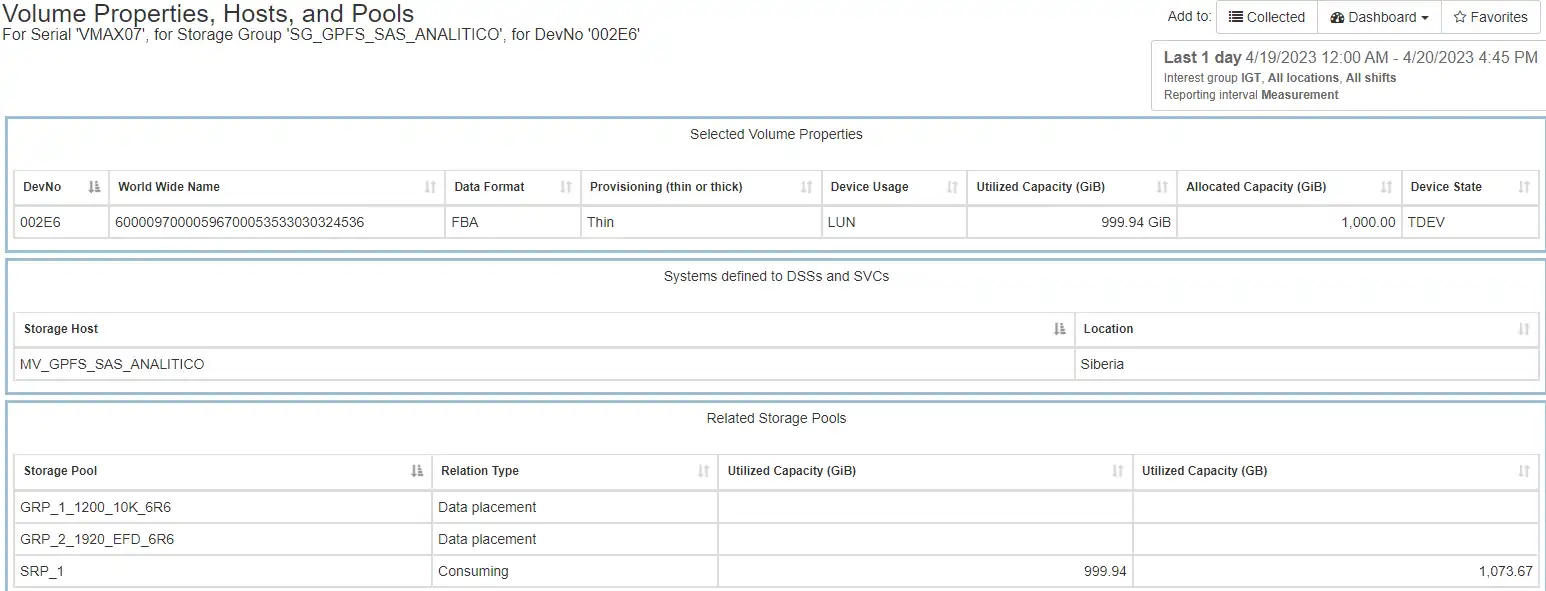
Inspect the volume tier breakdowns:
Ability to see front-end imbalances within the port groups
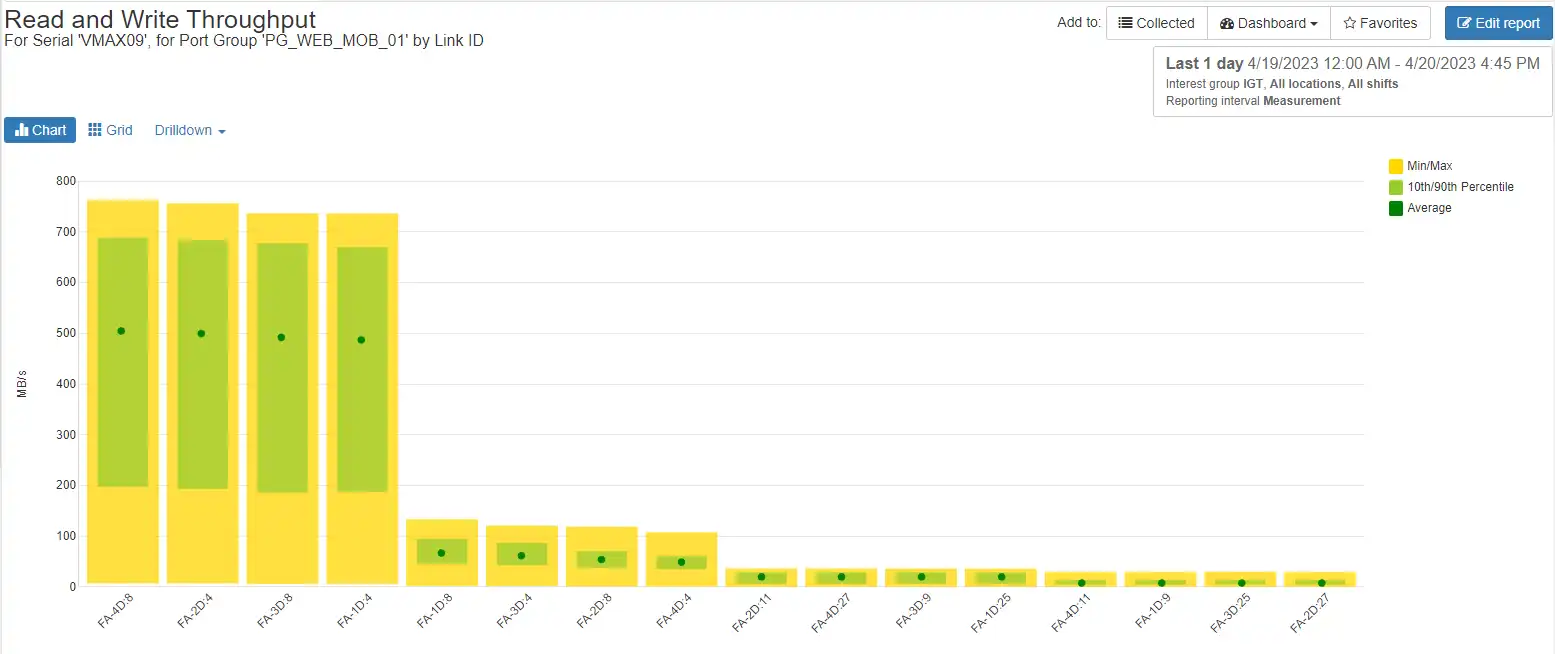
Quickly identify associated hosts/storage groups/volumes in the port groups
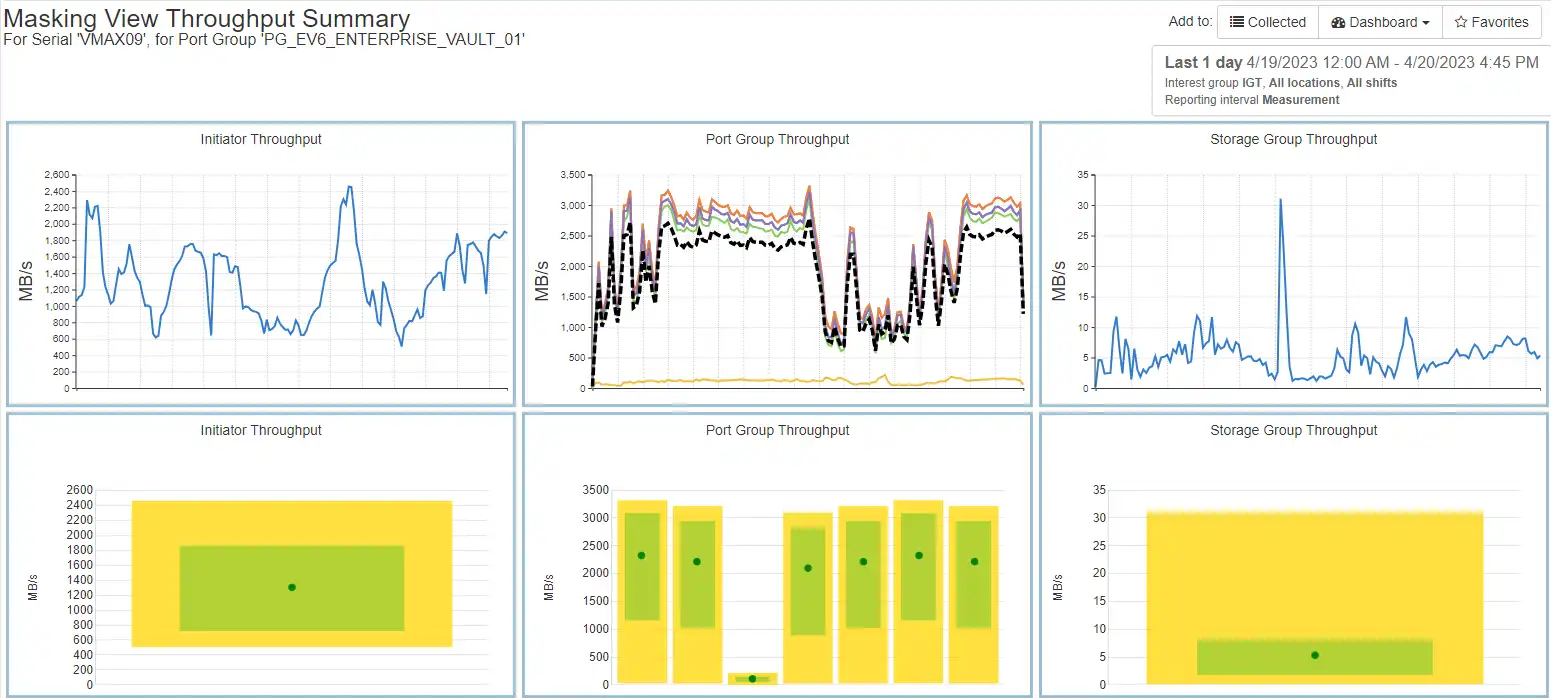
IntelliMagic Vision makes all 3 of these activities easy.
HDS Detailed Performance Statistics
We use the native CLI to get detailed performance data and it allows us to provide a rich set of performance and configuration information for Hitachi Vantara F and G series systems. The Hitachi Vantara system provides measurement for the storage system, directors, ports, disks, host groups, storage arrays and logical devices and for the G5000 series you can additionally measure the internal bus saturation between the various components.
The following chart shows if there is contention on the HIE to ISW paths or the MPU to HIE paths. See whitepaper on Hitachi Vantara G5000 for more details.
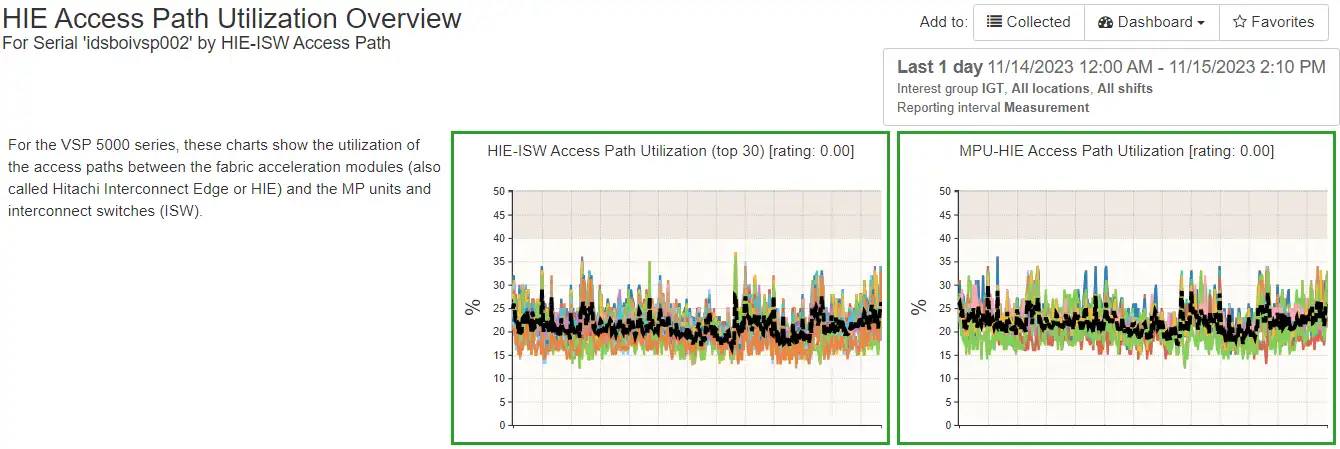
IntelliMagic Vision provides continuous detailed statistics collection that supports rich volume statistics, storage pool aggregations from volume data, host views of performance, detailed port performance metrics, and RAID group utilization.
IBM Spectrum Virtualize: Mdisk to Back-end Volume Mapping
In this next view, we will drill down from the IBM SVC Storage Pool to its external Mdisks, to the associated back-end volumes. In doing this, we switch from the SVC perspective to the front-end of the back-end storage system seamlessly.
In the first view, we see the external Read I/os per second to the mdisk104.
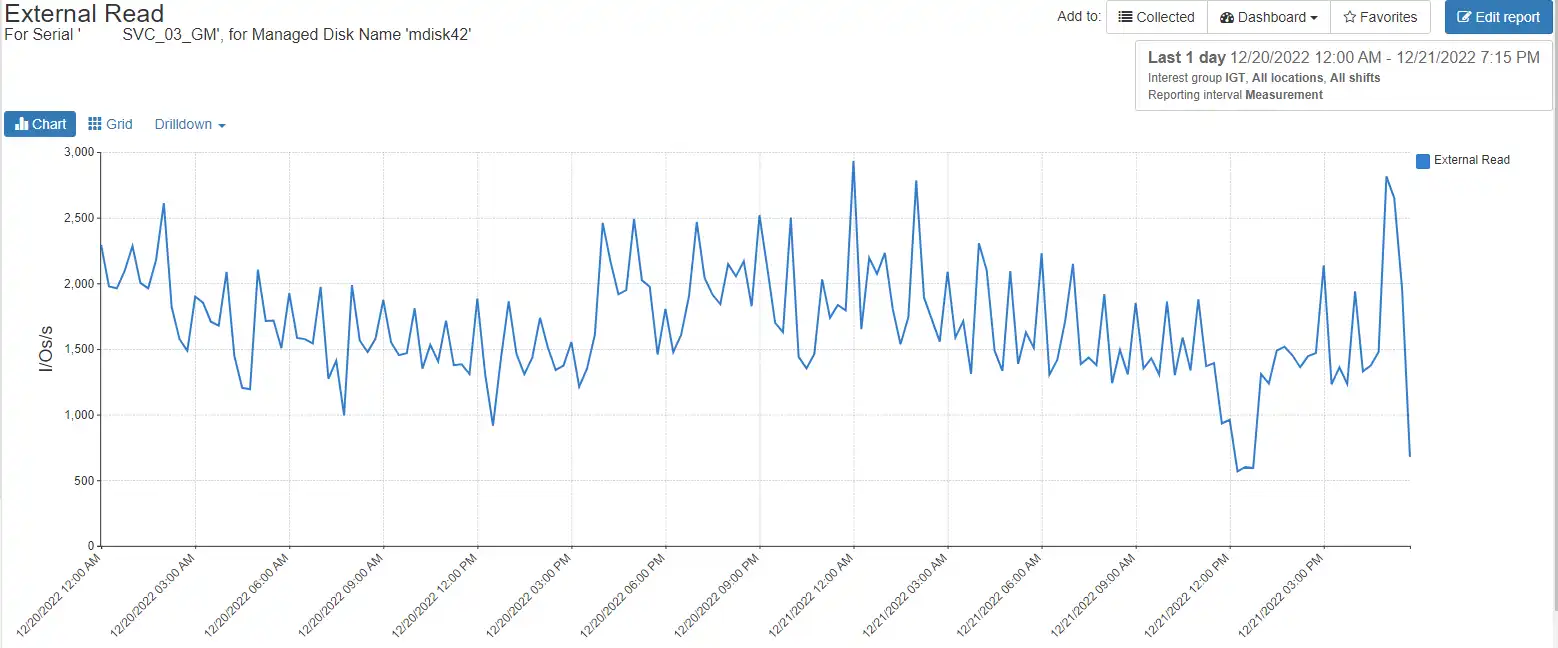
In the second chart we drill down to the volume associated with the mdisk.
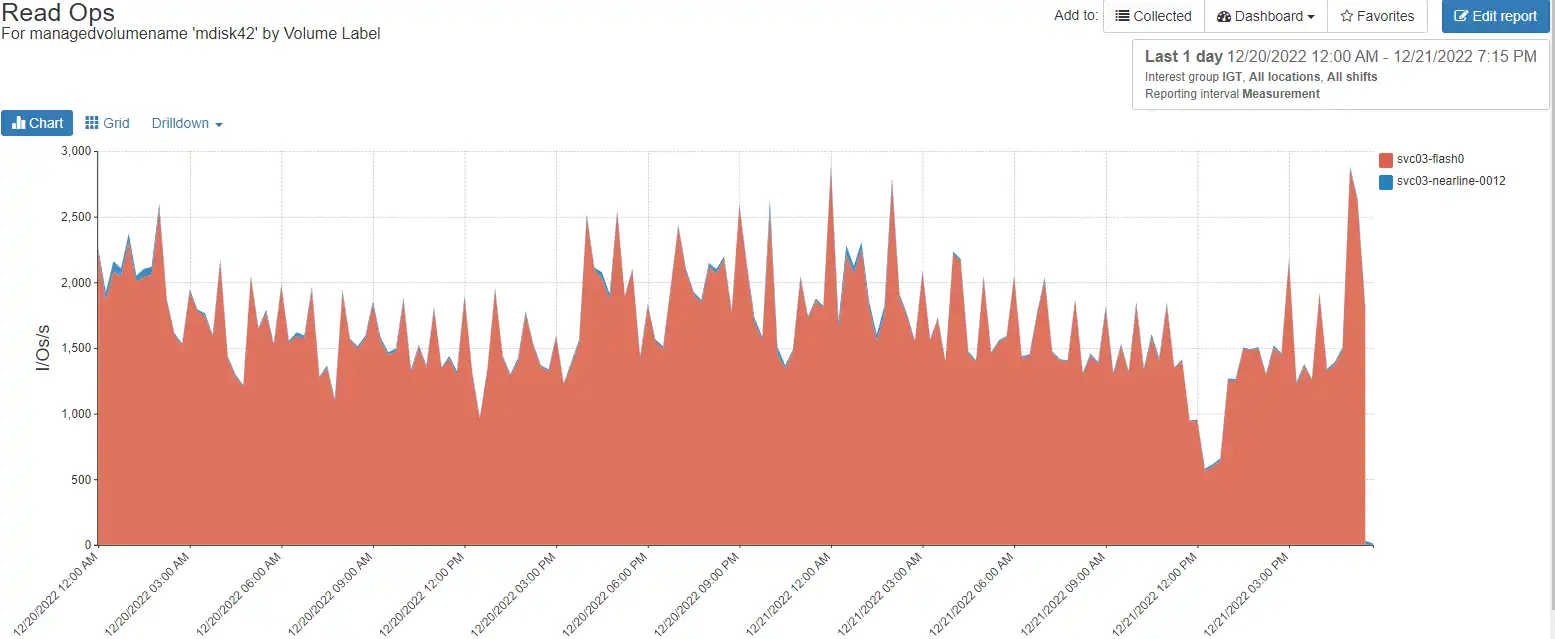
As you can see, the number of read I/Os matches between the external reads on the mdisk and the front-end (different data source) reads on the back-end storage controller. This type of visibility allows you to understand if there are any issues on the underlying back-end volumes and provides complete end-to-end visibility of the Spectrum Virtualize stack.
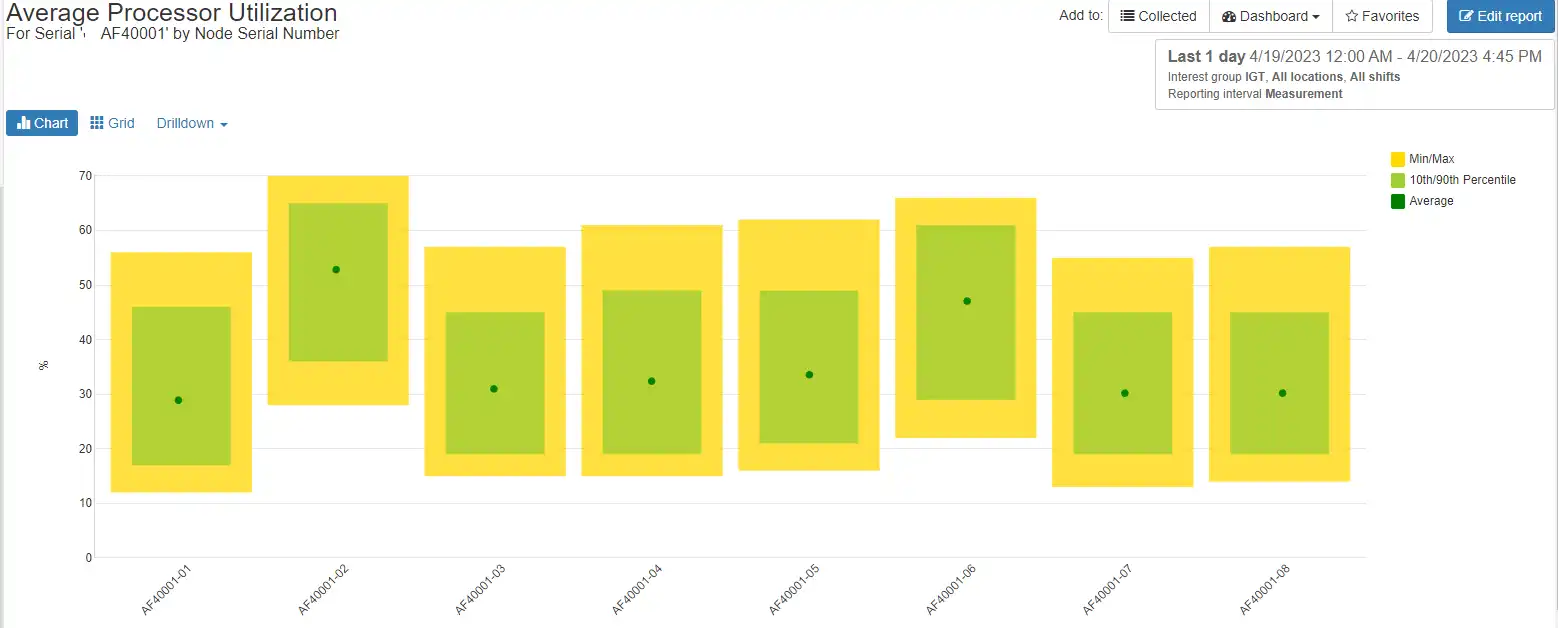
NetApp: Physical and Logical Awareness
When managing NetApp performance, it is important to understand both the Physical and Logical components of a NetApp storage system to understand the performance and the capacity.
In this first chart, we demonstrate a balance chart showing the average, 10th/90th percentile and min/max values for processor busy. Similar charts show the average utilization for the disk drives in the aggregates. These allow you to know if you are close to the edge on your NetApp systems and whether or not you need to consider upgrading your configurations to handle additional load.
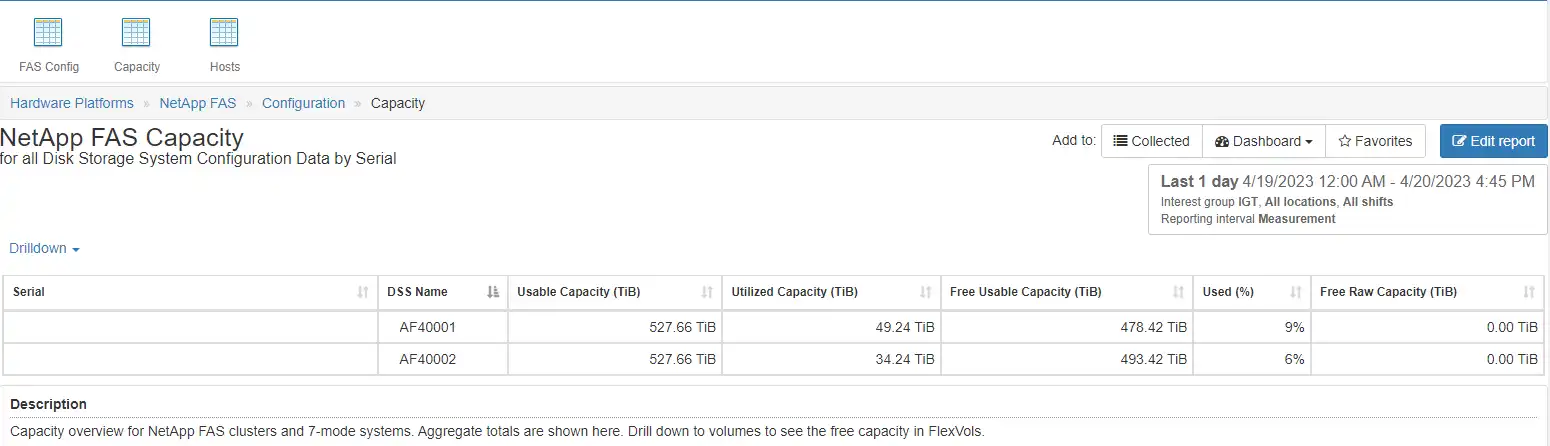
The second chart shows an overview of the Capacity usage. From here, we provide detailed capacity drill downs into the different components of the capacity.
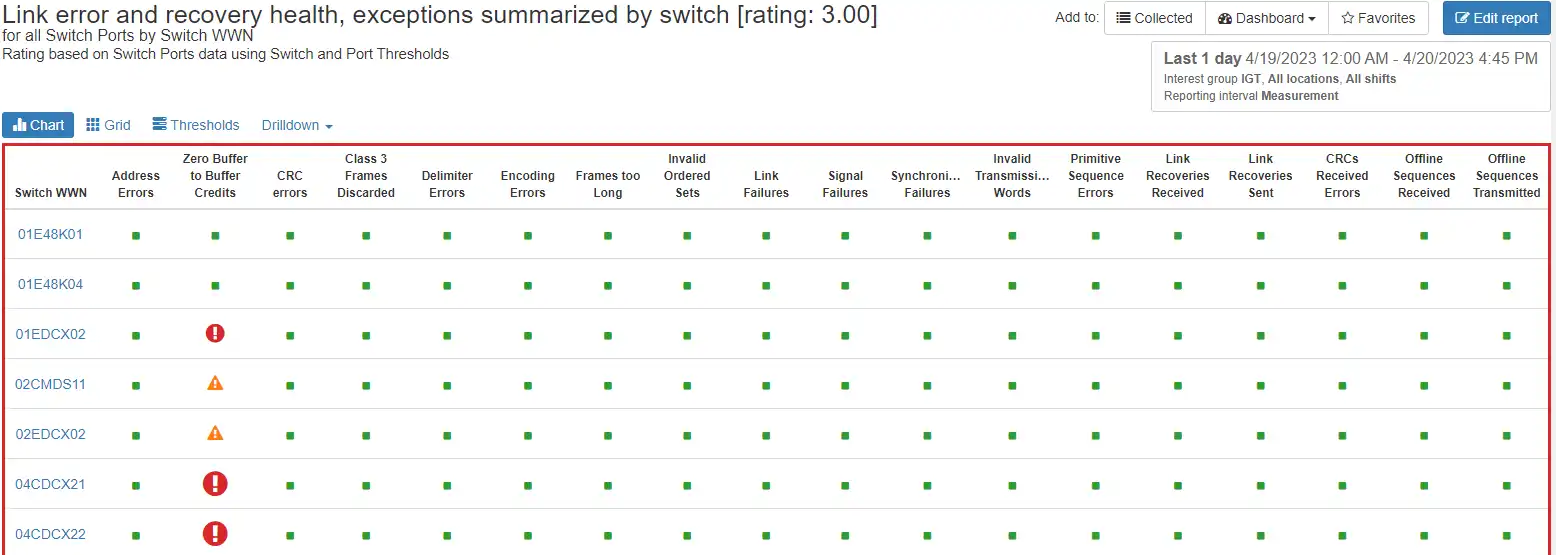
SAN Switches: Brocade and Cisco
IntelliMagic Vision collects detailed error information from your Brocade and Cisco SAN switches and using this information, provides a rated view over time to provide an enterprise view of the health of your switches with the ability to drill down to the individual ports having the issues.
VMware: Drill Down from Application to Back-end
IntelliMagic Vision supports drilling down from the VM to the back-end volumes:
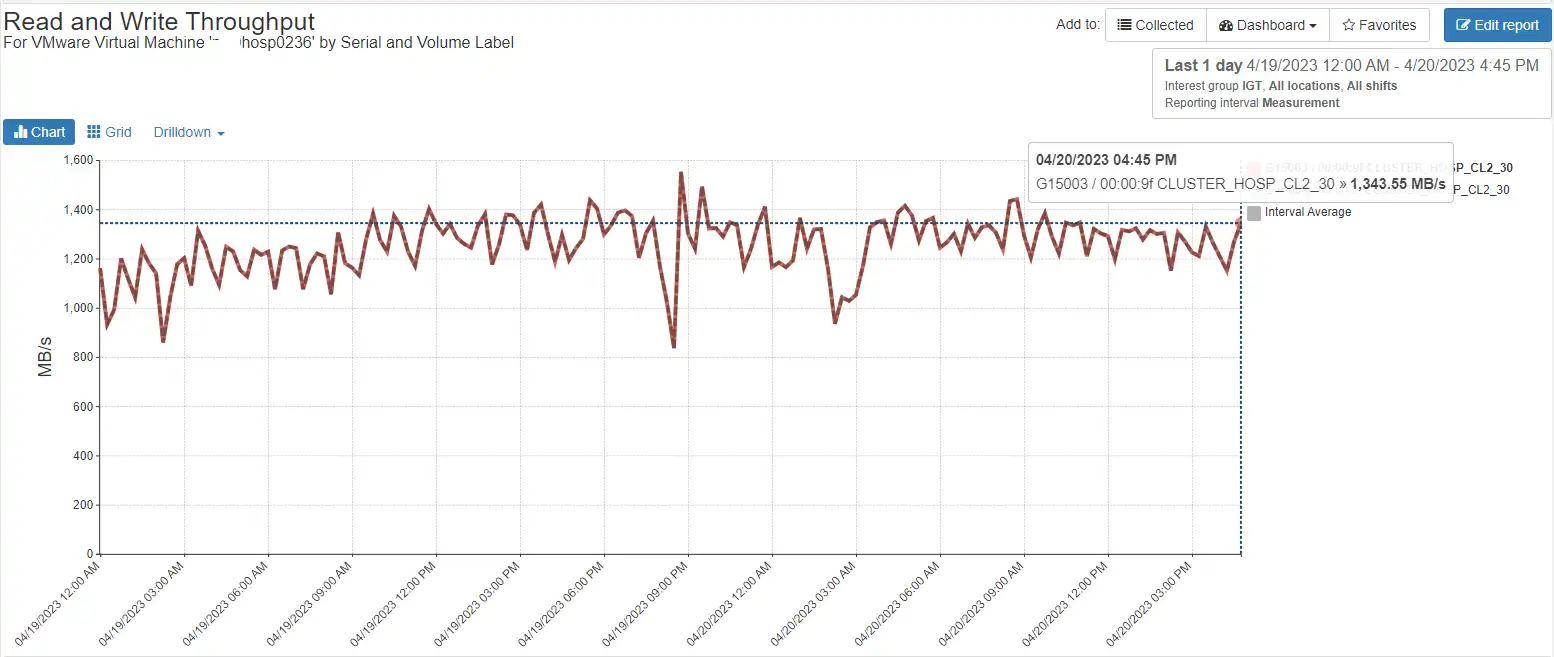
You can also see the related performance for the associated back-end volumes:
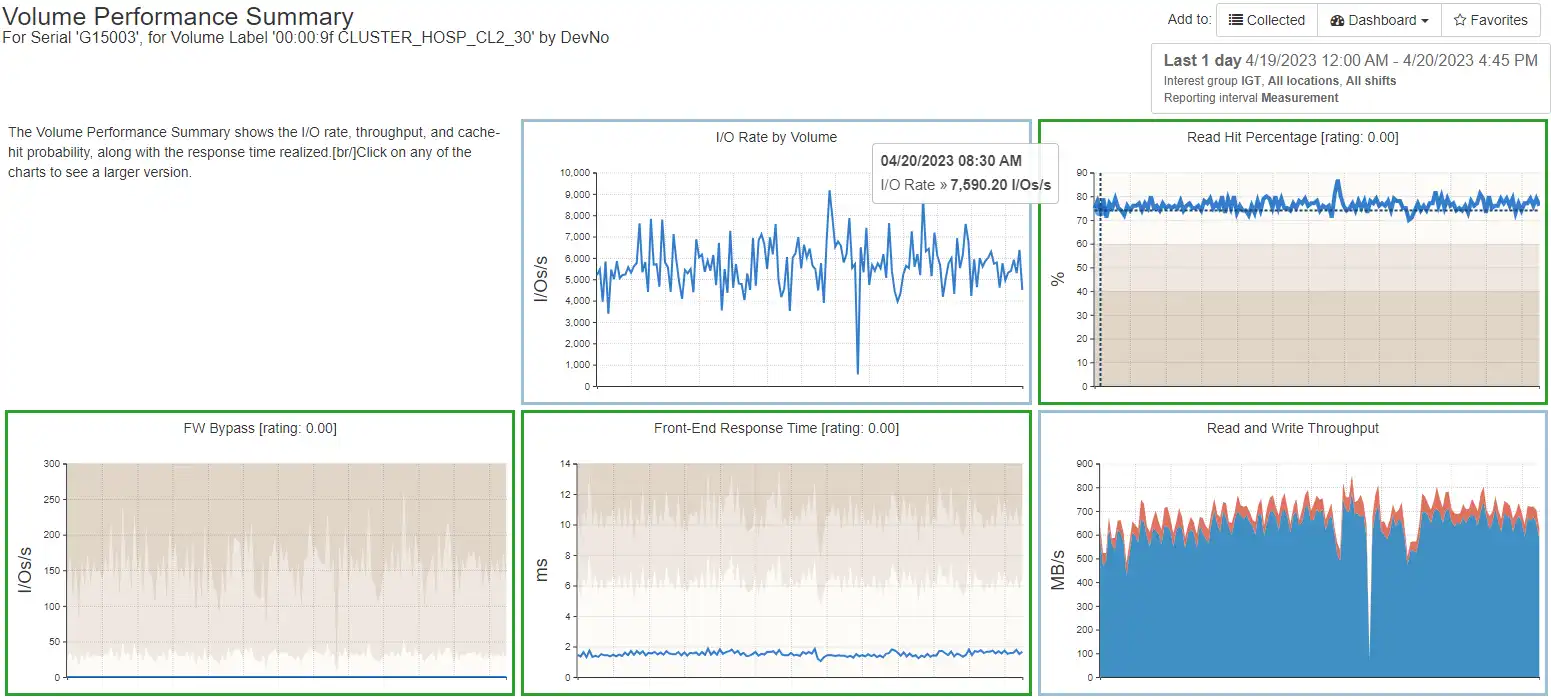
For the related Datastore you can see what other VMs are accessing it and if there are any noisy neighbors.
Understanding Platform Specific Nuances in Multi-Vendor SAN Infrastructure
The examples I covered in this blog are only a small sample of the nuances each platform has on a distributed system. Understanding these nuances is crucial to providing intelligent and detailed performance management solutions that help you not only resolve issues, but prevent them.
This article's author
 Brett Allison
 Share this blog
Related Resources
How to Detect and Resolve “State in Doubt” Errors
IntelliMagic Vision helps reduce the visibility gaps and improves availability by providing deep insights, practical drill downs and specialized domain knowledge for your SAN environment.
Finding Hidden Time Bombs in Your VMware Connectivity
Seeing real end-to-end risks from the VMware guest through the SAN fabric to the Storage LUN is difficult, leading to many SAN Connectivity issues.
Should There Be a Sub-Capacity Processor Model in Your Future? | IntelliMagic zAcademy
In this webinar, you'll learn about the shift towards processor cache efficiency and its impact on capacity planning, alongside success stories and insights from industry experts.
Request a Free Trial or Schedule a Demo Today
Discuss your technical or sales-related questions with our availability experts today