
The HPE 3PAR family of storage systems is a workhorse in many datacenters. It has a proven track record of high performance and high availability. As with other storage systems, however, there are limitations to what the array can provide in terms of performance, and care must be taken to ensure that the array is configured with high availability as well as high performance in mind.
This blog will point out the key HPE 3PAR metrics for you to consider for optimizing your system and application performance.
Metrics Provided by the HPE 3PAR System
Performance analysis for any storage array can seem like a daunting task if you’re new to performance analysis. Modern storage arrays can provide an overwhelming number of capacity and performance metrics to sift through, and it can be easy to be caught up in analysis paralysis.
HPE 3PAR arrays provide a rich set of performance metrics that can be gotten via CLI or REST API. The 3PAR CLI provides point in time metrics and can provide historical context using the 3PAR System Reporter metrics. Some of the key metrics to consider are shown in Figure 1.
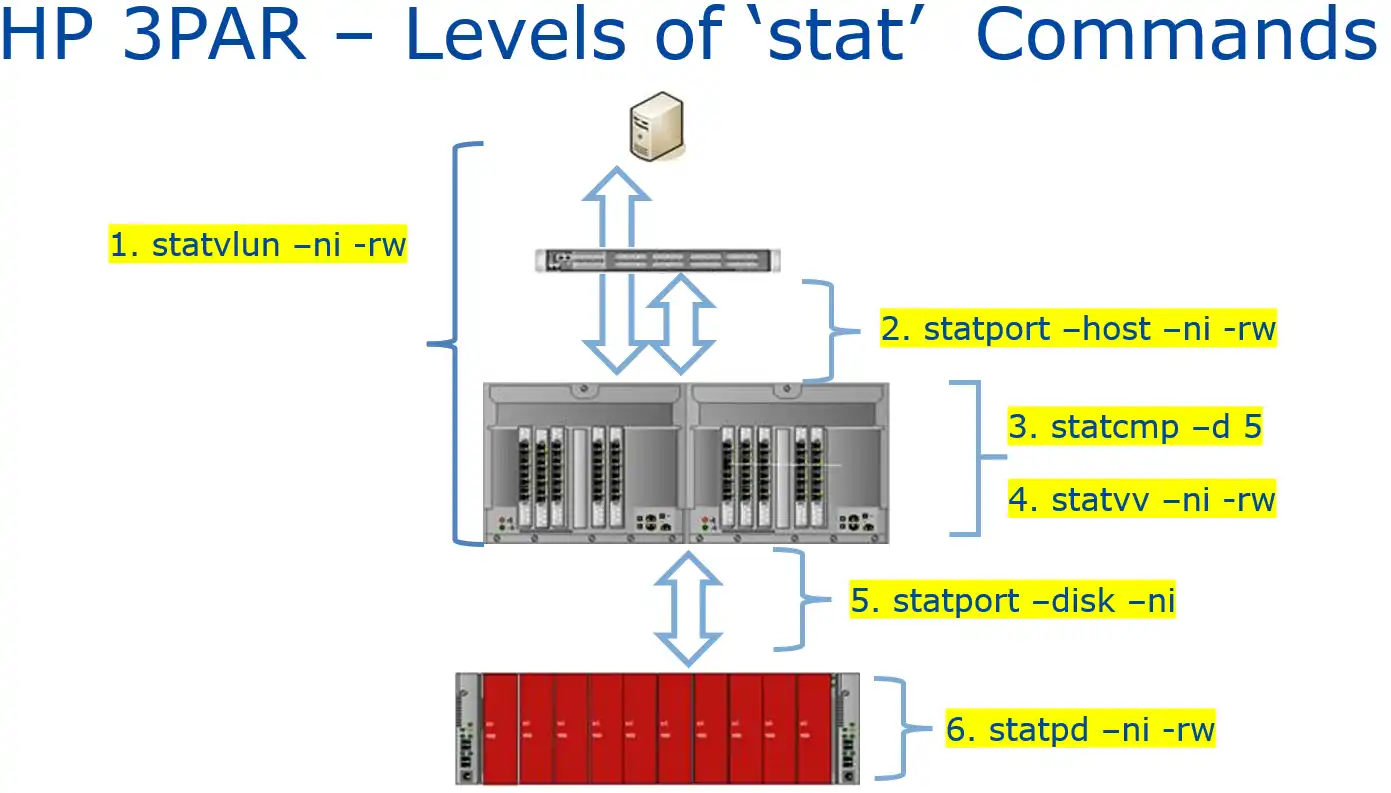
Figure 1: Statistics Provided by HPE 3PAR
Each of these commands also have a System Reporter counterpart indicated with a prefix of ‘sr’, indicating System Reporter (statvlun vs. srstatvlun). The System Reporter commands provide historical context.
- statvlun/srstatvlun – displays end-to-end performance statistics for each virtual volume. Metrics include IOPS, bandwidth in kilobytes per second, service time in milliseconds, and I/O size in kilobytes.
- statport -host/srstatport– displays performance statistics for a particular host port. Metrics include IOPS, bandwidth in kilobytes per second, service time in milliseconds, and I/O size in kilobytes.
- statcmp/srstatcmp – displays cache memory page statistics by node or virtual volume. Metrics include read and write cache hits and hit percentage, node queueing, cache page statistics, and delayed acknowledgements.
- statvv/srstatvv – shows the internal latency statistics for a volume. Metrics include IOPS, bandwidth in kilobytes per second, service time in milliseconds, and I/O size in kilobytes.
- statport -disk – shows the statistics for a back-end disk port. Metrics include IOPS, bandwidth in kilobytes per second, service time in milliseconds, and I/O size in kilobytes.
- statpd – displays the performance statistics for the physical disks in the system. As with the other metrics.
As you can see, each step in the data path, from the host to the back-end disk utilization is covered, making performance troubleshooting easier. One other thing to consider is that if you have a low internal latency for a virtual volume (statvv), but a high overall latency (statvlun), the issue is typically outside the array and points to either a host issue or SAN fabric congestion, both of which are outside the scope of this blog.
Key 3PAR Metric #1: Front-end Performance
The main performance indicator for front-end performance is host port latency because this is a measure of how the end host perceives data flow. HPE 3PAR refers to this as service time measured in milliseconds. There are many components of the data path that can affect front-end performance, so high front-end latency can be indicative of problems elsewhere.
Typically, poor front-end performance is caused by one or more things:
- Saturated front-end ports
- A low read cache hit ratio
- Back-end media utilization
Of these options only front-end port saturation is directly caused by the front-end ports. Figure 2 shows a Front-end Port Utilization Balance Chart indicating a large port imbalance.
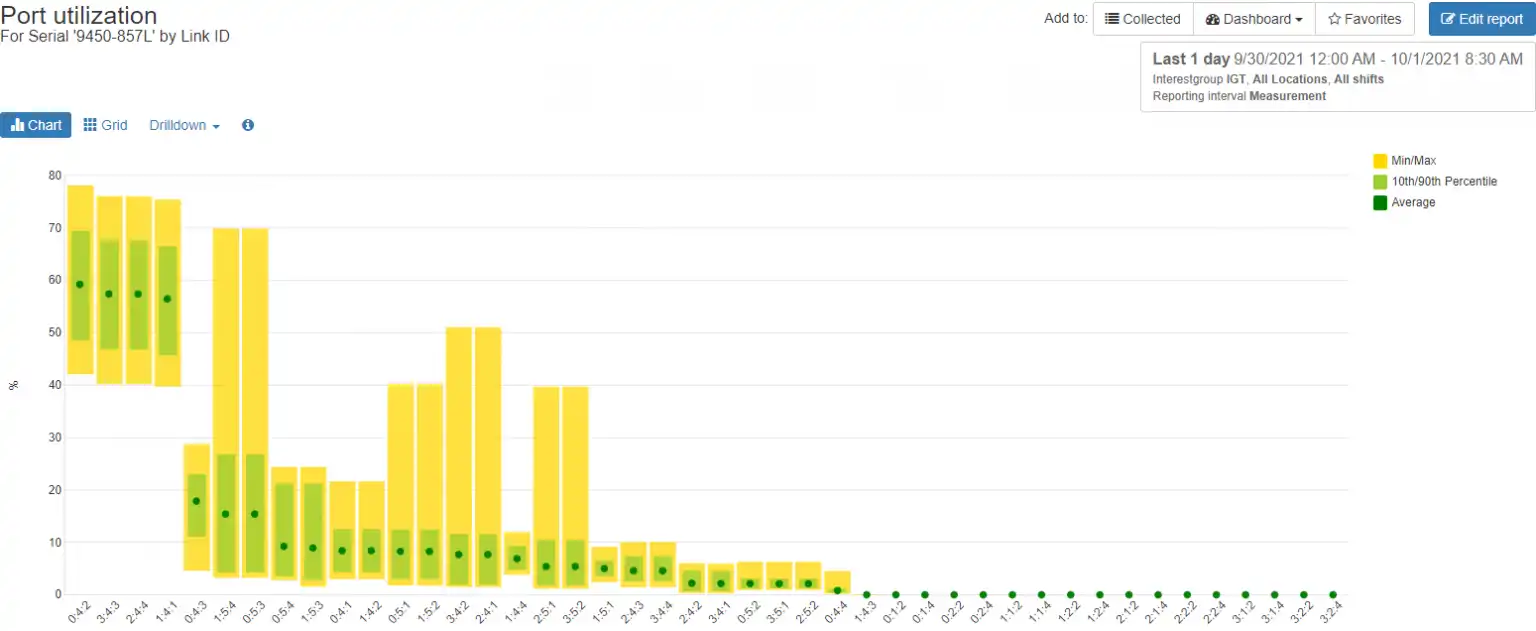
Figure 2: 3PAR Front-end Port Utilization Balance Chart Showing Port Imbalance
From this chart we can see four ports are carrying a much higher workload than the other configured ports in the system. Ideally, the workload would be spread out more evenly across the other ports. In a previous blog I wrote about troubleshooting front-end port saturation on HPE 3PAR.
Key 3PAR Metric #2: Low Read Cache Hit Ratio
Most modern storage arrays are either all-flash or have a flash tier to serve the most critical data. Even though flash media is very fast, it is still slower than a DRAM-based cache. HPE 3PAR employs a very large read cache and sophisticated algorithms to ensure that host reads will come out of cache instead of from the slower back-end media.
A workload with a low read cache hit percentage can affect front-end performance dramatically as seen in Figure 3.
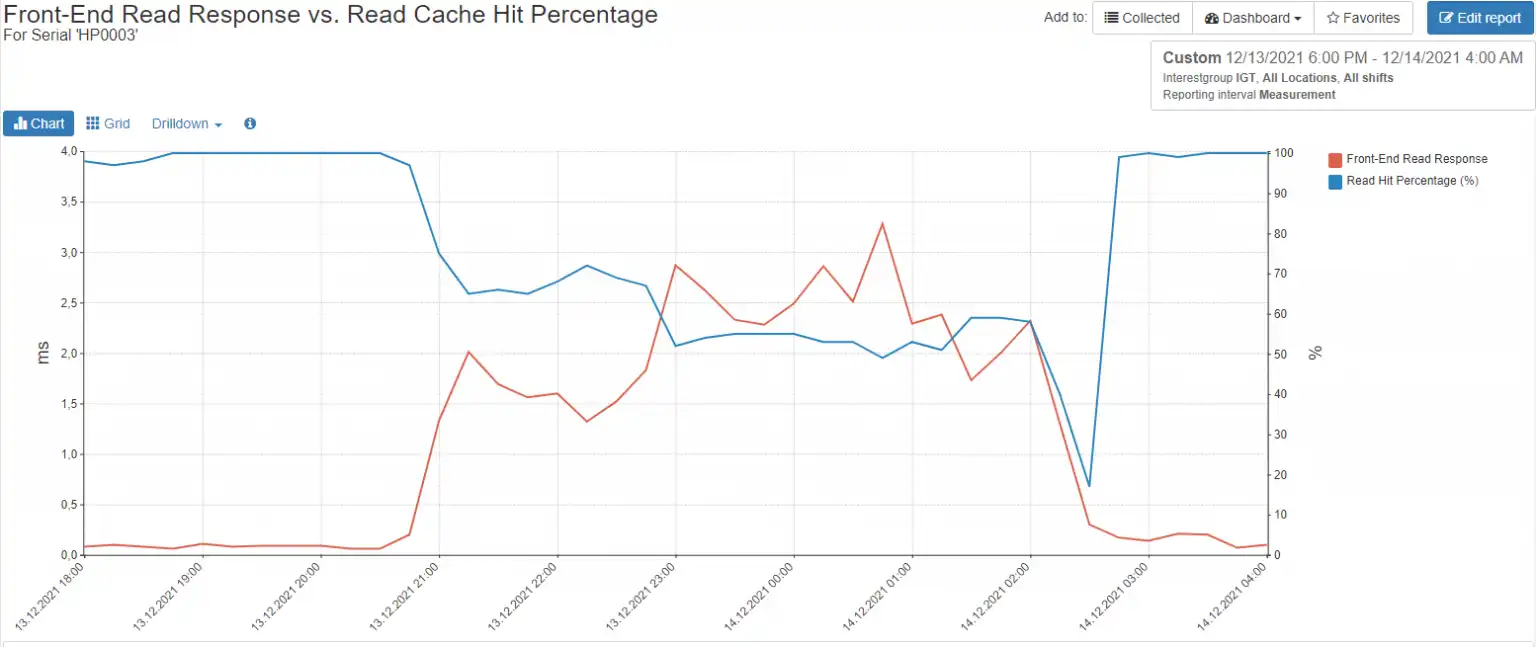
Figure 3: Low Read Cache Hits
You can see that even on an all-flash array, as the read cache hit percentage (blue series) decreases, the front-end response time (red series) increases dramatically. Situations like this can be eased by changing the workload to be more cache friendly or scheduling the work to be done during a time where the array is less busy. If you have a hybrid array, consider implementing Adaptive Flash Cache, which uses some of your available flash media to augment the storage array’s cache.
Key 3PAR Metric #3: Back-end Media Performance
As with other storage arrays, an HPE 3PAR node stores host data to be written in node cache, mirrors that write to its partner node, then acknowledges the write to the host. That data will remain in write cache until it is later destaged to back-end media. This functionality allows 3PAR to deliver data to the host quickly.
If the back-end media is too busy to accept writes, the write cache will fill up and front-end performance will be adversely affected. The primary metric to watch for media performance is drive rate, which is measured in input/output operations per second or IOPS.
Because HPE 3PAR wide stripes across all disks of a type, FC, NL, and SSD, you can multiply the number of disks of a particular type by the capabilities of the media type to get the total amount of IOPS that can be delivered by the tier. I typically use the values in Table 1 as a rule of thumb, but you should consult HPE’s most recent documentation for the most current values, as there are multiple media types in terms of performance and capacity that HPE allows.
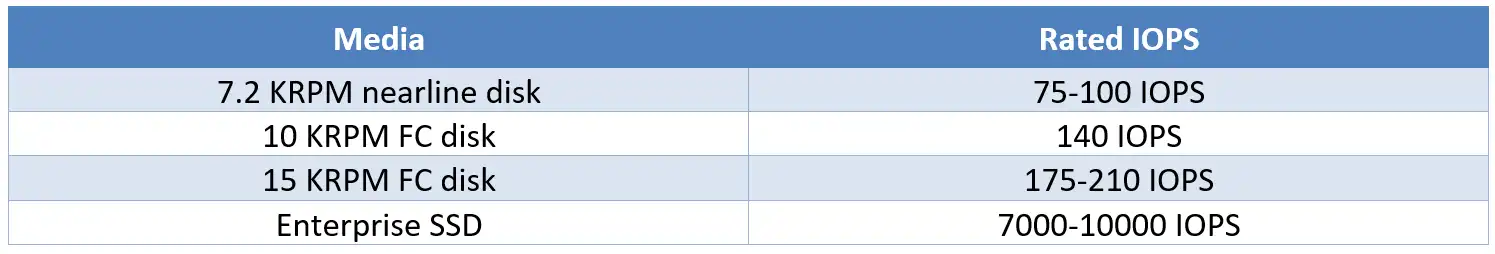
Table 1 – Disk IOPS
Using these figures, a 3PAR 8450 with 100 SSDs installed should conservatively deliver 700,000 IOPs.
Figure 4 shows a 3PAR 8440 model with 192 x 3840GB SSDs with an average of 1,450.69 IOPS per drive, well within what an enterprise-class SSD should provide.
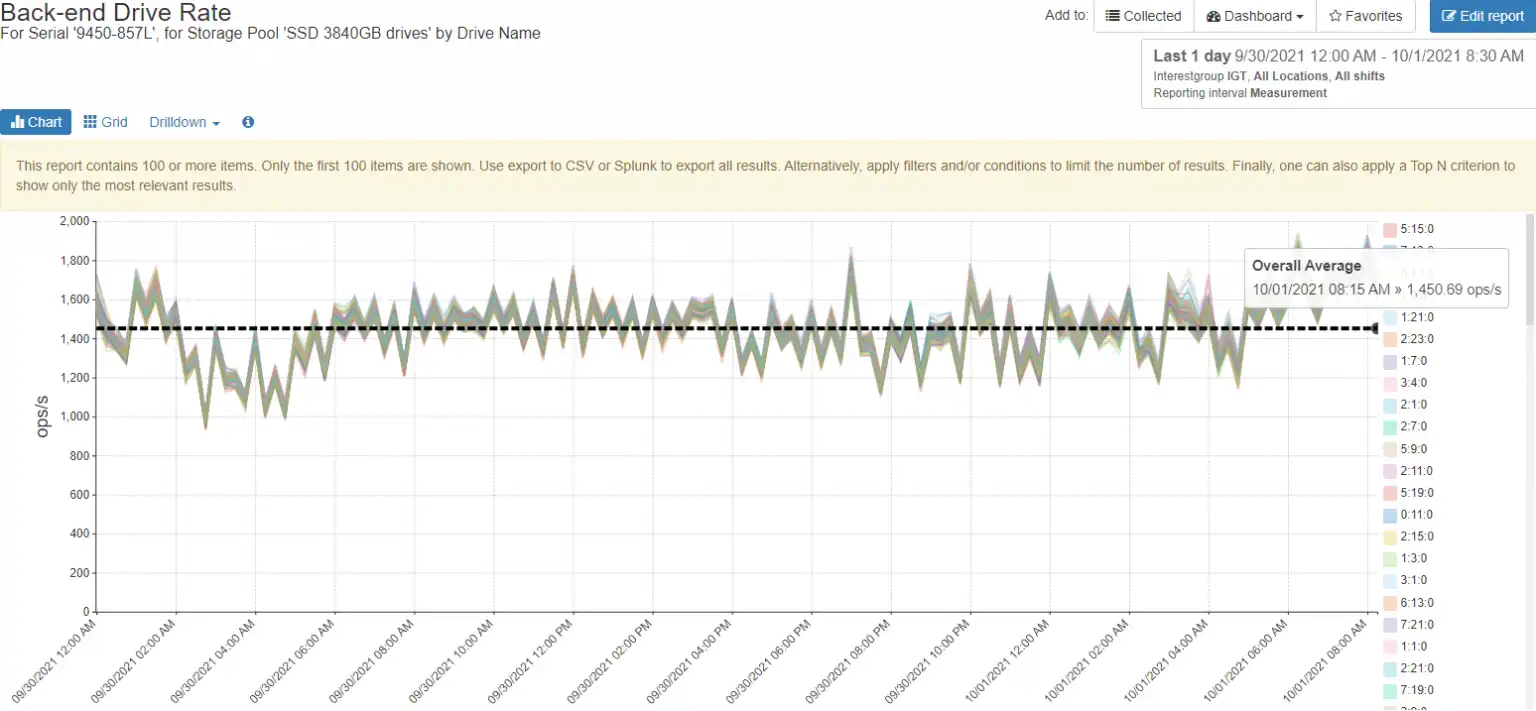
Figure 4: Back-end Drive Rate
Unravel the Mystery
Performance analysis for an HPE 3PAR storage array doesn’t need to be overly complicated. Whether you start from the back end and work your way to the host or start at the host and work your way to the media, understanding the key metrics and taking a logical and orderly approach to performance assessment can help unravel the mystery.
Gathering performance data from the CLI, however, usually requires a variety of scripts and the use of Excel to help organize and interpret the data. This method is clunky and requires constant maintenance. It also requires a certain level of knowledge to interpret whether a particular performance metric is good or bad.
While there is reporting software that can be acquired from HPE or by external sources that can help gather and interpret performance and capacity metrics, IntelliMagic Vision provides the best combination of ease of setup, intelligent adjustable thresholds, ease of use, and sophisticated reporting capabilities. If you would like to see a demo of these capabilities for yourself, request a free trial here.
This article's author
 Tim Chilton
 Share this blog
Related 3PAR Resources
HPE 3PAR Performance Best Practices Guide
Learn ways to implement your 3PAR storage such that you have the best possible performance and resiliency in your environment.
Improve Collaboration and Reporting with a Single View for Multi-Vendor Storage Performance
Learn how utilizing a single pane of glass for multi-vendor storage reporting and analysis improves not only the effectiveness of your reporting, but also the collaboration amongst team members and departments.
A Single View for Managing Multi-Vendor SAN Infrastructure
Managing a SAN environment with a mix of storage vendors is always challenging because you have to rely on multiple tools to keep storage devices and systems functioning like they should.
Request a Free Trial or Schedule a Demo Today
Discuss your technical or sales-related questions with our availability experts today