
One of the most common calls a storage engineer receives is some variation on the theme of “my server is experiencing poor storage performance.” Poor storage performance, as perceived by the host, is typically caused by either a poor front-end performance caused by a poorly performing/misconfigured storage array or congestion on the SAN fabric.
The primary performance indicator for front-end performance is host port latency because this is a measure of how the end host perceives data flow. HPE 3PAR refers to this as service time measured in milliseconds. There are many components of the data path that can affect front-end performance, so high front-end latency can be indicative of problems elsewhere.
Typically, poor front-end performance is caused one or more things:
- Saturated front-end ports
- A low read cache hit ratio
- Back-end media utilization
Only front-end port saturation is directly caused by the front-end ports, so in this blog I will cover how to troubleshoot poor HPE 3PAR front-end performance caused by saturated front-end ports.
Analyzing Front-End Port Saturation on HPE 3PAR
Front-end port saturation occurs when a host port is at or near its rated throughput.
A good rule of thumb is that a 16 Gb/s (2000 MB/s) Fibre Channel port will start showing performance degradation at roughly 75% of its rated speed, or at 12.6 Gb/s (1500 MB/s), so it is preferable to keep peak port throughput beneath that figure.
Another thing to consider is how well balanced the array throughput is across configured front-end ports. This is especially true if you are depending on 3PAR’s port persistence feature to provide resilience in the event of a host port or node failure. For example, if port 0:1:1 failed, it’s partner port, port 1:1:1 would take over its workload. In this example, port 1:1:1 must have sufficient headroom to be able to take on that throughput and still be under the 75% threshold established earlier.
Figure 1 shows an example of an interactive, automatically generated HPE 3PAR Health Insights chart displaying the overall performance of a group of HPE 3PAR storage arrays. The red border indicates that at least one of the arrays has a performance exception and the red exclamation point shows that array 9450-857L is the culprit, as it has high read and write throughput.
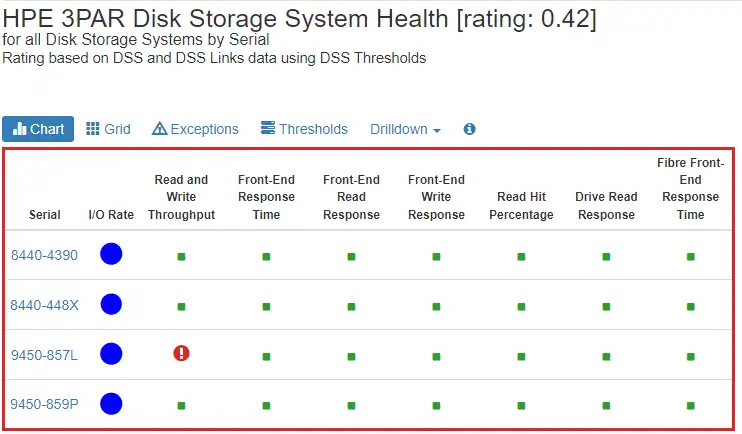
Figure 1: IntelliMagic Vision HPE 3PAR Health Insights Chart
Health Insights charts such as these make it easy to spot problem areas in your environment because the performance metrics are automatically assessed at each time interval. This automatic assessment allows even someone without a storage performance background to see where issues exist.
By clicking on either the red warning symbol or the Serial name, 9450-857L, we automatically drill down to the next step in the troubleshooting process, as shown in Figure 2.
Front-End Port Saturation Caused by High Read and Write Throughput
In this Read and Write Throughput chart, you can see that the overall read and write throughput for this array is high (referred to as a ‘performance exception’), as indicated by the red border around the chart. The performance exception was generated because the overall throughput spent a considerable time in the warning band of the chart (the light gray area of the chart).
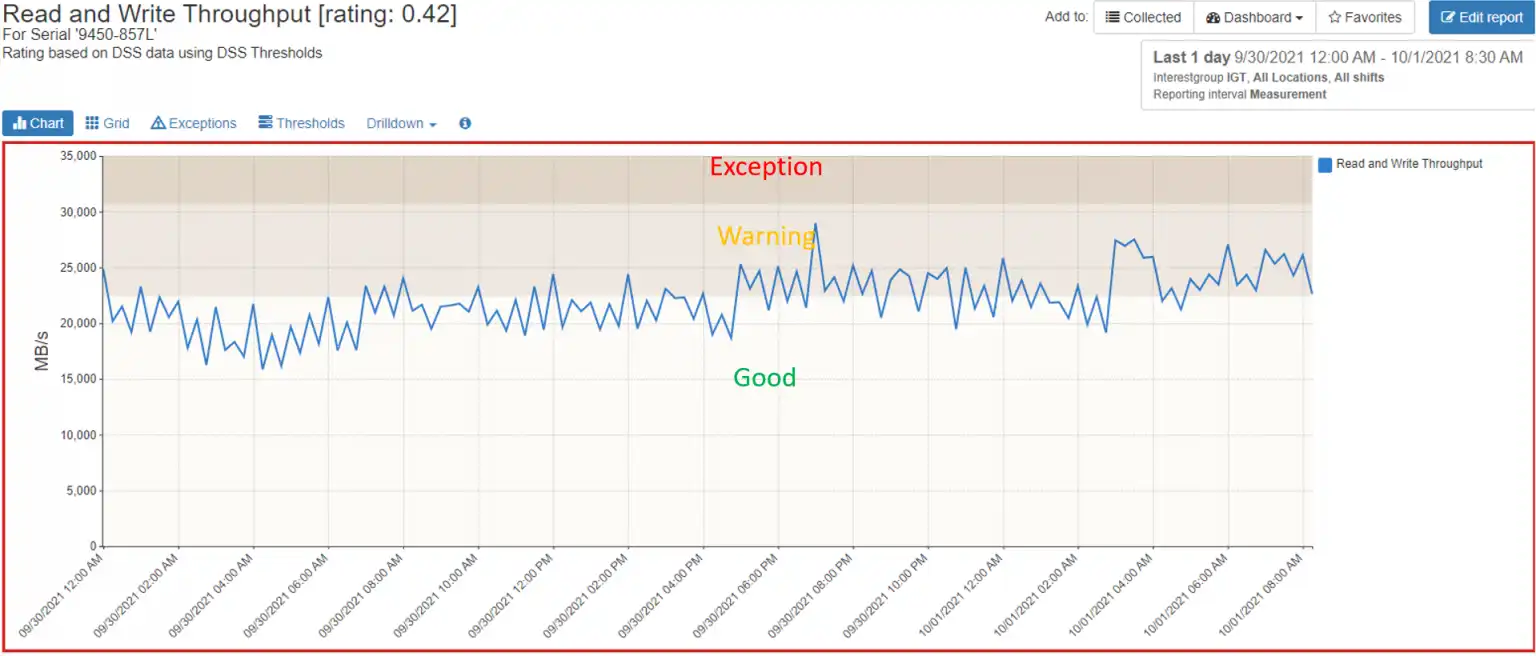
Figure 2: Read and Write Throughput Exception Interactive Chart with IntelliMagic Vision
In this example, the thresholds that determine whether throughput is high take into account not only the capabilities of the storage array, but also the capabilities of the nodes and node HBA ports, giving a comprehensive look at array throughput performance. These pre-built, static thresholds are conservative out of the box, but can be adjusted to account for customer preferences. For metrics such as throughput and response time, dynamic thresholds are used instead.
Imbalanced Read and Write Throughput Workload
Continuing our troubleshooting root cause analysis journey, we can again click on the Read and Write Throughput line from Figure 2 and automatically drill down to the next step, as seen in Figure 3. Here, we can see the culprits of our front-end performance exception.
Four ports, 0:4:2, 1:4:1, 2:4:4, and 3:4:3, that are carrying a much higher workload than the other configured ports in the system.
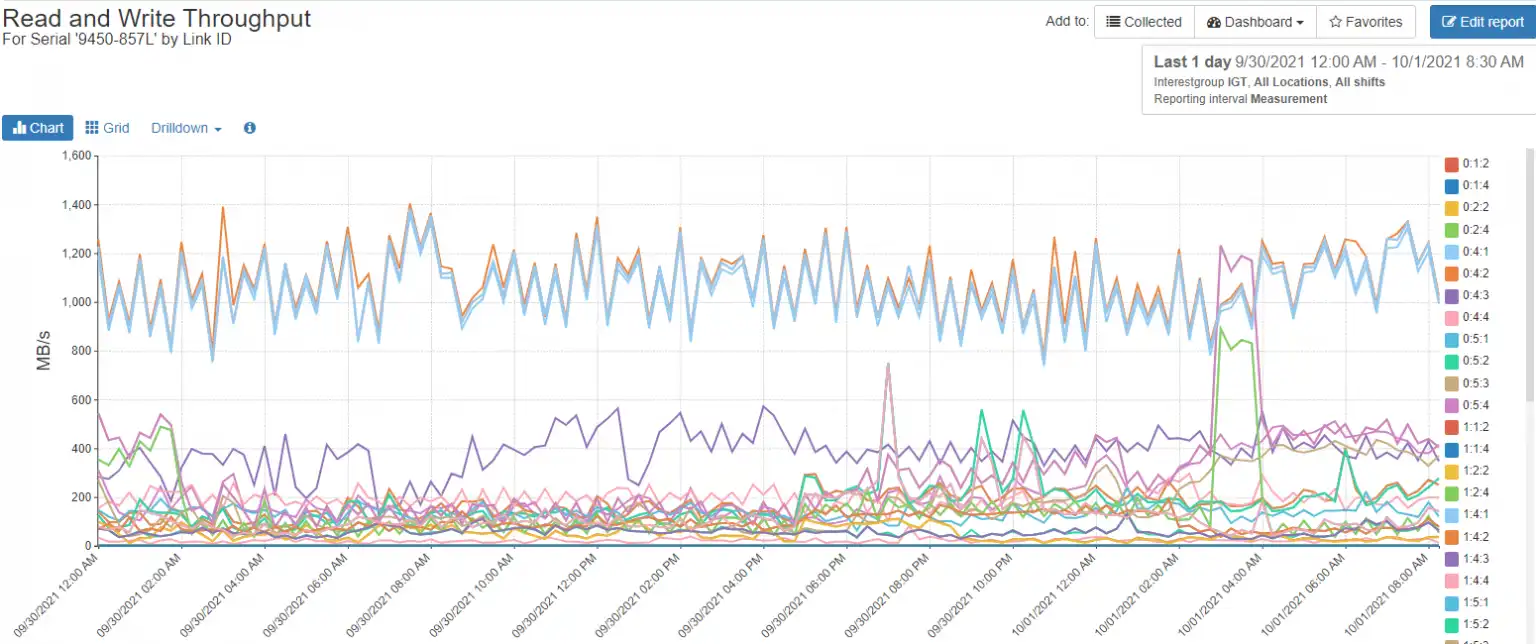
Figure 3: Imbalanced Read and Write Throughput Workload
These four ports reach nearly 80% utilization at peak. Figure 4 demonstrates the imbalance of these ports more clearly.
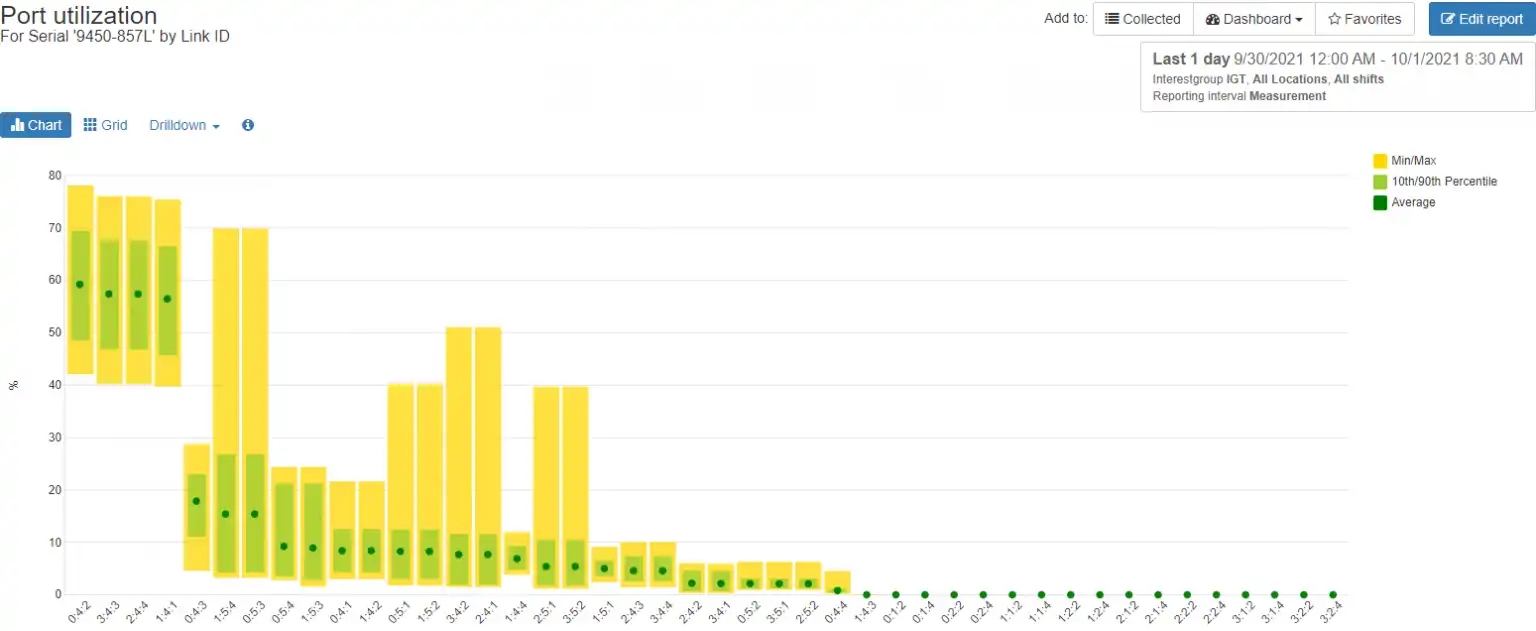
Figure 4: 3PAR Front-end Port Utilization Balance Chart Showing Port Imbalance
This figure is a balance chart, where the green dot indicates the average port utilization, the green box indicates the 10th and 90th percentile, and the yellow box indicates the minimum and maximum utilization for the host ports. Balance charts such as this can help one easily spot port imbalances.
In this case, the storage administrator should consider spreading the workload more evenly across the configured ports on this array so that there aren’t some ports that are overutilized while other ports are basically idle.
Keep Your 3PAR Running Optimally
In this case, the issue was front-end port saturation, but poor front-end performance can be caused multiple other factors, such as poor cache performance or overutilized back-end media. Any saturated component in the chain can impact the entire storage array and cause poor performance. Having easy access to pre-built, non-static reports with intuitive and interactive drilldowns is crucial for modern day performance analysis and can help you keep your HPE 3PAR systems running optimally.
The key to performance analysis is understanding the performance metrics that HPE 3PAR provides.
For an overview of the other key performance metrics, read my next blog, “Understanding HPE 3PAR Key Performance Metrics.”
This article's author
 Tim Chilton
 Share this blog
Related 3PAR Resources
HPE 3PAR Performance Best Practices Guide
Learn ways to implement your 3PAR storage such that you have the best possible performance and resiliency in your environment.
Improve Collaboration and Reporting with a Single View for Multi-Vendor Storage Performance
Learn how utilizing a single pane of glass for multi-vendor storage reporting and analysis improves not only the effectiveness of your reporting, but also the collaboration amongst team members and departments.
A Single View for Managing Multi-Vendor SAN Infrastructure
Managing a SAN environment with a mix of storage vendors is always challenging because you have to rely on multiple tools to keep storage devices and systems functioning like they should.
Request a Free Trial or Schedule a Demo Today
Discuss your technical or sales-related questions with our availability experts today