
z/OS performance analysts must deal with a lot of complicated issues that make their difficult job harder. One of those is trying to determine whether a specific z/OS workload or utilization change is a one-time anomaly that likely won’t result in any availability issue, or if it is a change that needs to be monitored or promptly addressed before a problem occurs.
Because the workload and utilization of the z/OS infrastructure components vary over time, it is not straightforward to determine if a specific change can be considered “normal” or if it is an indication of a (future) problem. With IntelliMagic Vision’s latest rollout of z/OS Anomaly Detection, or Change Detection, a performance analyst can easily accomplish this task.
Anomaly Detection allows performance analysts to automatically detect workload and application changes, saving them countless hours of manual labor and intensive scrutiny while trying to determine the significance of changes, such as:
- When a new application is brought online
- When a new version of an existing application behaves differently
- When there is a problem with a started task
- When important workloads or transactions deviate from the norm
Automatically Detect Significant z/OS Workload Changes
For hundreds of important metrics in the z/OS infrastructure it is now possible to automatically detect significant changes on any selected day, as compared to a reference period of 30 days. This includes important changes in hardware, middleware and other z/OS components.
Anomaly Detection calculates not only the averages for every z/OS infrastructure metric, but also the standard deviations and compares the current values with these statistics. Statistical approaches help save CPU time and MSU’s by being able to quickly see when something new comes online or when new application versions are less efficient.
Statistical approaches help save CPU time and MSU’s by being able to quickly see when something new comes online or when new application versions are less efficient.
And the added benefit is the contextual information available through simple drilldowns.
With this new capability, the question, “Is this workload change normal?” can be investigated and answered with relative ease. For each metric, we can investigate workload changes, compare them to our standard reference period, and easily gauge the significance of each change without the need to manually code or run statistical analysis on each metric.
Figure 1 below shows an example of an Anomaly Detection report for “DSS Changes.”
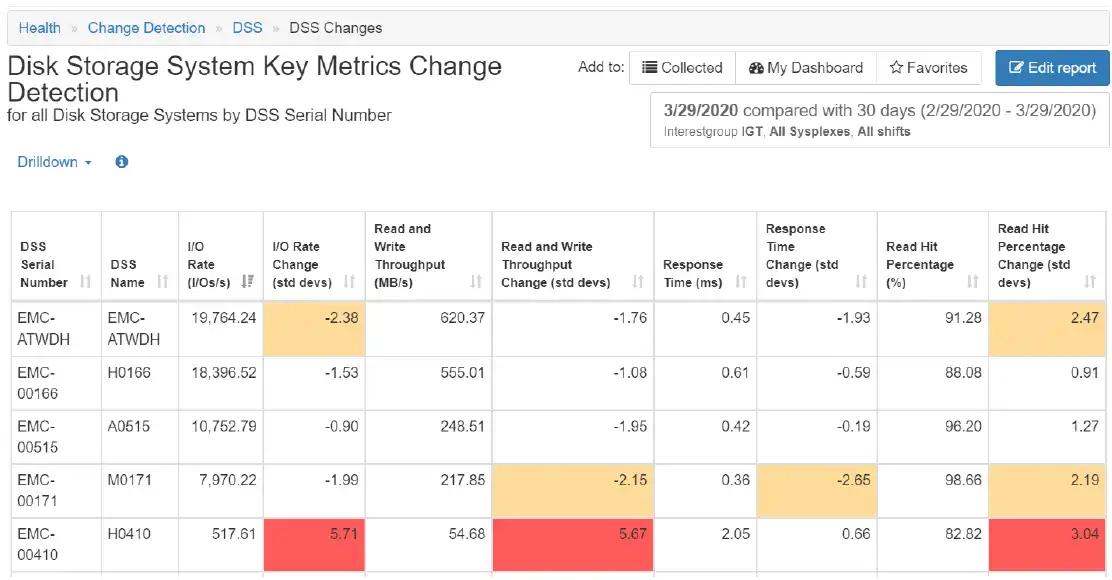
Figure 1: Disk Storage System Change Detection Table
The table represents the standard deviation of change from a single day compared to a reference period of 30 days. For each metric (e.g. I/O Rate) two values are shown: the measured value for the selected single day and the difference in number of standard deviations (std devs), also known as the z-score, as compared to the reference period.
A positive std devs value means the selection period’s average is higher than the reference period’s average, and a negative value means the selection’s average is lower.
- A value between -2 and +2 indicates that the “I/O Rate” for the selection period is in line with the “I/O Rate” pattern during the reference period.
- A value that is between -3 and -2 or between +2 and +3 indicates a notable change and is marked as yellow. This may merit an investigation.
- If the value is -3 or less, or +3 or more, the “I/O Rate” for the selection period is substantially different. These values are marked as red.
As indicated by the red filled cells, the change for I/O Rate, Read and Write Throughput, and Read Hit Percentage for the last DSS is so remarkable that it is wise to investigate.
Investigating Significant z/OS Workload Changes with Drilldowns
As is the case throughout IntelliMagic Vision, to further investigate a warning or exception found in one of the reports or tables, you can drilldown with a simple click on the report, line, metric, or exception you wish to investigate.
From Figure 1, we would like to investigate the DSS with the serious changes highlighted. We do this by clicking on the row with the exception to show the local menu. This takes us to Figure 2: a set of small charts representing the different metrics in the Anomaly Detection table.
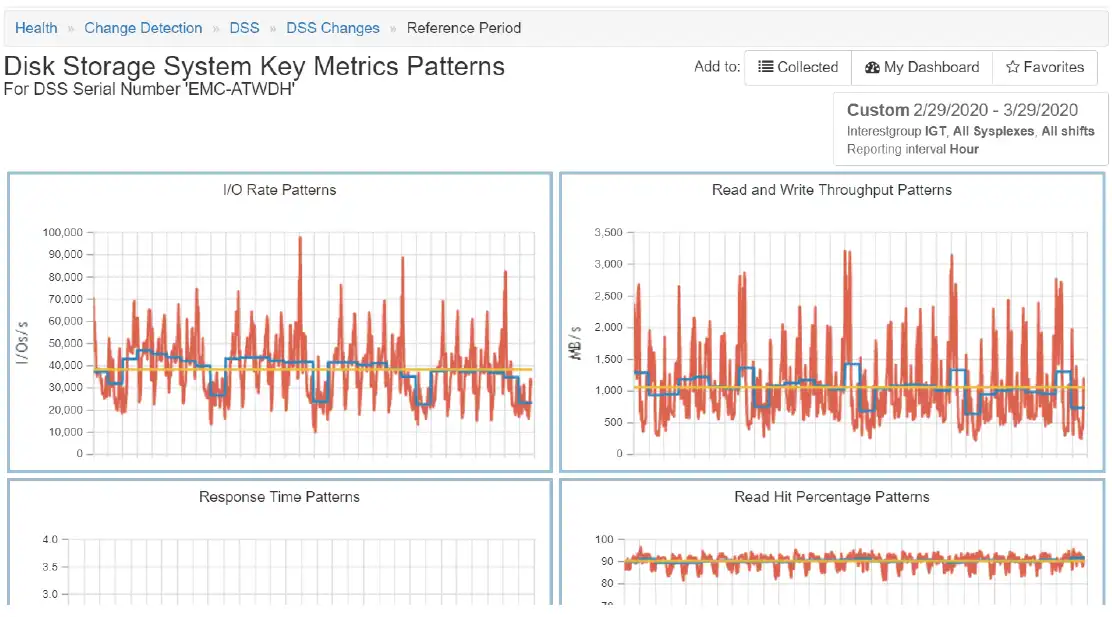
Figure 2: Drilldown to overview of all metrics for DSS with highlighted changes
We can also further zoom into one of these metrics by clicking on the chart as indicated in Figure 3.
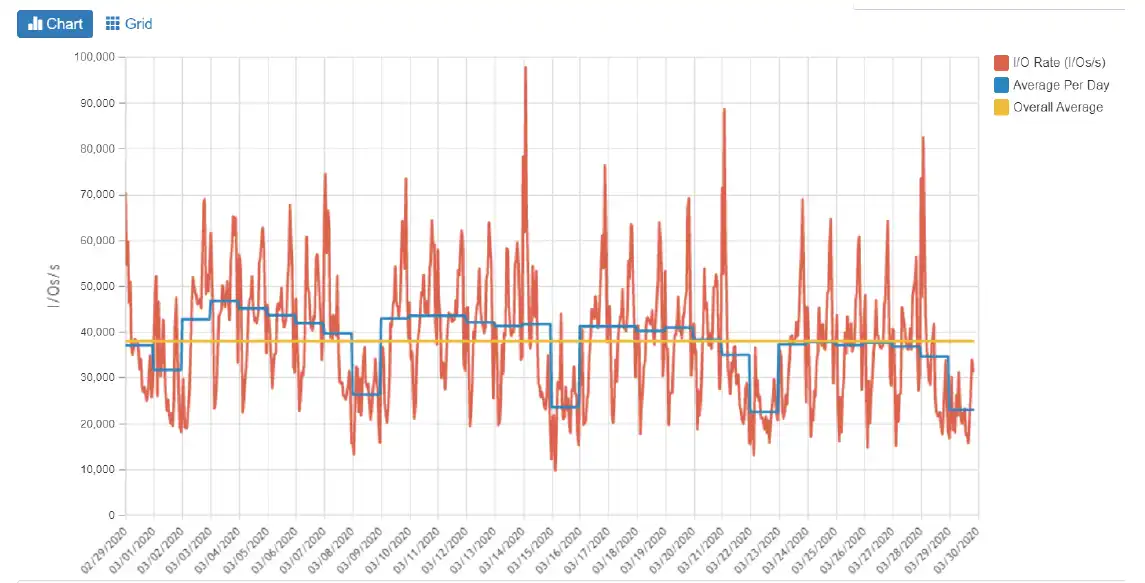
Figure 3 : Drilldown to “Reference Period” – Selection of one metric
Figure 3 shows us three curves:
- The yellow straight line represents the overall average for the whole reference period of 30 days.
- The blue curve shows the averages per day. Note that you can often see a weekly pattern here.
- The red curve shows the measured values for each time interval, for instance 15 minutes.
Outside of the drilldown shown above, there are many other options for investigating, comparing, and drilling down into detected changes with a very high or very low z-score.
Answering the Question: “Is this change normal?”
With the addition of z/OS Anomaly Detection to IntelliMagic Vision, performance analysts now have a powerful new tool under their belt.
For years, IntelliMagic’s built-in-expert-knowledge has been empowering analysts to proactively prevent availability and performance exceptions from occurring in their z/OS environments. With the introduction of Anomaly Detection, analysts can combine the proactive with near-real-time change detection as soon as the z/OS metrics are loaded.
When it comes to answering, “Is this workload or utilization change normal, or not?” the answer is now just a few clicks away from being answered.
MQ Statistics - Learning From SMF
This article is designed to introduce you to the types of insights that are available through SMF data with a focus on the SMF 115 MQ Statistics data. After reading, you will have a better understanding of how MQ functions.
This article's author
 Morgan Oats
 Share this blog
You May Also Be Interested In:
What's New with IntelliMagic Vision for z/OS? 2024.2
February 26, 2024 | This month we've introduced changes to the presentation of Db2, CICS, and MQ variables from rates to counts, updates to Key Processor Configuration, and the inclusion of new report sets for CICS Transaction Event Counts.
A Mainframe Roundtable: The Leaders | IntelliMagic zAcademy
Join industry leaders as they discuss the evolution of mainframes, sharing personal experiences, challenges, and future insights, along with practical advice from their careers in the Z ecosystem.
The Total Economic Impact of IBM Z IntelliMagic Vision for z/OS
Discover the benefits of IBM Z IntelliMagic Vision for z/OS. Watch the webinar for insights on cost savings, risk reduction, and ROI.
Book a Demo or Connect With an Expert
Discuss your technical or sales-related questions with our mainframe experts today