Optimize Your z/OS Environment for Availability & Cost Efficiency with IntelliMagic Vision
IntelliMagic Vision ensures that your z/OS Systems environment is optimized for performance and optimized for cost efficiency, all in the same solution.
View the following video for an example of that visibility.

Reduce CPU and Lower MLC Costs in Your Environment
IBM Monthly License Charges (MLC) consistently make up the largest component of the budget for mainframe installations and continue to rise, on average, 4% every year. Optimizing and lowering these costs can save your business substantial money.
Using IntelliMagic Vision, you have the option to take advantage of IntelliMagic experts who will consult with you about your unique environment and determine if potential MLC savings are possible. Many sites of all sizes have found significant MLC reduction opportunities through this assessment.
CPU cycles spent waiting for data and instructions to be staged into Level 1 processor cache make up a significant portion of CPU consumption on z13, z14, and z15 processor architectures. This highlights the importance of having excellent visibility into processor cache metrics so that you can identify any potential opportunities to improve cache efficiency and thus reduce CPU.
Often sites that have optimized other aspects of their environments for MLC savings are still able to find significant savings through processor cache optimization.
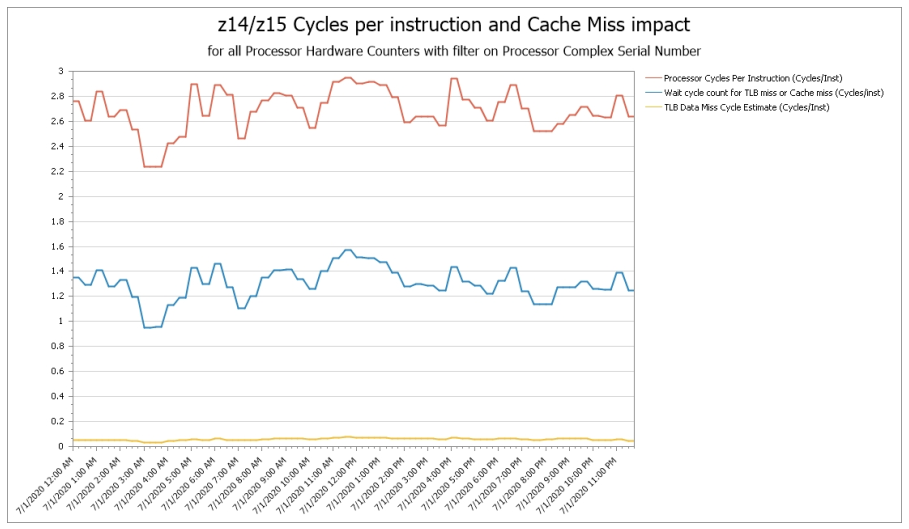
Distribution of Cycles per Instruction
Cycles Per Instruction can be divided into “Instruction Complexity CPI”, the area above the blue line that reflects “productive” cycles executing the instructions in a business workload, and “Finite CPI”, the area below the blue line that represents “unproductive” CPU cycles spent waiting for data and instructions to be staged from processor cache or memory into Level 1 cache.
These “waiting on cache” cycles represent a very significant portion of overall CPI and shows the magnitude of the potential opportunity for CPU and MLC reduction if improvements in processor cache efficiency can be achieved.
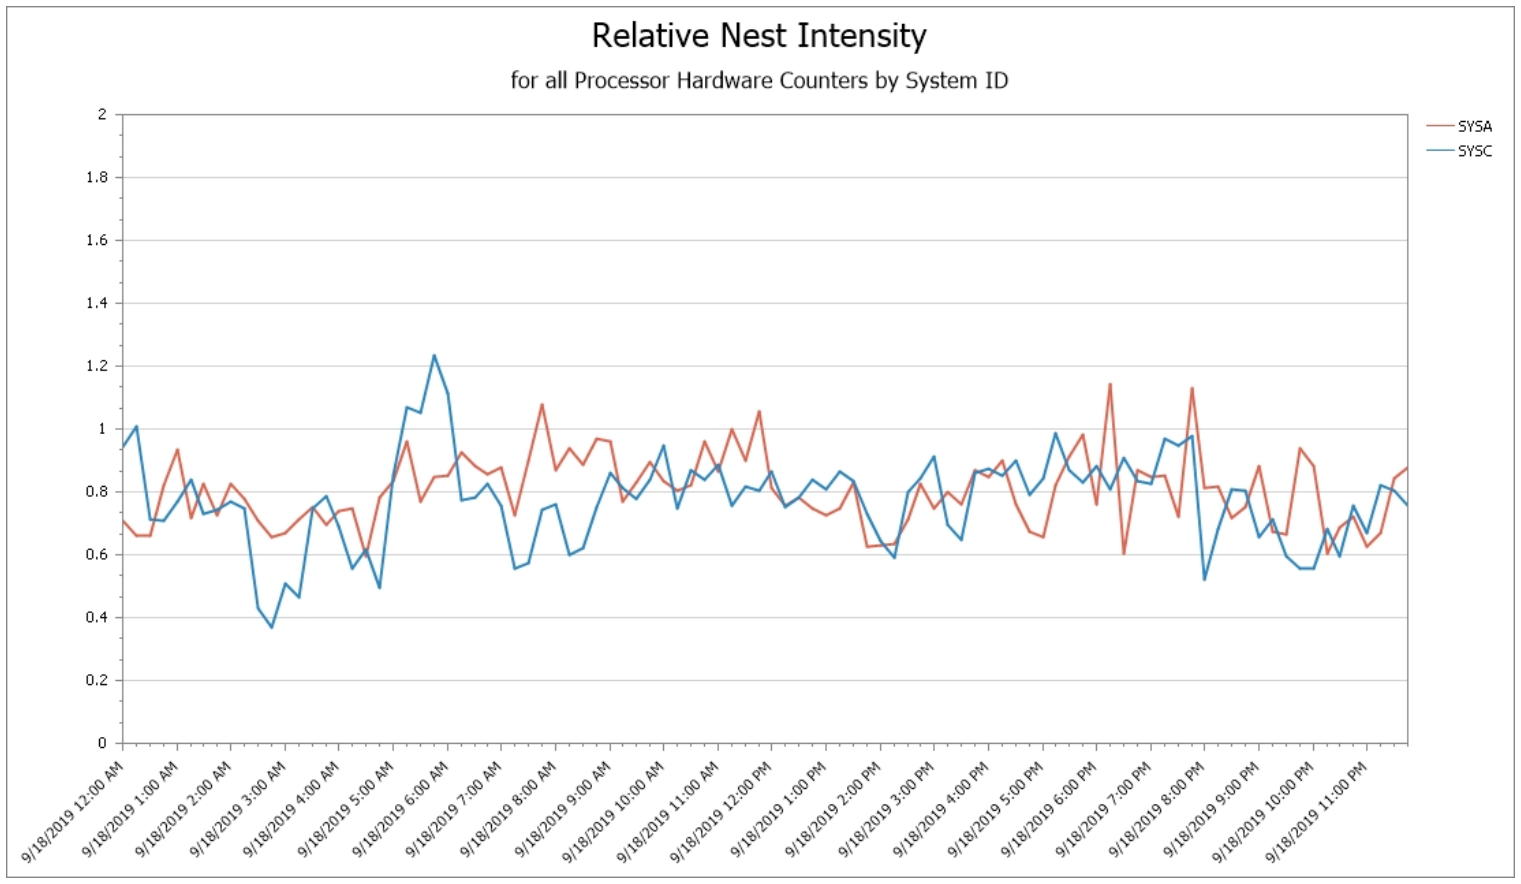
Relative Nest Intensity (RNI) by System
RNI quantifies how deep into the shared processor cache & memory hierarchy (called the nest) the processor needs to go to retrieve data and instructions when they are not present in Level 1 cache.
RNI is used (along with Level 1 Miss Percentage) to categorize a workload as High, Medium, or Low in the demand it places on the processor cache hierarchy. This workload classification is used to select the appropriate estimate of relative processor capacity from the IBM Large Systems Performance Reference (LSPR) chart.
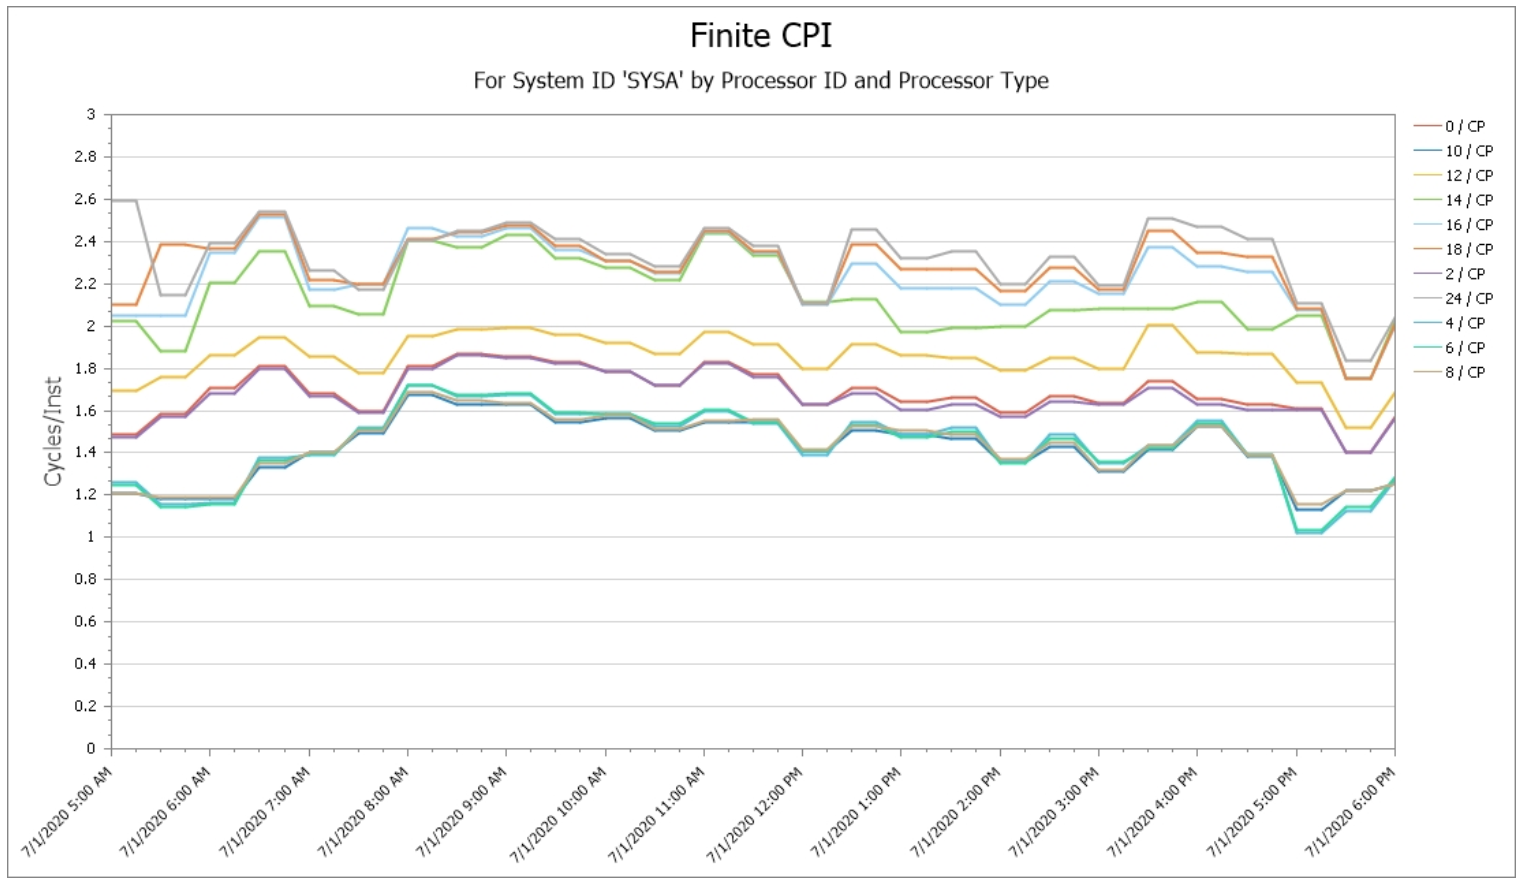
Finite CPI by Logical Processor
One characteristic of a workload that is important to be aware of is the increase in Finite CPI (“waiting cycles”) for the work not executing on Vertical High logical CPs. This “penalty” reflects the negative impact of contention for processor cache from workloads belonging to other LPARs. If there is a significant penalty, it is immediately apparent on this chart as reflected by a big gap in values separating the Vertical Highs from the Vertical Mediums and Lows.
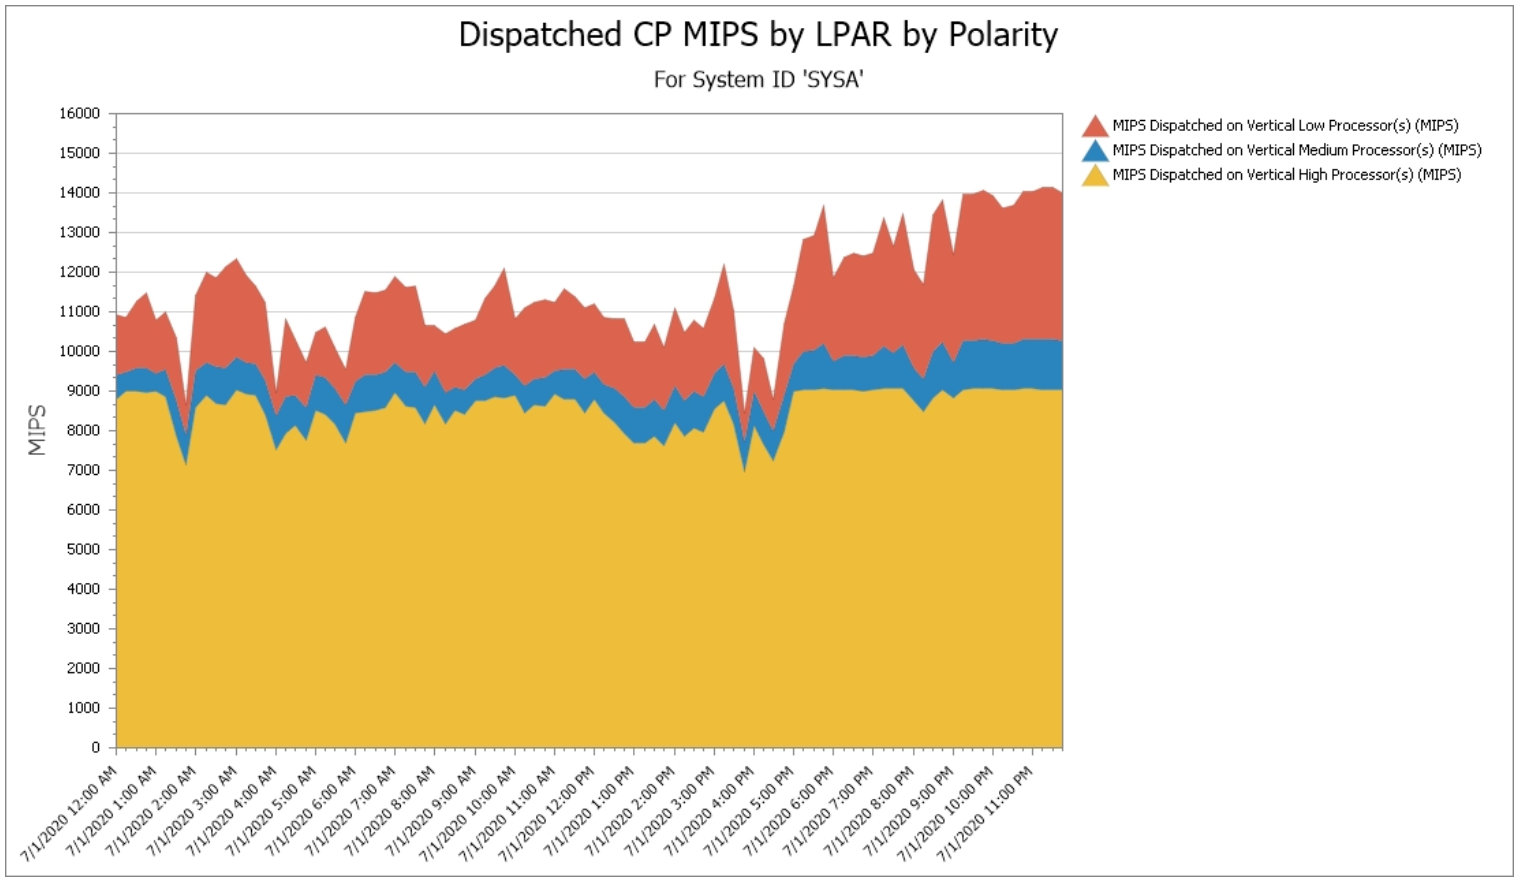
MIPS by Polarity
Another important consideration to combine with the Finite CPI “penalty” is the size of the work that is not executing on Vertical Highs. This view quantifies the workload MIPS executing on Vertical Mediums (in blue) and Vertical Lows (in red).
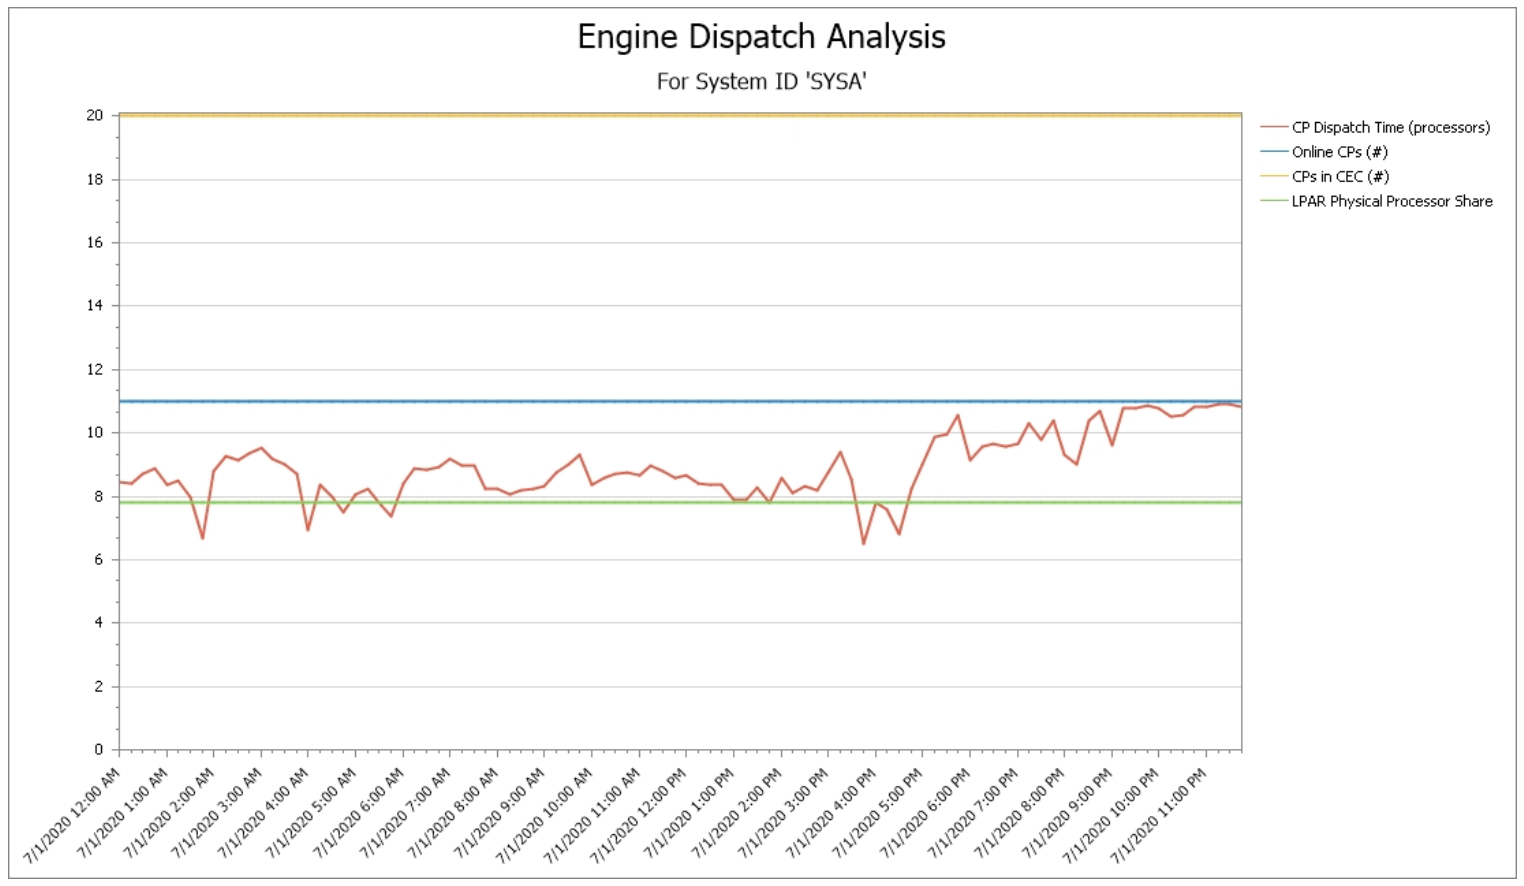
Engine Dispatch Analysis
This Engine Dispatch Analysis view is regularly recommended in conference presentations, combining four variables to consider in managing LPAR configurations.
- Number of physical CPs on the CPC (in yellow)
- Number of logical CPs for the selected LPAR (in blue)
- LPAR guaranteed share (in green), which is a function of the LPAR weight and the number of physical CPs
- Actual CPU consumption in units of CPs (in red)
Work runs most efficiently (from a processor cache perspective) when it runs within its LPAR share, because then it executes on VHs and VMs, and it avoids use of vertical lows except for occasional workload spikes.
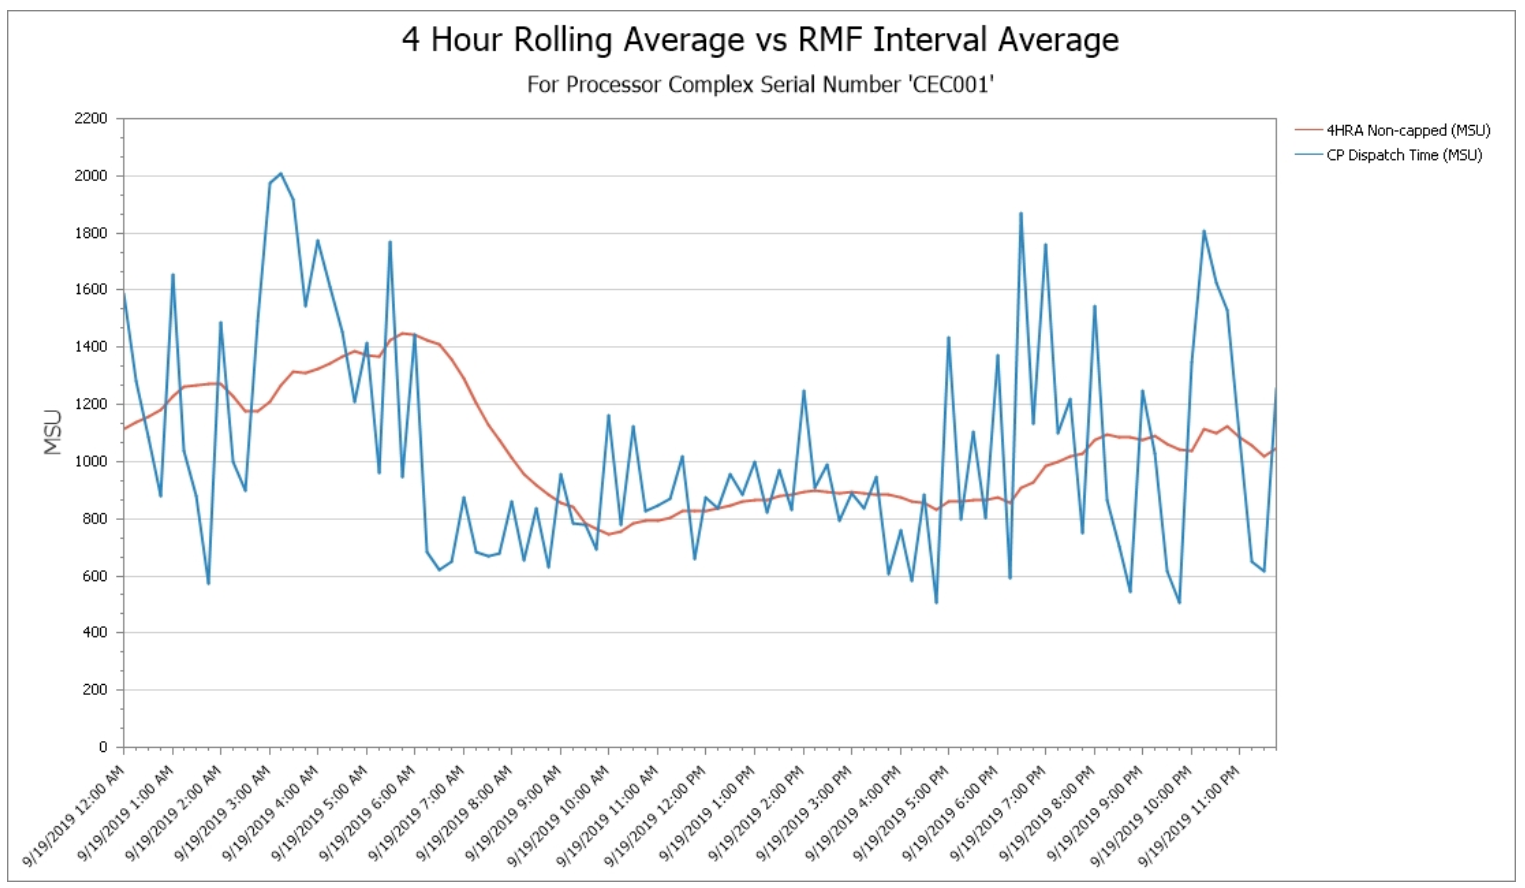
Complete Reports for 4-Hour Rolling Average
In addition to processor cache efficiency considerations which may help reduce overall CPU, another important area of analysis when seeking to reduce MLC expense is identification of the workloads executing during the monthly peak. In this example, work executing during the 3-4 AM interval (blue line) drove the peak 4HRA that occurred around 6 AM.
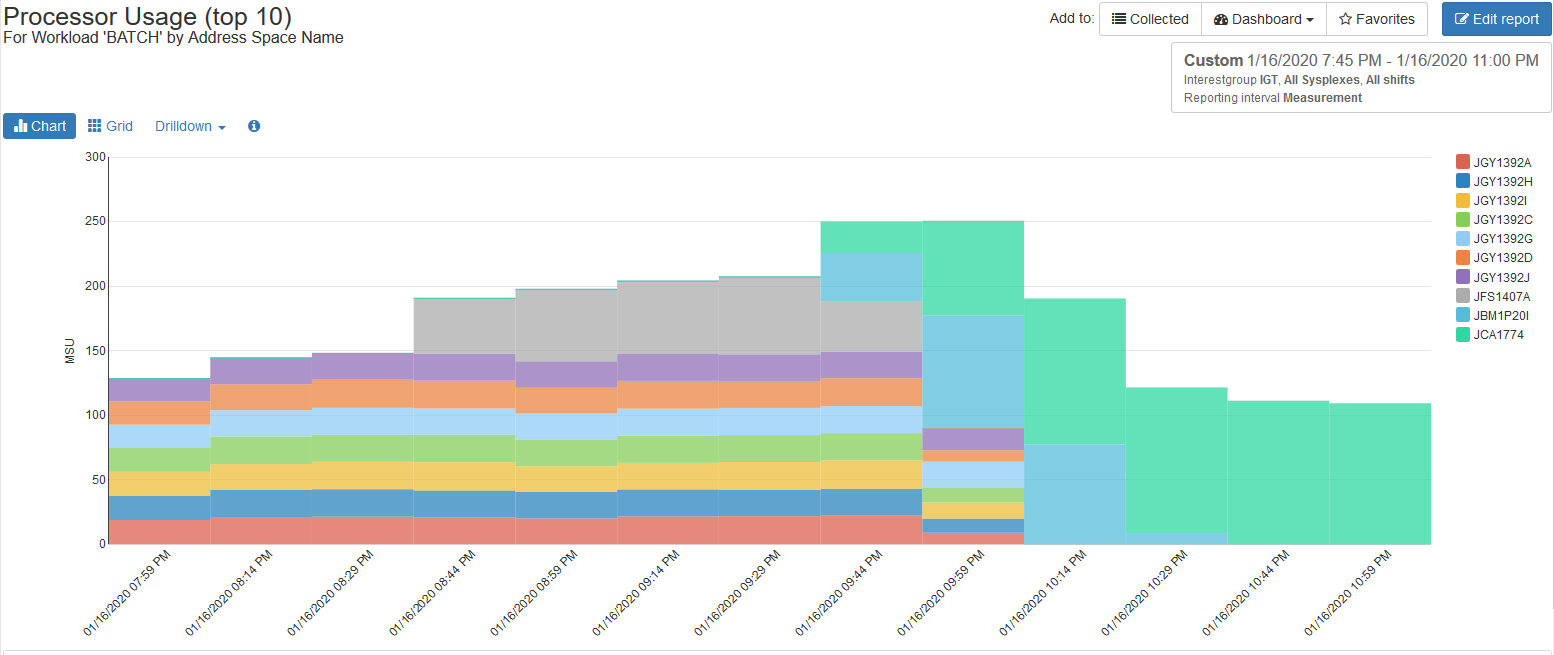
Dynamic Drilldowns into Peak CPU Consumption
Investigation into whether work executing during the monthly peak could have been relocated to run at a different time is greatly aided by dynamic navigation and context-sensitive drilldown capabilities. This example drills down into the Batch workload to identify the top CPU consuming address spaces during the interval of interest.
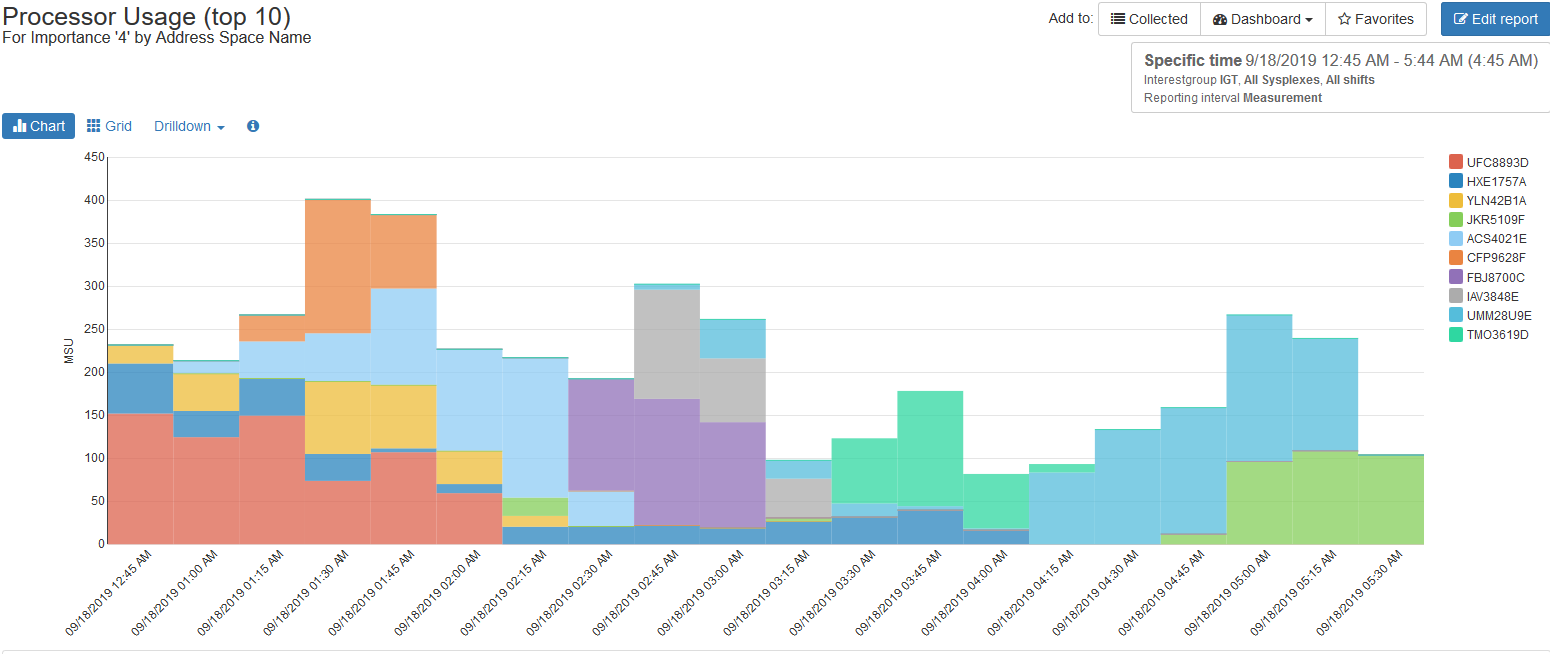
CPU Consumption by WLM Importance Level
Another approach that can be helpful in analyzing work executing during monthly peak intervals is to drill down to identify work executing in lower WLM importance levels. This example identifies top CPU address spaces executing in WLM importance level 4 during the selected interval.
Flexible Deployment and Monitoring

In the Cloud
Cloud based deployment can be accessed from everywhere in the world and is easy to share with colleagues

Services and Support
Take advantage of IntelliMagic's experienced performance experts for standalone custom services or daily monitoring

On Premise
Install the software on premise and use it offline for total control of your installation
zSystems Performance Management
Optimize z/OS Mainframe Systems Management with Availability Intelligence
Benefits
Optimize z/OS Systems performance management using AI-driven analytics to proactively monitor and manage your z/OS environment, prevent disruptions, reduce costs, and preserve the reliability and availability that mainframes are known for.
Explore z/OS Systems Performance Analytics
Db2 Performance Management
Prevent Availability Risks and Optimize Db2 Performance
Benefits
The volume and complexity of Db2 Statistics data and Db2 Accounting data creates a major challenge for analysts who want to derive value from the rich metrics available.
Easy visibility into key Db2 metrics through SMF records is crucial to proactively prevent availability risks and to effectively manage and optimize performance.
Explore Db2 Performance Analytics
Easy visibility into key Db2 metrics through SMF records is crucial to proactively prevent availability risks and to effectively manage and optimize performance.
CICS Performance Management
Monitor and Profile CICS Transactions and Regions with IntelliMagic Vision
Benefits
CICS SMF Transaction data is a rich source of performance insights, but its volume can make analysis challenging using traditional approaches that rely on static reports. Proactive assessment of key Statistics metrics across all regions is essential to identify potential risks to availability.
IntelliMagic Vision enables performance analysts to manage and optimize their z/OS CICS transactions more effectively and efficiently, as well as proactively assess the health of their CICS regions.
Explore CICS Performance Analytics
IntelliMagic Vision enables performance analysts to manage and optimize their z/OS CICS transactions more effectively and efficiently, as well as proactively assess the health of their CICS regions.
Virtual Tape Performance Management
Proactively Manage Virtual and Physical Tape Environments
Benefits
With tape virtualization, tape storage became easier and more economical, but at the same time, more difficult to understand which changes or hardware upgrades are the best choices. With tape libraries being shared across multiple z/OS images, the full picture can only be obtained by aggregating workload and tape hardware information from all z/OS LPARs.
IntelliMagic Vision enables performance analysts to manage and optimize their z/OS Virtual Tape environments more effectively and efficiently.
Explore Tape Performance Analytics
IntelliMagic Vision enables performance analysts to manage and optimize their z/OS Virtual Tape environments more effectively and efficiently.
Disk & Replication Performance Management
Automatically Detect Disk Performance Risks & Quickly Resolve Issues
Benefits
As Disk speeds and throughputs have increased, z/OS applications have come to rely on fast and consistent storage performance. To respond quickly to unexpected disk and replication issues, it is essential that you have insight into the health of the various components in your storage environment.
IntelliMagic Vision enables performance analysts to manage and optimize their z/OS Disk and Replication environment more effectively and efficiently.
Explore Disk Performance Analytics
IntelliMagic Vision enables performance analysts to manage and optimize their z/OS Disk and Replication environment more effectively and efficiently.
MQ Performance Management
Optimize and Analyze MQ Activity and Performance
Benefits
MQ is widely used across z/OS environments, but sites often find it challenging to derive the valuable performance insights potentially available from MQ SMF Statistics and Accounting data due to limitations in existing reporting and available tooling.
IntelliMagic Vision enables performance analysts to manage and optimize their z/OS MQ configurations and activity more effectively and efficiently, as well as proactively assess the health of their queue managers.
Explore MQ Performance Analytics
IntelliMagic Vision enables performance analysts to manage and optimize their z/OS MQ configurations and activity more effectively and efficiently, as well as proactively assess the health of their queue managers.
z/OS Network Performance Management
Automatically Monitor Mainframe Network Security and Protect Your Data
Benefits
TCP/IP is the core of the communication for the z/OS mainframe, both for traffic into and out of the mainframe and internal communication among z/OS images and processor complexes. Proper management is necessary to secure and protect system availability.
IntelliMagic Vision automatically generates GUI-based, interactive, IBM best-practice compliant rated reports that proactively identify areas that indicate potential upcoming risk to TCP/IP health, performance, and security.
Explore z/OS Network Performance Analytics
IntelliMagic Vision automatically generates GUI-based, interactive, IBM best-practice compliant rated reports that proactively identify areas that indicate potential upcoming risk to TCP/IP health, performance, and security.
z/OS Connect: Modern Mainframe API Environment
Optimizing Mainframe API Monitoring for Improved Resource Management
Benefits
IntelliMagic Vision enhances mainframe API monitoring and profiling, providing crucial visibility to address issues at the API or service level, ultimately aiding performance analysts in better resource planning and management reporting.
Explore z/OS Connect Analytics
Book a Demo or Connect With an Expert
Discuss your technical or sales-related questions with our mainframe experts today