
Disk capacity reporting can be the bane of a storage engineer’s existence. Most enterprises have multiple storage vendors, each with their own quirks, such as reporting units (MB/MiB/GB/Tib, etc.). Storage pool capacity needs to be taken into consideration as well as other capabilities of the storage array, such as compression and deduplication. These reports often need to be at the storage array (DSS), storage pool, and storage tier level.
Creating an accurate report of your storage capacity at the current time can be challenging enough, but managers often need reports that predict future consumption in order to support ongoing and future corporate initiatives as well as accommodating organic growth.
These reports are typically created manually by using a spreadsheet to calculate the burn rate over a short time period and applying that burn rate to the current usable capacity. Table 1 below is an example of this method.
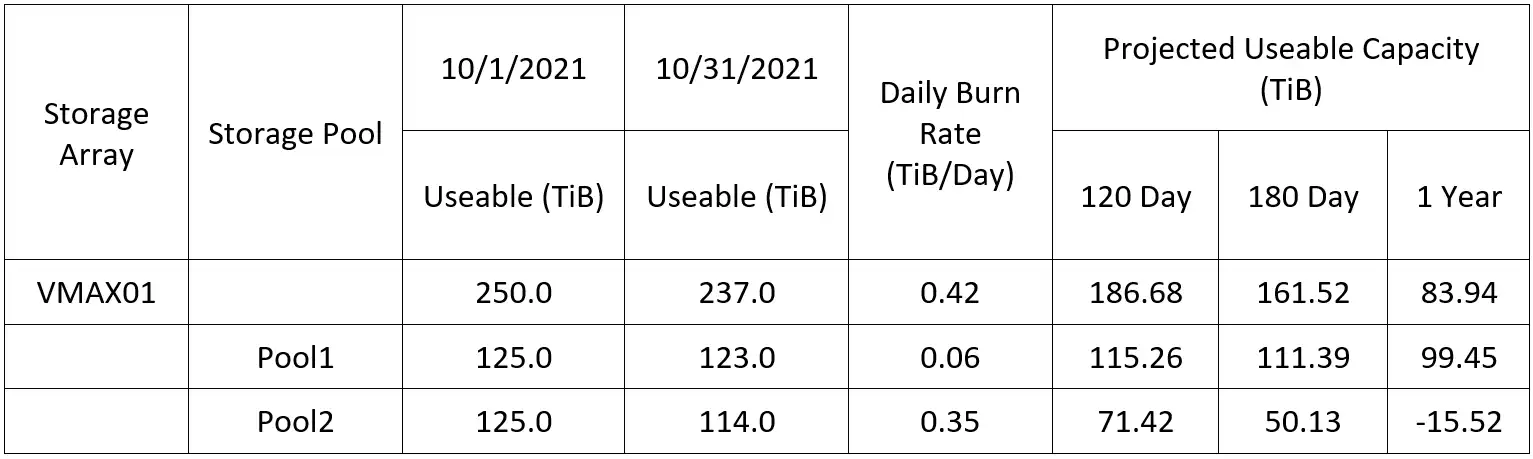
Table 1 – Manual Capacity Report Example
Why Static Capacity Burn Rates are Ineffective
Reports like this are unsuitable for a dynamic environment because they assume a static burn rate. Burn rates can be unstable in a dynamic environment. Introducing a new workload can cause a corresponding temporary spike in burn rate that, if projected forward in time, can result in a misleading capacity forecast.
Reporting in this manner is also inefficient. The data must be manually gathered, and then reporting units normalized and entered into a spreadsheet. This is a poor use of time, particularly in these days of reduced staff sizes.
A better way to do this is to use an AIOPs approach that automatically collects capacity data, normalizes the reporting units, calculates the burn rate, and presents the burn rate and predicts the time until running out of space in an easy to consume manner.
How to Use AI to Forecast Future Storage Consumption
Advanced AIOps can calculate time until running out of space by using a sophisticated algorithm that uses a double exponential moving average (DEMA) that examines long-running historical data but gives heavier weighting to the more recent data. This method considers both the most current burn rate and historical burn rate data for more accurate capacity forecasts.
Once this data is calculated, having it automatically presented in an easy consumable format is another crucial step to saving time and taking action. Figure 1 shows an example of this kind of advanced AIOps automatic burn rate calculation and visualization from IntelliMagic Vision.
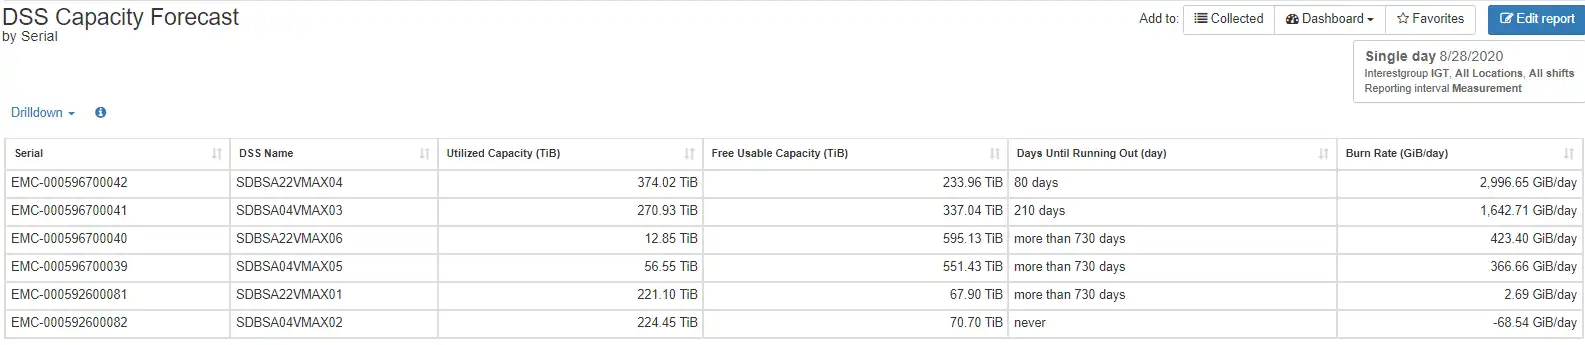
Figure 1- DSS Capacity Forecast showing Utilized and Free Usable Capacity, Days Running Out, and Burn Rate
With this type of easy-to-interpret visualization, actionable insights are easily derived. From Figure 1, we can easily see that storage array SDBSA22VMAX04 will run out of space in 80 days at the current burn rate.
Moving ever further from static reports, AIOps solutions also provide the ability to dynamically engage with and navigate through data. Continuing with this example from IntelliMagic Vision, by clicking on the storage array in the chart we automatically go to the next level of reporting, which in this case shows us which storage pools are contributing to the high burn rate as seen in Figure 2.
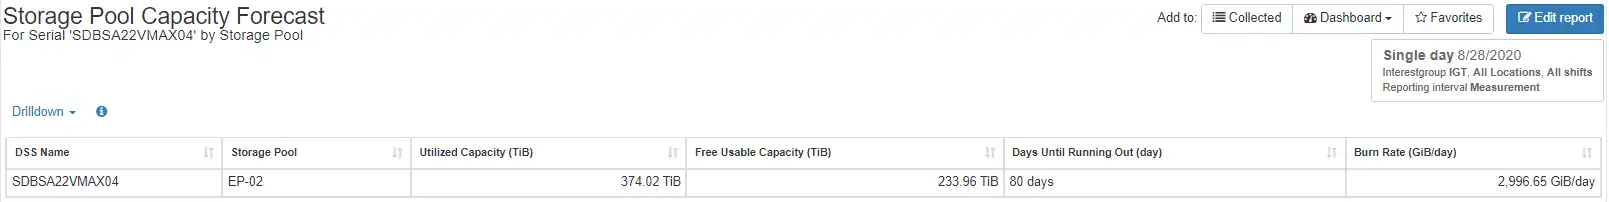
Figure 2 – Storage Pool Capacity Forecast
Since there is only one configured storage pool, . More information can be gathered by looking at the burn rate over time in a graphical format as seen in Figure 3.
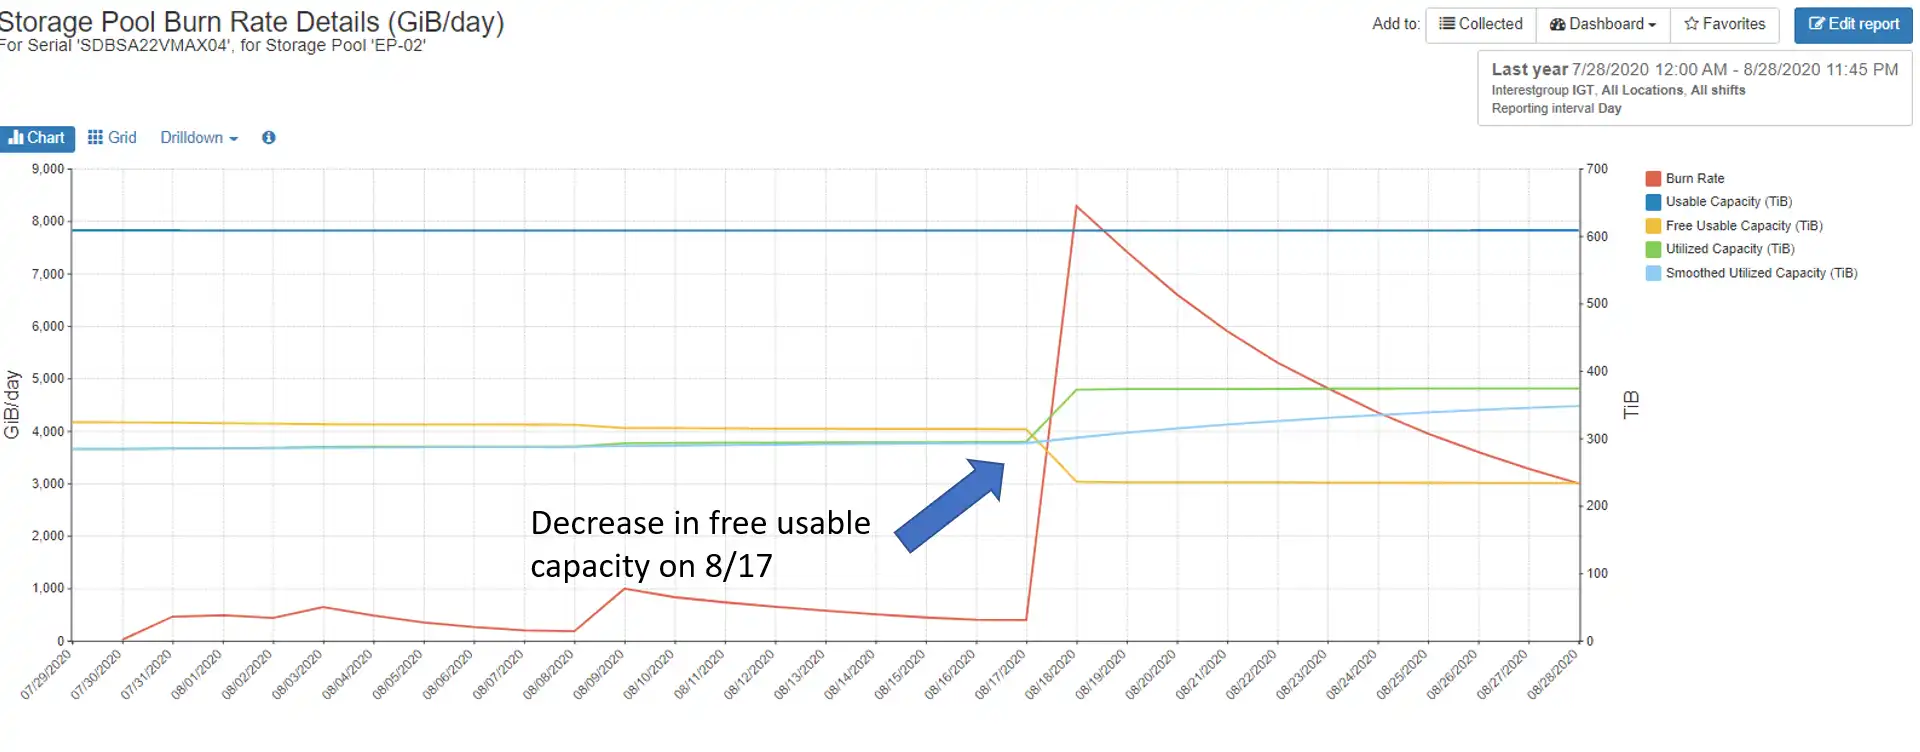
Figure 3 – Burn Rate Details
This report shows that there was ), with a commensurate increase in utilized capacity (green series). This large increase in utilized capacity over a short time cause the burn rate to spike during this period. Figure 4 shows how the spike in burn rate affected the time until running out.
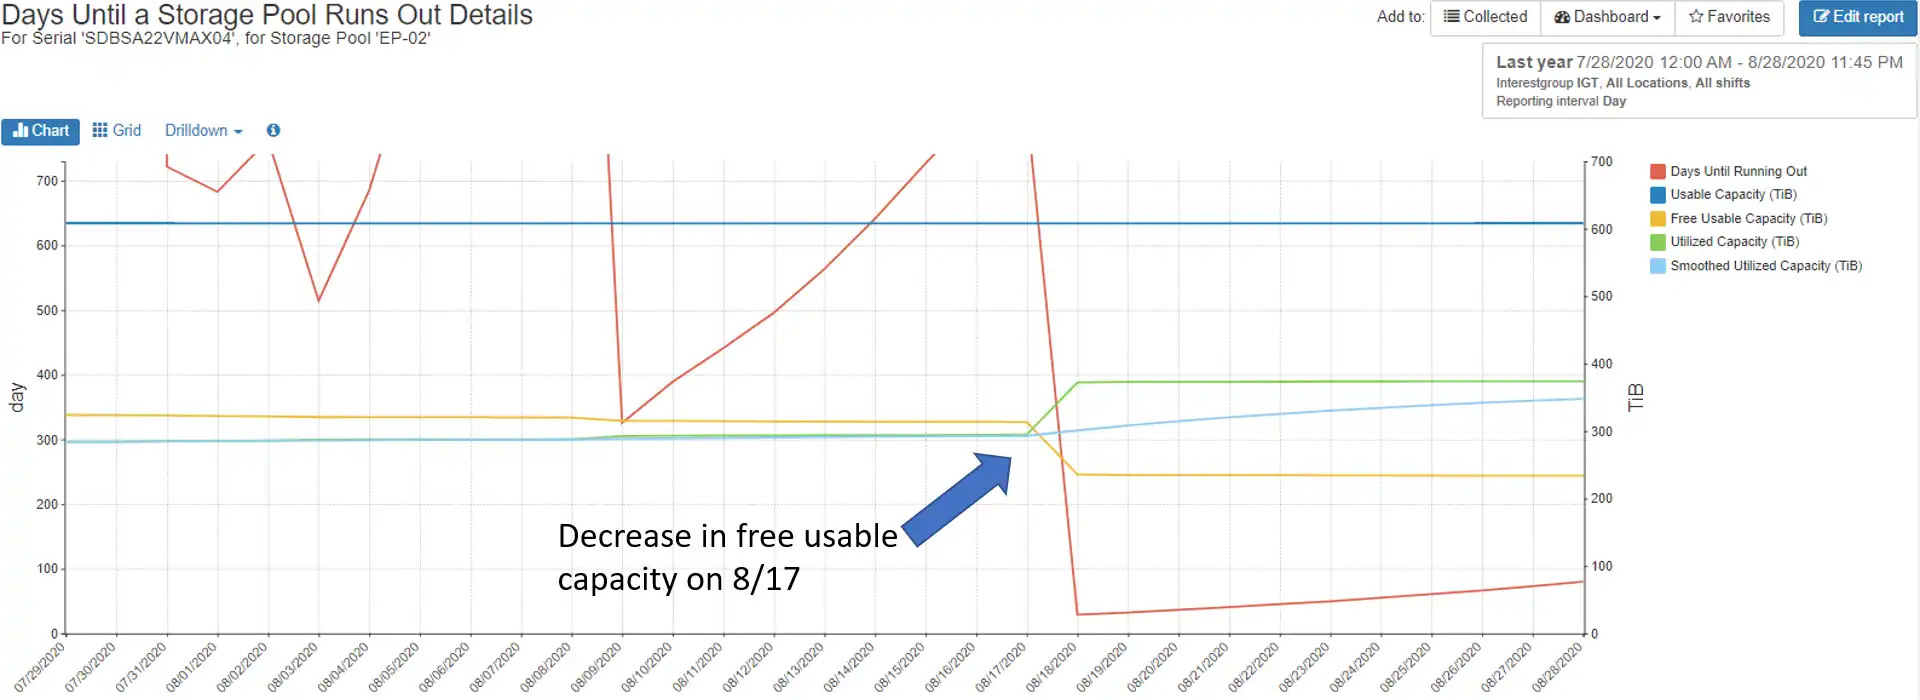
Figure 4 – Days Until Running Out Details
As 8/17 goes further into the past the days until running out slowly goes up and will eventually flatten. These reports are automatically updated with data gathered from the storage array, so there is no need to manually update the chart and the reports given to management are always up to date.
Put Away the 8 Ball and Utilize a Scientific Approach to Storage Capacity Planning
My old manager used to say static burn rates and reports with today’s dynamic workloads and environments are as useful as a Magic 8 Ball – it might be right some of the time, but you’re leaving a lot up to chance.
AIOps-generated automated capacity burn-down reports are more accurate, always up to date based on live data, and always available. Who couldn’t use more time in their schedule and happier management?
View the video below to see how advanced analytics can make storage capacity forecasting easier.

This article's author
 Tim Chilton
 Share this blog
Related Resources
Should There Be a Sub-Capacity Processor Model in Your Future? | IntelliMagic zAcademy
In this webinar, you'll learn about the shift towards processor cache efficiency and its impact on capacity planning, alongside success stories and insights from industry experts.
Easy Storage Capacity Forecasting and Planning
By utilizing an interactive GUI interface with an advanced AI-based statistical analytics engine, IntelliMagic Vision for SAN provides a simple but powerful means to forecast your storage capacity at multiple levels.
Overcoming Capacity Management Challenges for Accurate Burn Rates and Forecasting
Discover how to overcome capacity management challenges for more accurate capacity forecasting and burn rates.
Request a Free Trial or Schedule a Demo Today
Discuss your technical or sales-related questions with our availability experts today