Troubleshooting Infinidat Performance Issues
One of the most common issues with managing performance and capacity on Infinidat storage platforms is unequal distribution of the workload across the front-end ports.
In Infinidat systems, the front-end ports are typically connected at two hosts in groups of 6 ports. In an optimally functioning environment, a couple set of ports will have an equal workload.
In this video we examine an environment with 6 ports with even workloads, and 6 ports with almost none of the workload running on them. In environments with one very busy host, there may be nothing you can do to resolve this, but typically you want to distribute this workload across all the ports.
If you have ports that are running close to the maximum configuration and need to see how to quickly identify an imbalance and evenly distribute the workload across the ports, watch the video to see how.
IntelliMagic Vision for SAN allows you to monitor the performance, capacity, and configuration across your multi-vendor SAN storage, fabric, and VMware to ensure you meet your SLAs.

Video Transcript
I wanted to provide you a brief video to show you one of the most common things that we see on Infinidat platforms, that has to do with unequal distribution of the workload across the front-end ports.
The front-end ports are typically connected at two hosts in groups of six ports. So, let’s look at an example. I’m looking at port throughput for 12 ports on an array.
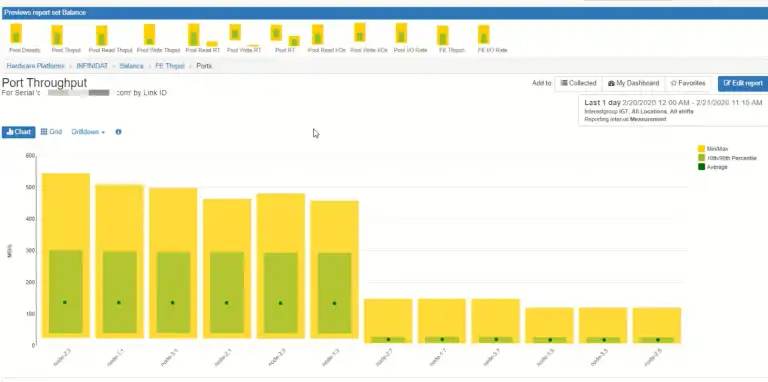
The average dot shows the average throughput for the time-period selected. You can see there are six ports with the same averages and the green rectangles show the 10th and 90th percentiles. So, you see that they are very evenly distributed in terms of the workload and the min/max is pretty much the same (the min/max is the yellow area).
I’m not concerned at all about within that subset of six ports – that’s good. What I’m concerned about is the fact that I’ve got six more ports that have very little workload now. This may be inherent to your environment if you have one really busy host. There’s not much you can do about this, but typically what you want to do, especially if you’re reaching peaks close to the 8 Gb max configured, you want to try to move some of the workload from the really busy ports to the other sets of ports.
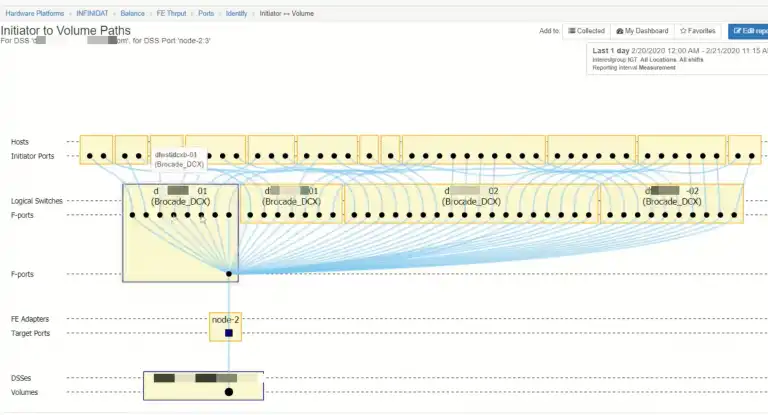
One way to do this is to look at a balance chart like this to see how well balances are. I’ve identified the imbalance and now I want to see for that host port what hosts are connected to it. So, I drill down and I’m looking at the ‘initiator to the volume’ and this shows me all of the hosts that are connected. What I can do then is look at the performance of each of these ports. It is a little bit painful I need to look at the performance of each of these, but each of these are associated with hosts.
I‘ll give you an example of just one to show the process: this host (it’s actually the switchboard that’s connected to the host in question) is only doing about 10 Mb a second. I can save this data and I can export this data. Essentially, I‘m going to go through and do analysis to figure out which port is driving the most load. Then, I‘m going to make some changes with regards to rezoning to move some of the lesser busy hosts over to the lesser busy sets of ports and leave the heavy hitter. This looks like one of the heavy hitters, so this is one of the hosts right here that is driving most loaded.
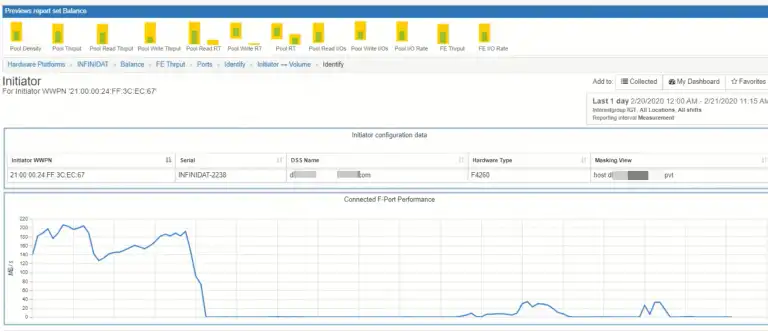 Probably leave it there and then I work on moving some of these other to really try to rebalance and optimize my front-end port utilization to get the most ‘bang for my buck’ on my Infinidat array in terms of the front-end capacity.
Related Resources
Why is my Ferrari of a Storage Array Running Like a Yugo?
Improperly configured hosts can suffer from poor performance even on high performing arrays. Like a sports car engine, modern arrays are finely tuned machines, but if fueled with inefficient input you can rob performance and make your Ferrari perform more like a Yugo.
Configuring Infinidat InfiniBox Fibre Channel for Optimal Performance
This whitepaper provides a brief overview of the Infinidat InfiniBox hardware and discusses some best practices for configuring your InfiniBox for optimal performance within an actual SAN infrastructure.
5 Things Every Storage Professional Should Be Checking - Prevent Fires Before They Start
This blog identifies five key areas that every storage professional should regularly check to identify and eliminate upcoming issues and, in turn, save time in the long run.
Request a Free Trial or Schedule a Demo Today
Discuss your technical or sales-related questions with our availability experts today