
As a storage professional, I’ve sometimes found myself stuck in reactive mode, fighting the current emergency and unable to find time to be proactive or to fulfill deliverables to which I’m committed. In order to break out of that mode, I used to set aside a few hours a week to take a holistic view of my SAN infrastructure to try to locate any smoldering issues before they caught fire.
In a heterogenous environment this was not always easy. Matching data formats from different arrays, adjusting timestamps from different time zones, etc. were often manual and, hence, error prone. If issues were found, I had to take the time to track them down to their root cause. All of these take precious time.
Although each storage vendor has specific requirements, at a high level there are five things that should be checked routinely that can help you spot and eliminate trouble spots before they flare up.
1) Review front-end host adapter and port balance on storage systems
Overloaded front-end host adapters can cause a bottleneck before the I/O enters the array. Things to check here are:
- Host adapter
- Are your host adapters operating at or near their rated capacity? A saturated host adapter can bottleneck I/O for all the hosts zoned to it.
- Is the load optimally spread across the host adapters? If you have one adapter that is carrying significantly more load than other adapters on the array, moving some of the workload from the heavily used adapter to a less used adapter can eliminate the bottleneck.
- Host adapter ports
- Are your host adapter ports connected to the fiber channel switch port at the proper speed? A 16G host port connected to a switch port at 4G will only be able to carry one quarter of the load that it is rated for. Finding and eliminating issues can prevent performance issues.
- Is the load properly balanced across the ports on the host adapter? If you have one host port that is at maximum load and the other port(s) on the adapter are carrying significantly less load, balancing the load across the host adapter ports can relieve the bottleneck.
IntelliMagic Vision makes it easy to spot such imbalances. Figure 1 shows an IBM SVC that has an I/O Group carrying almost 2x the throughput of the other I/O Group. This imbalance isn’t currently presenting an issue but could do so if hosts continue to be zoned to the array in an imbalanced manner. Balance charts are a great way to get a good look at this.
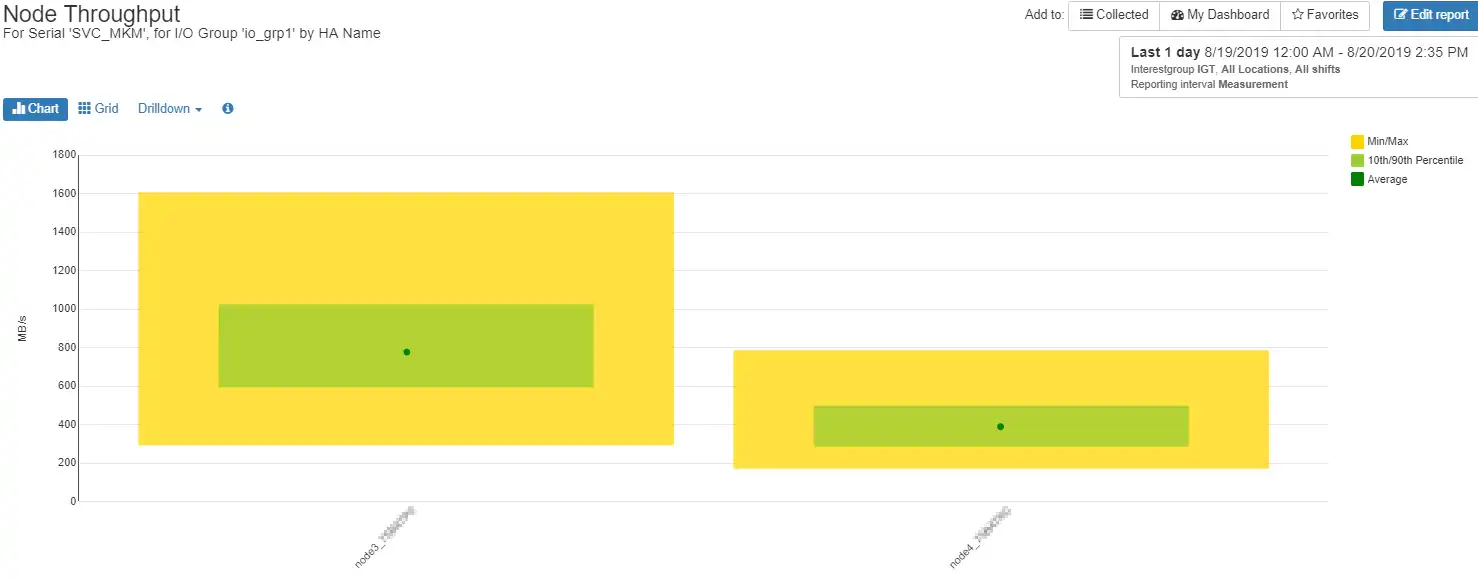
Figure 1: Imbalanced Node
Figure 2 shows an imbalance in port activity across the ports in an SVC node.
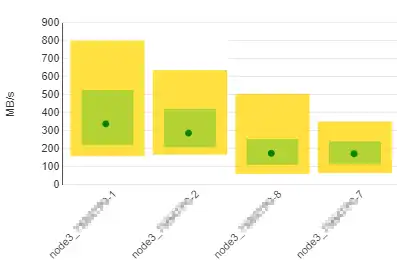
Figure 2: Imbalanced node ports
2) Review zoning and masking in order to identify zoning issues
The path that data travels from a host HBA port through the SAN fabric into the array and down to its underlying LUN can cause problems that aren’t easily identifiable without a lot of hands-on work, especially in a heterogenous environment. Some of the things that should be checked regularly are:
- Zoning – Check that hosts are zoned to the storage array front-end adapter ports in accordance with best practices for the array. This normally means the I/O is spread properly across its assigned array host adapters and ports as well as making sure that all host paths are active at the storage array.
- LUN Masking – Once connectivity from the host to the array has been established, ensure that the host is assigned the desired LUNs.
With a few mouse clicks in IntelliMagic Vision you can find reports such as the topology view in Figure 3 below. This ESX host has only one initiator port connected to one port on one switch. This reduces redundancy on two fronts: if either the host HBA or the switch port in question go offline, the ESX host will lose connectivity to its storage and another fire will need to be fought.
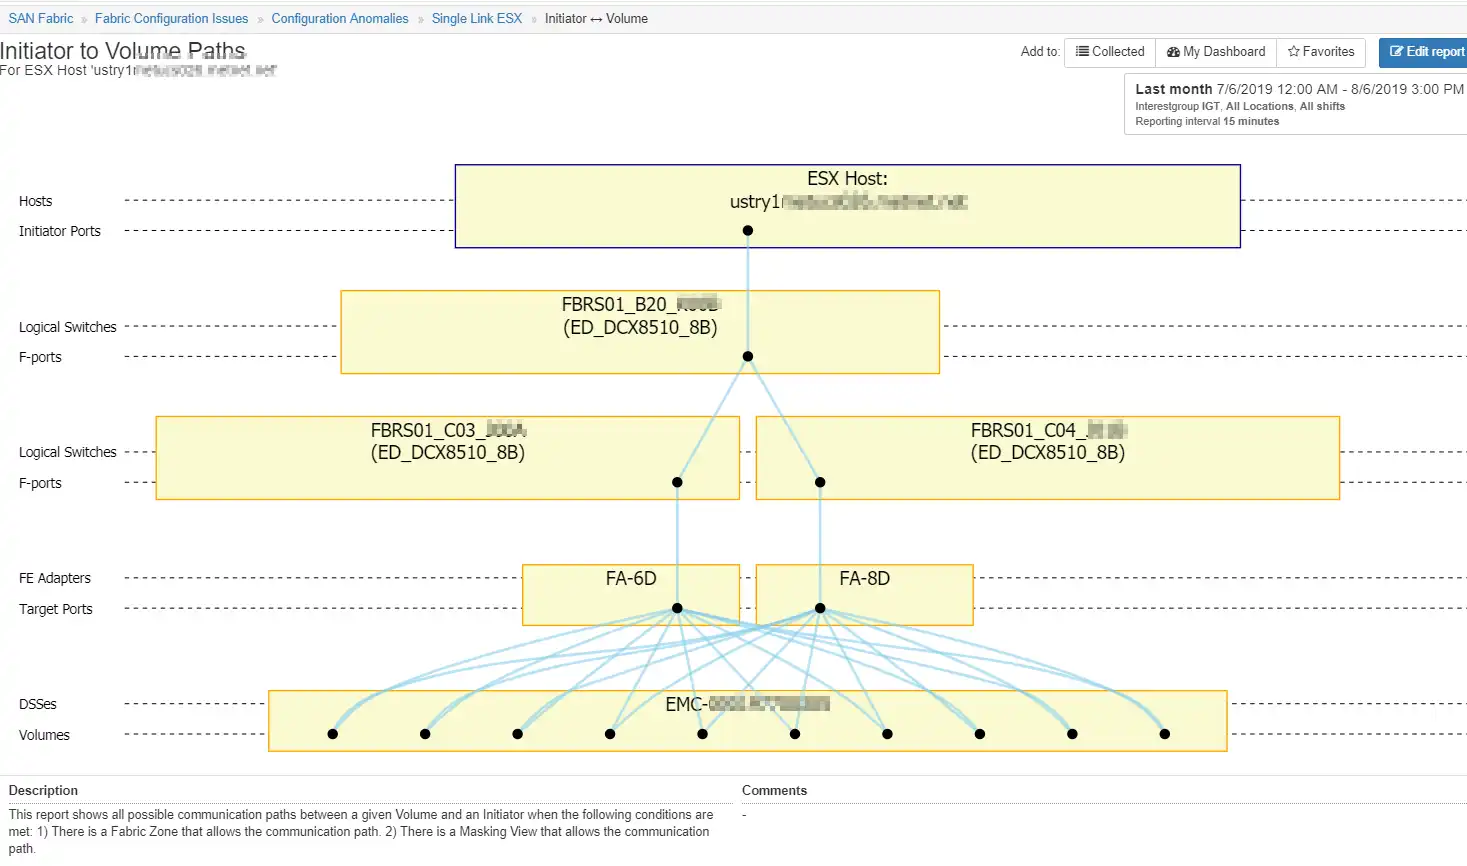
Figure 3: Topology View
Another report, Figure 4, easily shows pathing issues that aren’t as obvious. If the storage administrator looked at the HBA status from the ESX host point of view, it would show all paths online. From an array standpoint, all paths are up as well. The issue is that two of the HBA ports are communicating with a single port on switch FBRS01 while the other HBA ports are properly communicating with one port each on switch FBRS02. This situation creates both a single point of failure and a potential hot spot on the only port used on FBRS01.
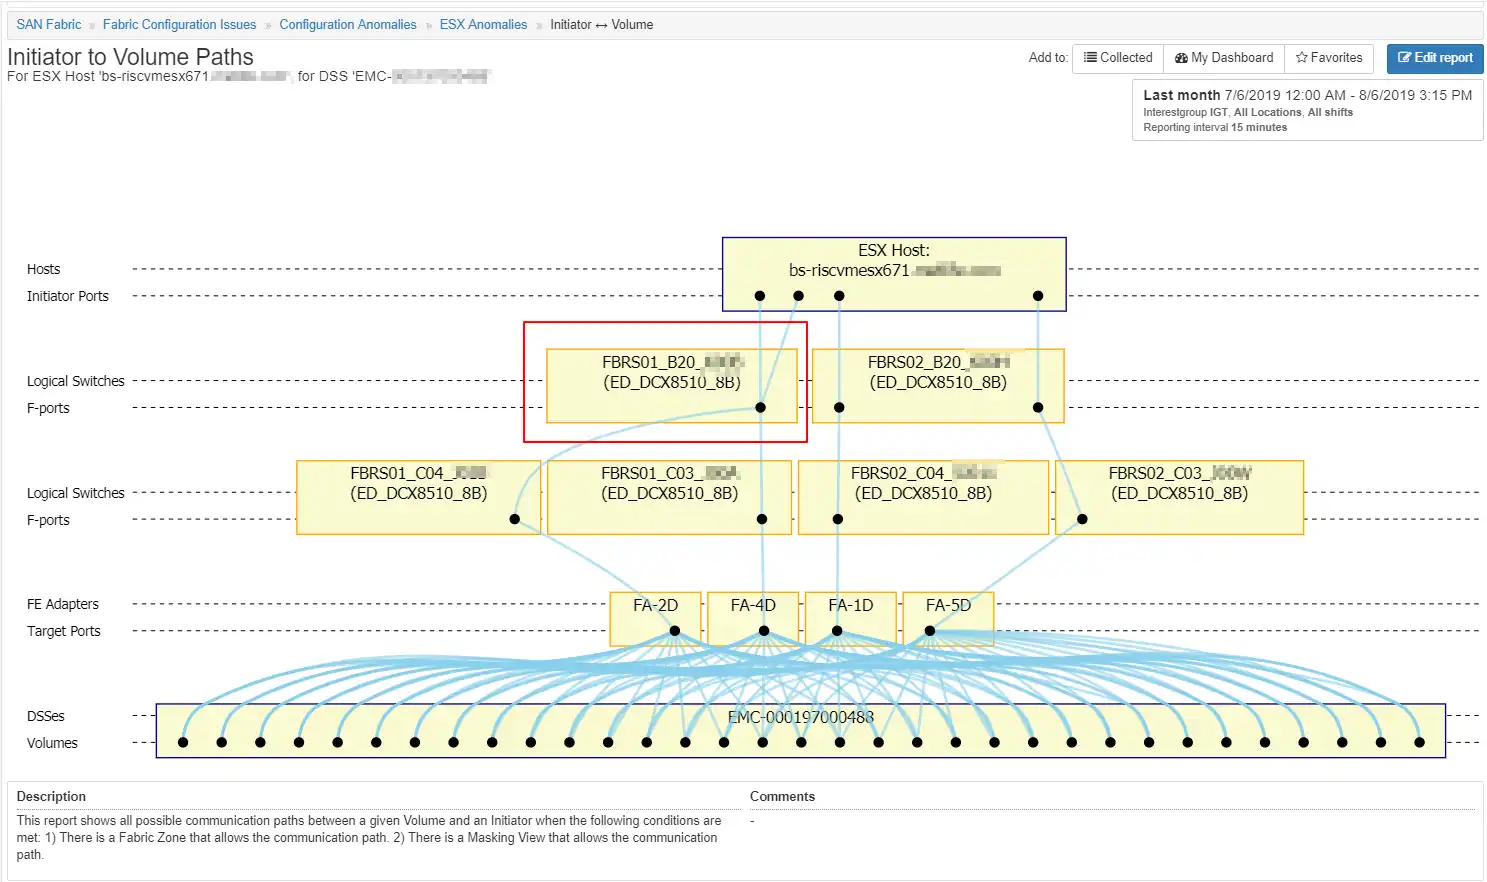
Figure 4: Host with pathing issues
3) Review performance and health of all storage systems, especially key components
A performance or health issue with any component of a storage array can cause issues with a host, a cluster, or all hosts communicating with a storage array. Some of the items that should be reviewed are:
- CPU
- Cache
- Disk adapter
- RAID groups
- Disk drives
IntelliMagic Vision provides a rich set of customizable dashboards that show key metrics for storage system health at a glance. These dashboards have color coded borders (green-good, yellow-warning, red-exception) that indicate the status of the items within the dashboard as well as an AI generated rating (0-3) for the dashboard.
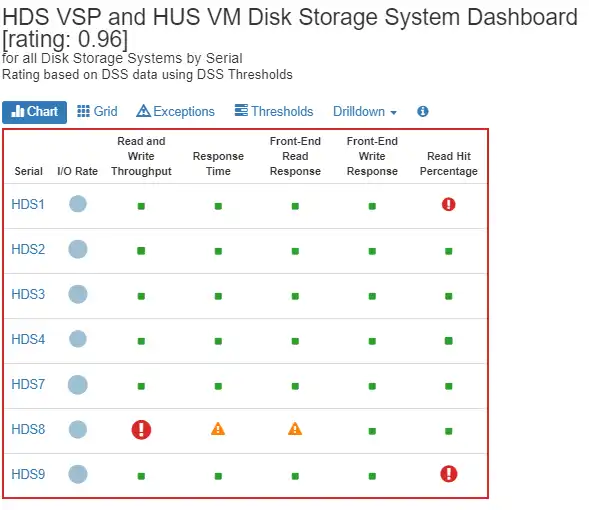
Figure 5: Bubble chart showing health of key metrics
Within the dashboard in Figure 5 above, let’s focus on the eighth line (HDS8) for a minute. For this Hitachi VSP, we see a grey dot whose size gives a relative indication of the amount of IOPS and throughput of this storage system, compared to the other storage systems. Next are health indications for read and write throughput, overall response time, front-end read response, front-end write response and read hit percentage. It is easy to see that front-end write throughput, response time, and front-end read response are outside of an acceptable range.
You can then drill down into the storage system. IntelliMagic Vision will give a group of mini-charts related to the dashboard item. Viewed together, these mini-charts provide a snapshot of what’s happening on the array. Of particular note is the peak in port response time that coincided with the peak in read and write throughput, response time, and front-end response time.
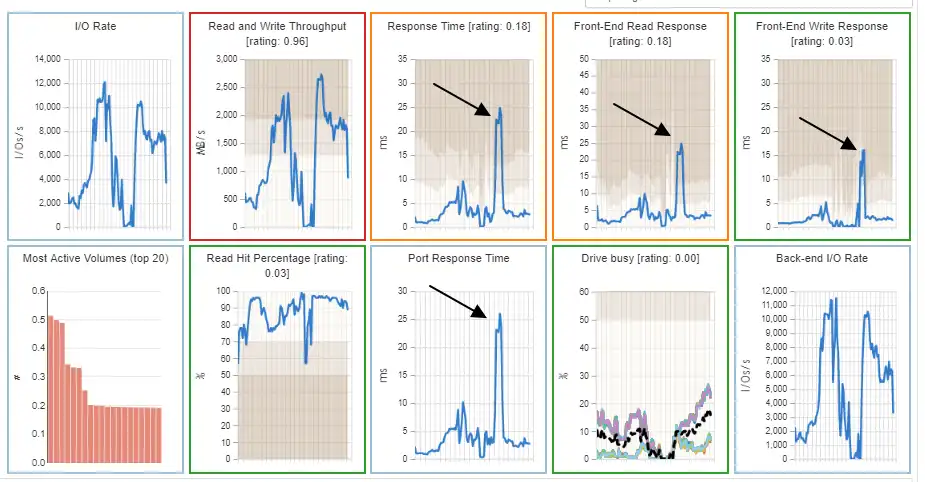
Figure 6: Storage system mini-charts
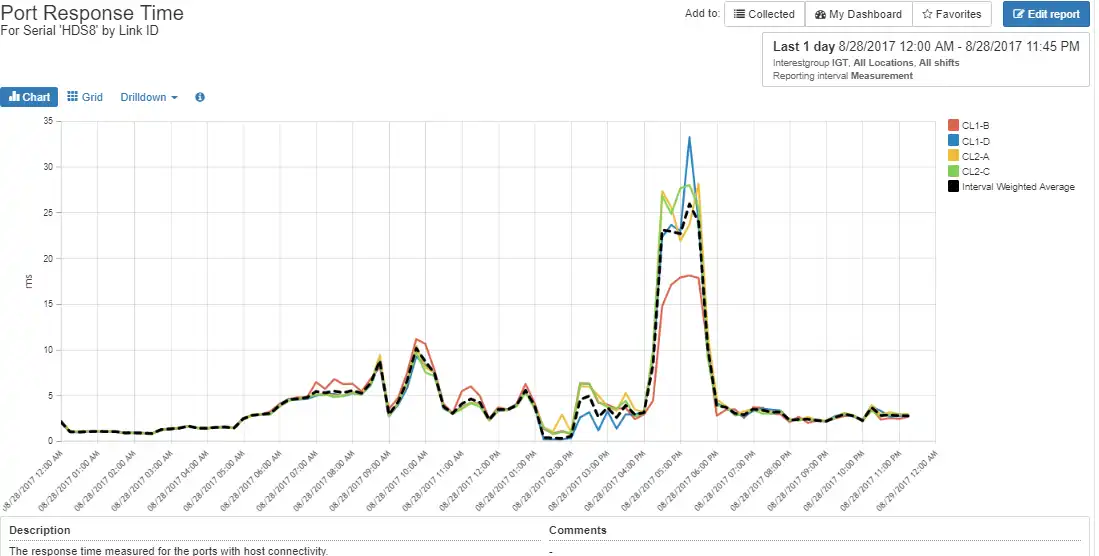
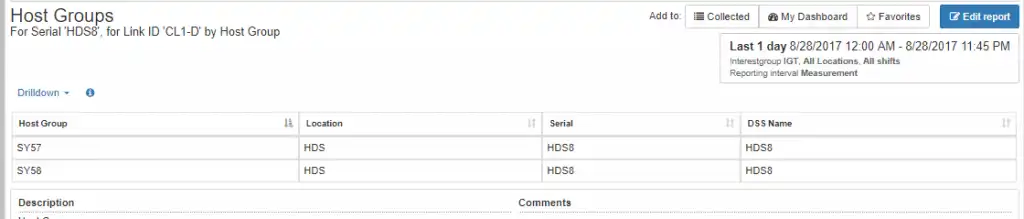
With a few mouse clicks you can find that the root cause of the issue is overloaded host ports on the VSP and the two host groups contributing most to the condition.
IntelliMagic Vision provides other dashboards with exception tables showing issues based on ratings. As with other dashboards, the Observation column gives helpful information for additional troubleshooting.
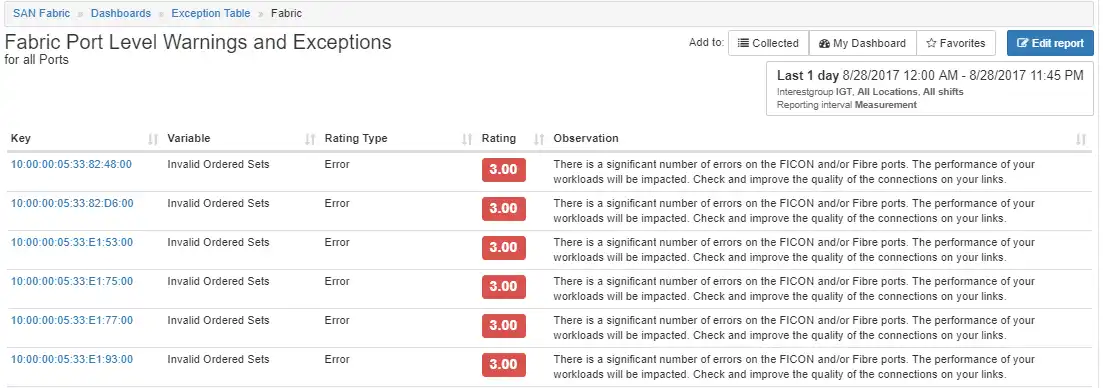
Figure 8: SAN fabric port exception table
4) Review multi-pathing balance of key servers for imbalances caused by configuration or performance issues
Ensure that hosts are using the MPIO settings recommended by the array manufacturer and that host I/O is behaving in accordance with the MPIO settings set at the host. A host with improper MPIO settings or no MPIO at all can result in unpredictable performance.
Figure 9 below shows an ESX host with three, not four, active ports resulting in a loss of redundancy, and one port carrying a much heavier load than other ports from that server.
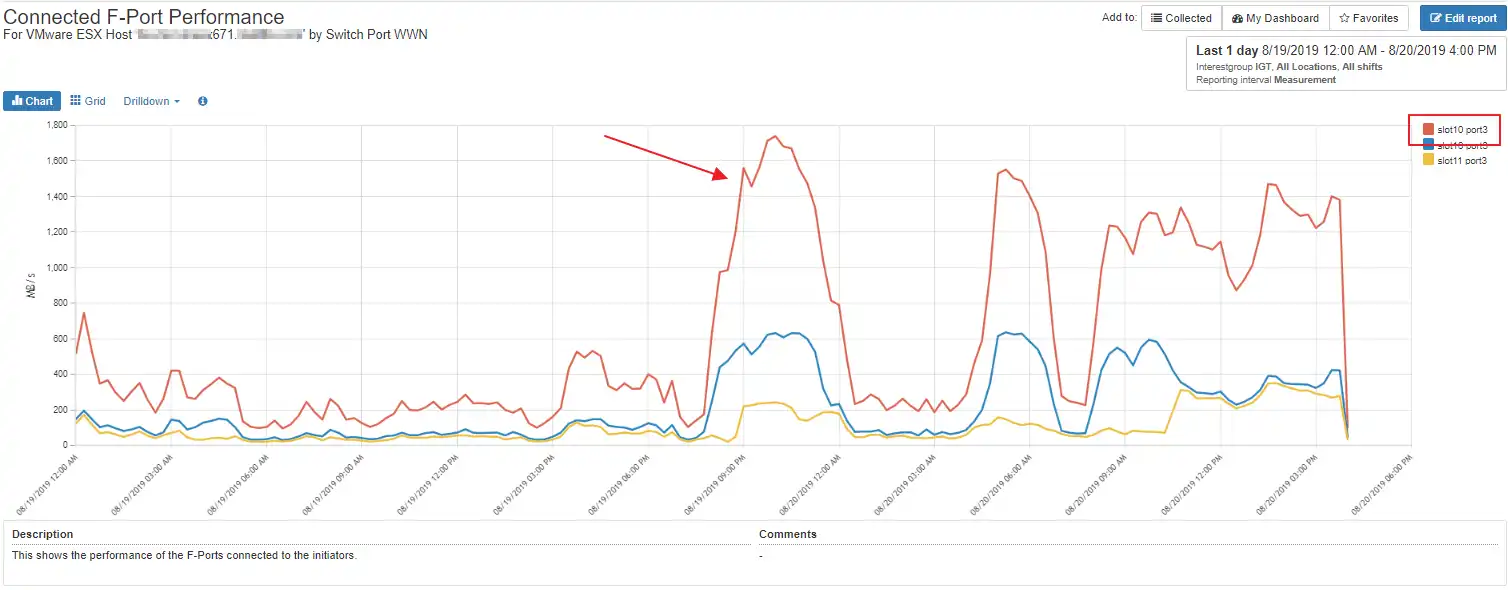
Figure 9: ESX host with pathing issues and MPIO imbalance
5) Review SAN fabric for errors and potentially dangerous trends
Issues on the SAN fabric can wreak havoc in the datacenter and can be silent killers that are the last to be checked. Some things to be considered are:
- Port health
- Ports operating at their limits
- Faulty ports
- ISLs
- Sufficient capacity to handle the traversing I/O
- “Heavy hitting” hosts that are on different sides of an ISL from the storage array
IntelliMagic Vision provides dashboards for this as well. Easy to read bubble charts show you where the issues are and allow you to drill down into the issue to find the source.
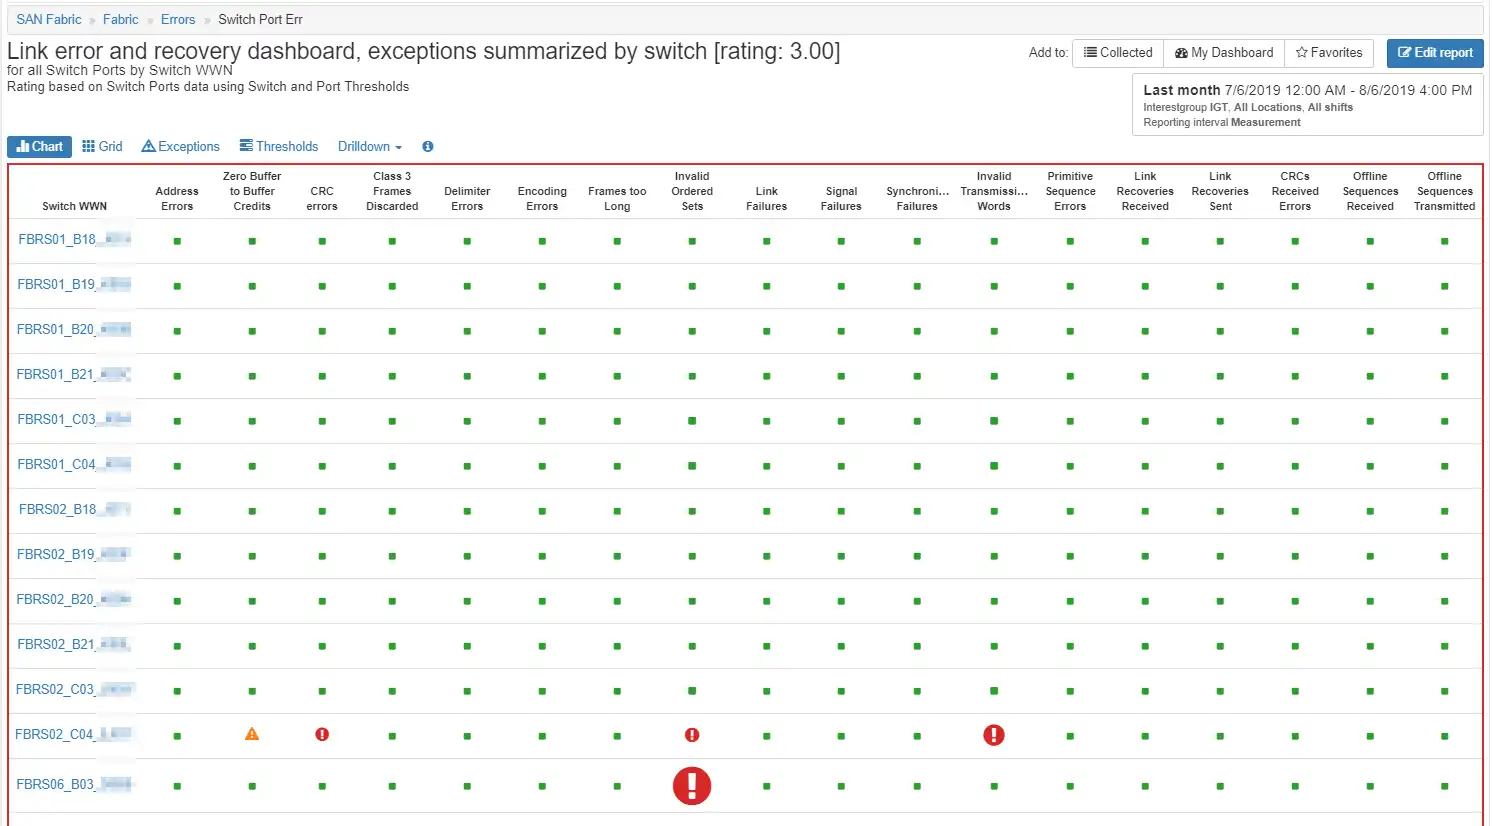
Figure 10: Bubble chart showing health of key switch metrics
Do you have smoldering fires in your storage infrastructure?
As someone that has been a storage professional for well over a decade, IntelliMagic Vision is the tool I always wished I had. It provides easy to use, customizable dashboards and allows me to get a good look at my SAN infrastructure in a few minutes each day. The most important benefit is that it provides an easy way to eliminate fires before they happen, which reduces troubleshooting time and gives me back time to deliver value to my team.
This article's author
 Tim Chilton
 Share this blog
Related Resources
Finding Hidden Time Bombs in Your VMware Connectivity
Seeing real end-to-end risks from the VMware guest through the SAN fabric to the Storage LUN is difficult, leading to many SAN Connectivity issues.
Should There Be a Sub-Capacity Processor Model in Your Future? | IntelliMagic zAcademy
In this webinar, you'll learn about the shift towards processor cache efficiency and its impact on capacity planning, alongside success stories and insights from industry experts.
How to Detect and Resolve “State in Doubt” Errors
IntelliMagic Vision helps reduce the visibility gaps and improves availability by providing deep insights, practical drill downs and specialized domain knowledge for your SAN environment.
Book a Demo or Connect With an Expert
Discuss your technical or sales-related questions with our mainframe experts today