
Improperly configured hosts can suffer from poor performance even on high performing arrays. Like a sports car engine, modern arrays are finely tuned machines, but if fueled with inefficient input you can rob performance and make your Ferrari perform more like a Yugo.
I was recently approached by one of our customers for assistance in finding the source of a performance anomaly they were seeing on one of their Infinidat InfiniBoxes. This particular array, let’s call it infini01, had recently started showing increased front-end read response times on node 1 port 6, and as you can see in Figure 1, the trend over time was increasing. Infinidat InfiniBoxes are typically very well-behaved arrays, so I was quite interested to understand this aberration.
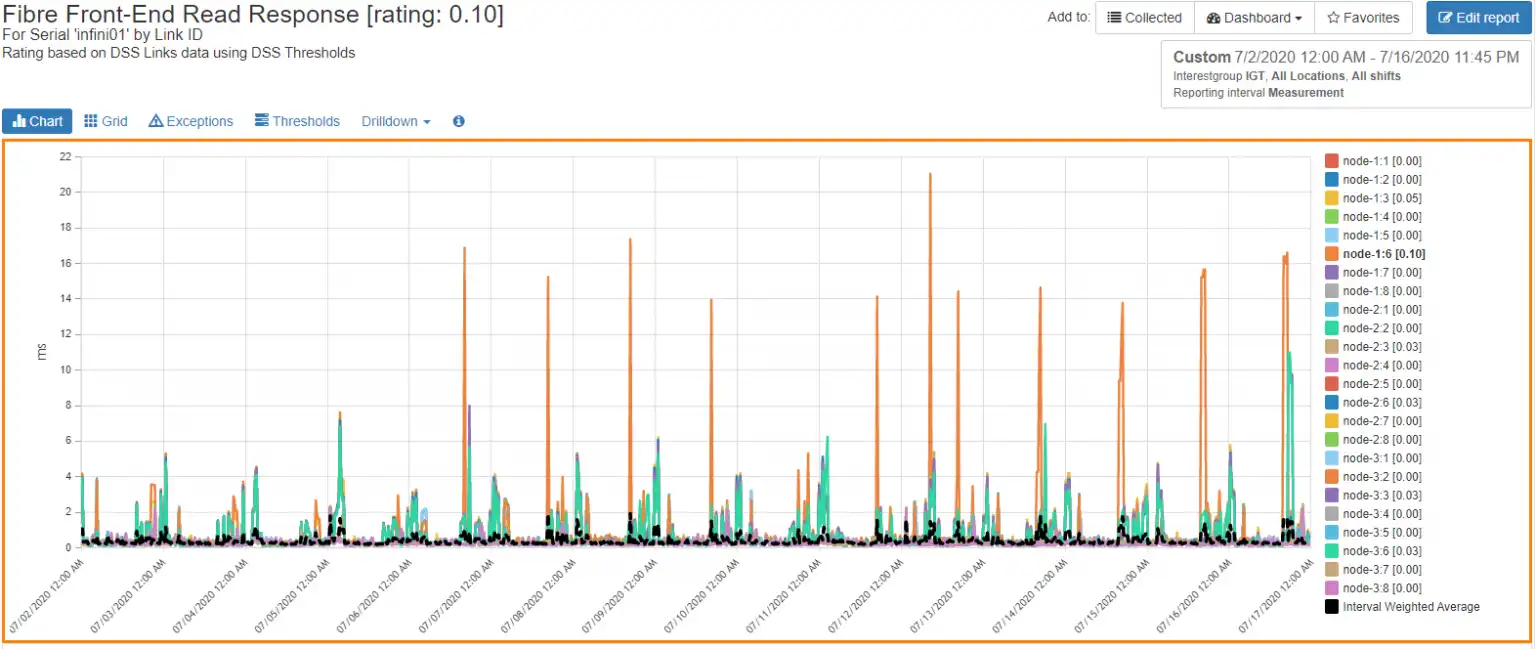
Figure 1: Front-end Read Response
High Front-End Response Times on Infinidat Infinibox
I looked at cluster performance for this array and noticed that one particular cluster, lnx01_2_3, had spikes in front-end response times that corresponded to the peaks seen on the front end of the array.
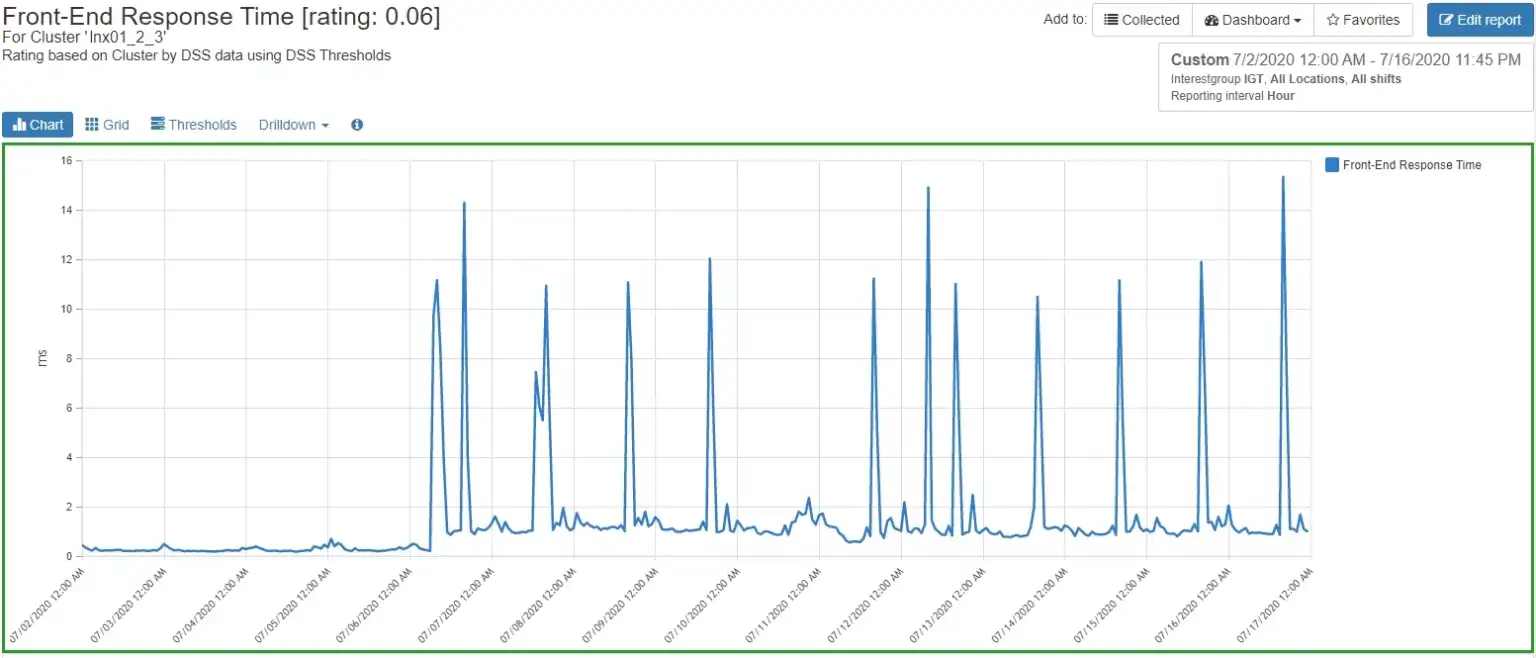
Figure 2: Concurrent Cluster Performance
Drilling down to the volumes associated with that cluster showed that there was no particular volume that appeared to be the source of the issue. Figure 3 shows the highest peak in throughput for any volume was 33.5 MB/sec, which posed no challenges to the capabilities of the front-end ports or the InfiniBox as a whole.
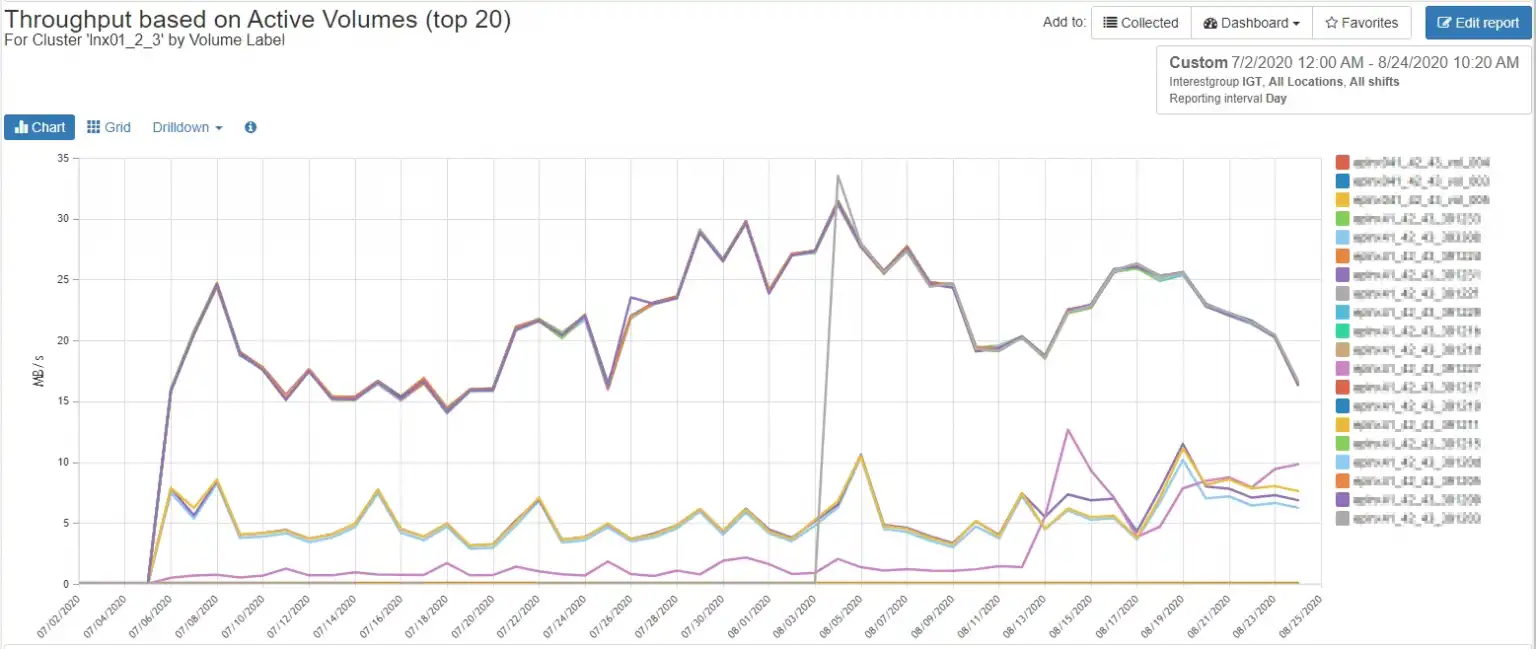
Figure 3: Cluster Volume Performance
That being the case, I decided to take a more holistic look at the front-end ports and noticed that there were two ports, 3:6 and 1:6, that showed markedly more throughput over the other ports. You can think of your front-end ports as analogous to pistons in an automobile engine. If one of them is carrying significantly more load than the others, the engine is going to run roughly and have poor performance.
Figure 4 is a balance chart that shows the average throughput for each port as a green dot, the 10th/90th percentile as a green box, and the minimum/maximum as a yellow box, making it easy to spot imbalances.
Port 3:6 stood out because, although not saturated, it was carrying a much higher load both at peak and on average.
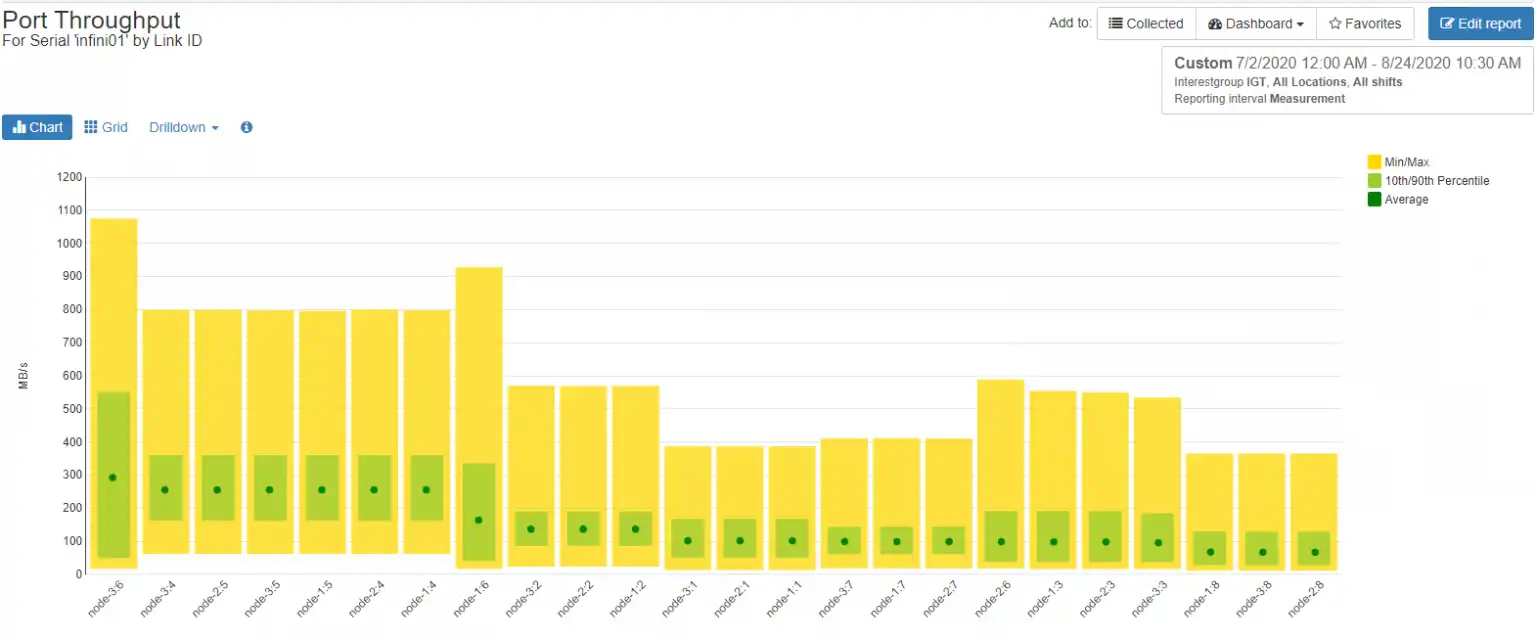
Figure 4: Port Balance
Looking at the port performance over time shows that 3:6 showed a significant increase in throughput during the period in question.
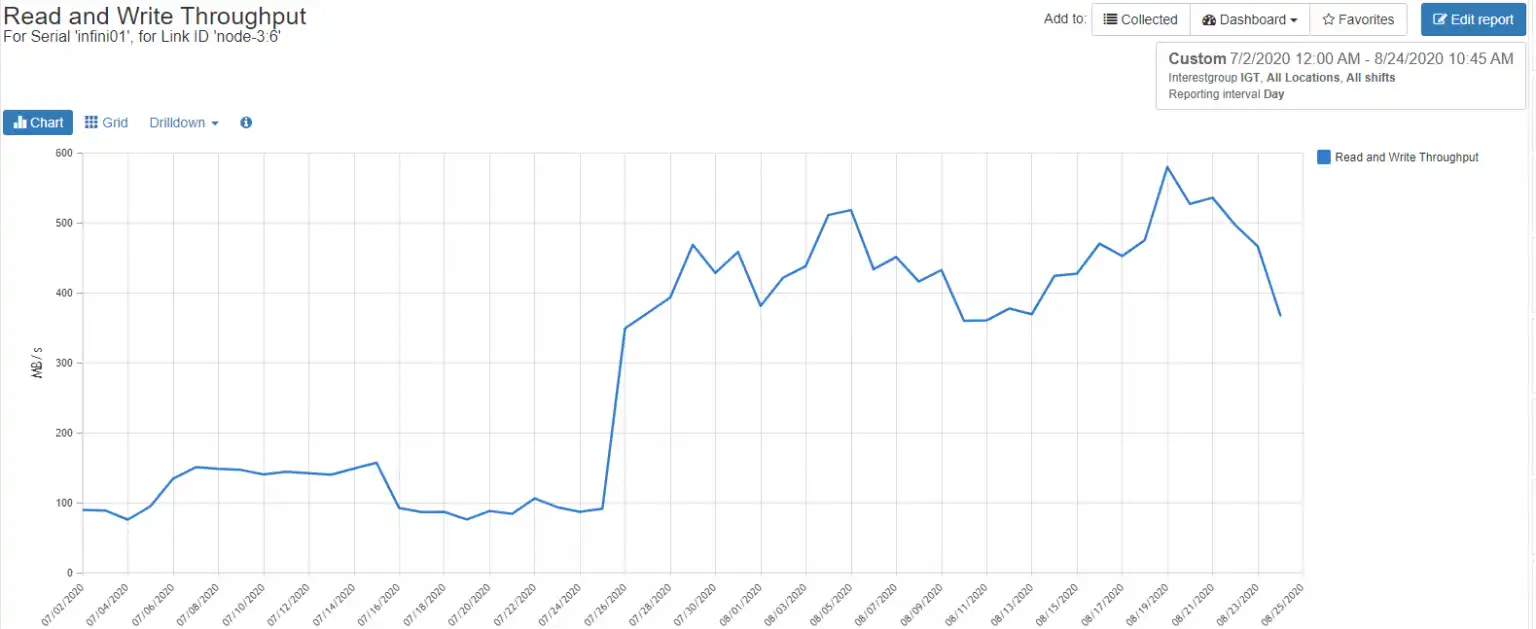
Figure 5: Port 3:6 Performance
By examining how the hosts in cluster lnx01_2_3 were zoned and masked to infini01, I found ports 3 and 6 on each node were being utilized by each of the three hosts in the cluster.
Figure 6 is a report that lists all initiator WWNs, target WWNs, and volumes associated with a masking view cluster:lnx01_2_3. I noted the initiator WWNs for the next troubleshooting step.
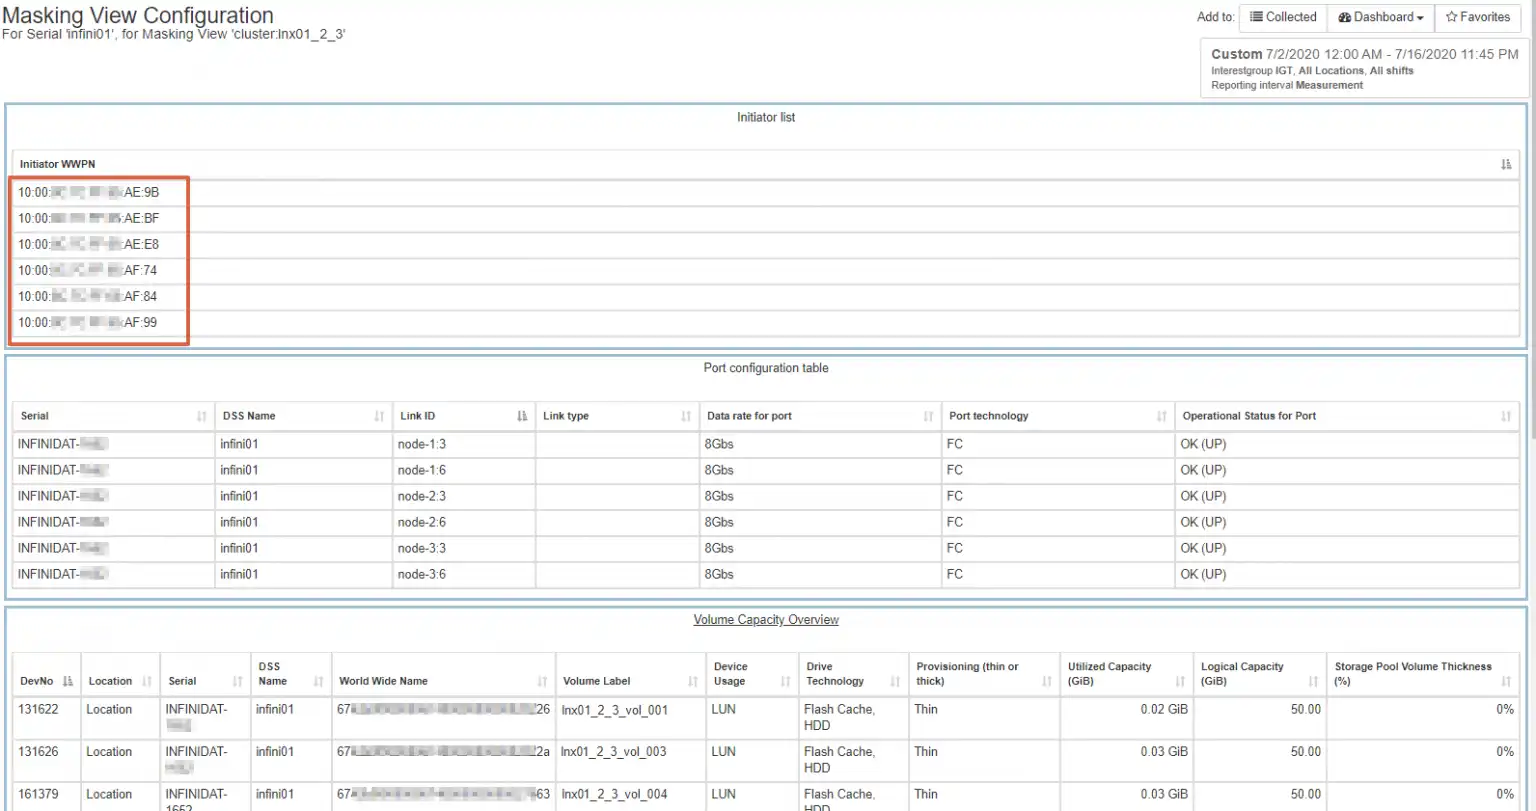
Figure 6: Masking Views
Because IntelliMagic Vision has cross-stack visibility, it was a simple matter to cross-reference the three hosts to their underlying switch ports, as seen in Figure 7. This shows the switches and ports connected to each initiator associated with masking view cluster:lnx01_2_3.
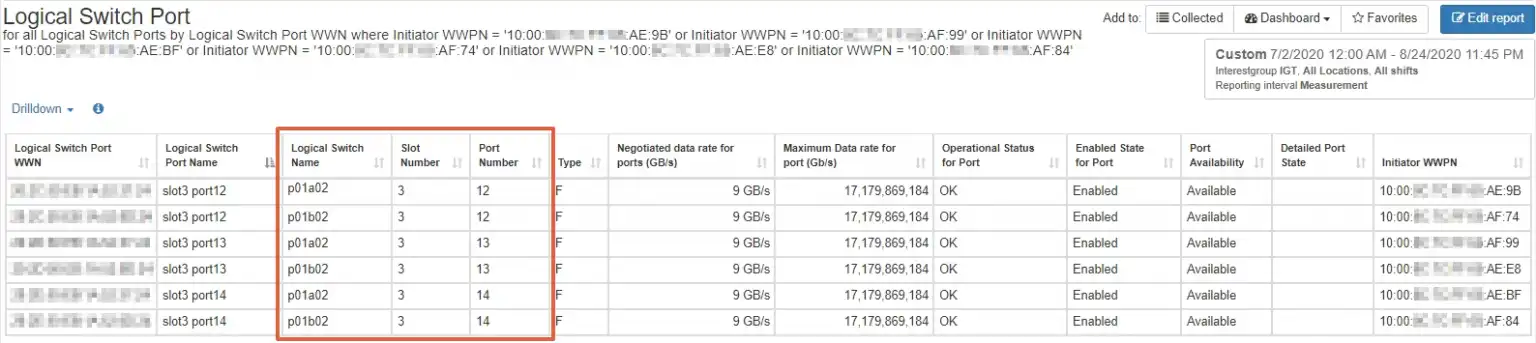
Figure 7: Switch Ports for Cluster
A topology chart, such as that in Figure 8, allows easy visualization of the connectivity for each device associated with masking view cluster lnx01_2_3, from the initiator, through the switches, to the InfiniBox front-end target ports, to the volumes.
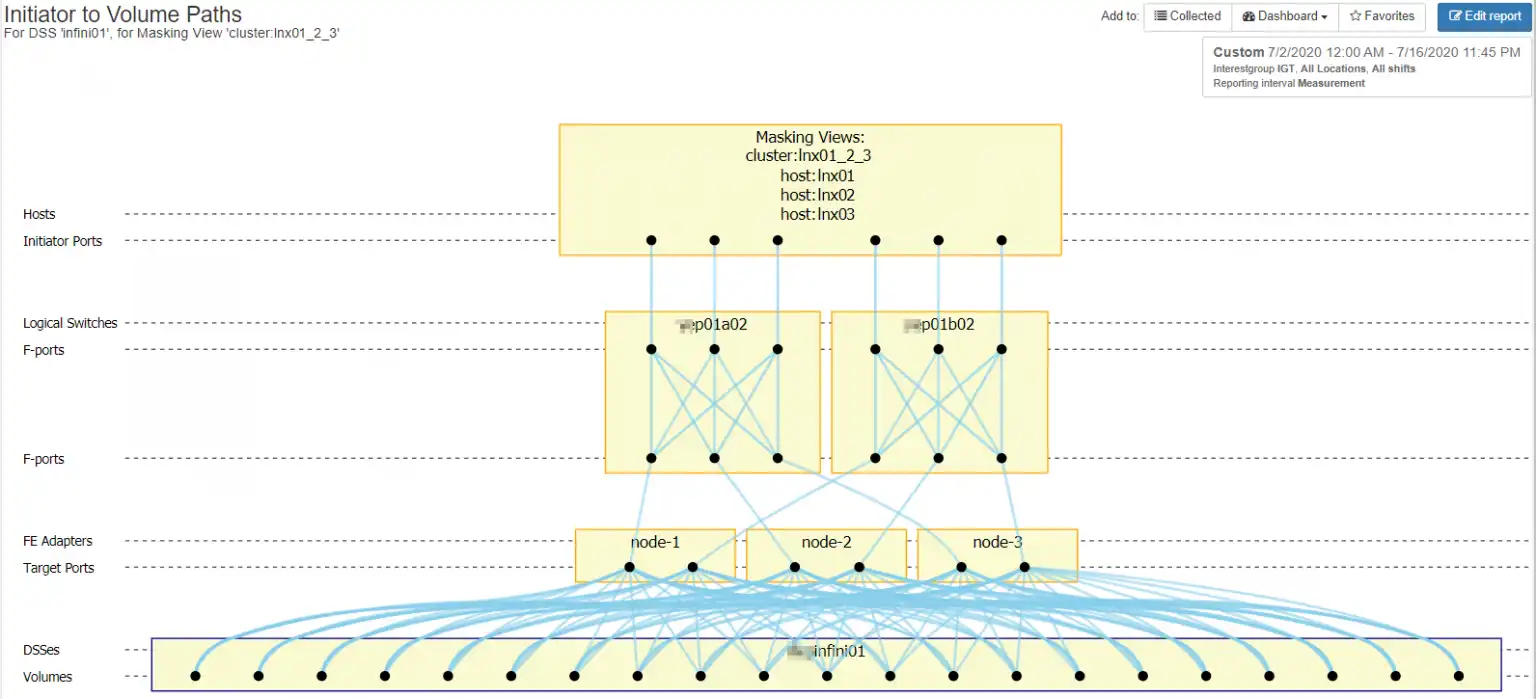
Figure 8: Masking View Topology
The Cause of Poor Performance Can Be Outside the Array
Now that we had the full view of how the solution was implemented, I had a look at how the switch ports were being utilized. The “B” fabric showed nothing unexpected. It showed the ports for a three-node cluster with one node, lnx01, being the active node.
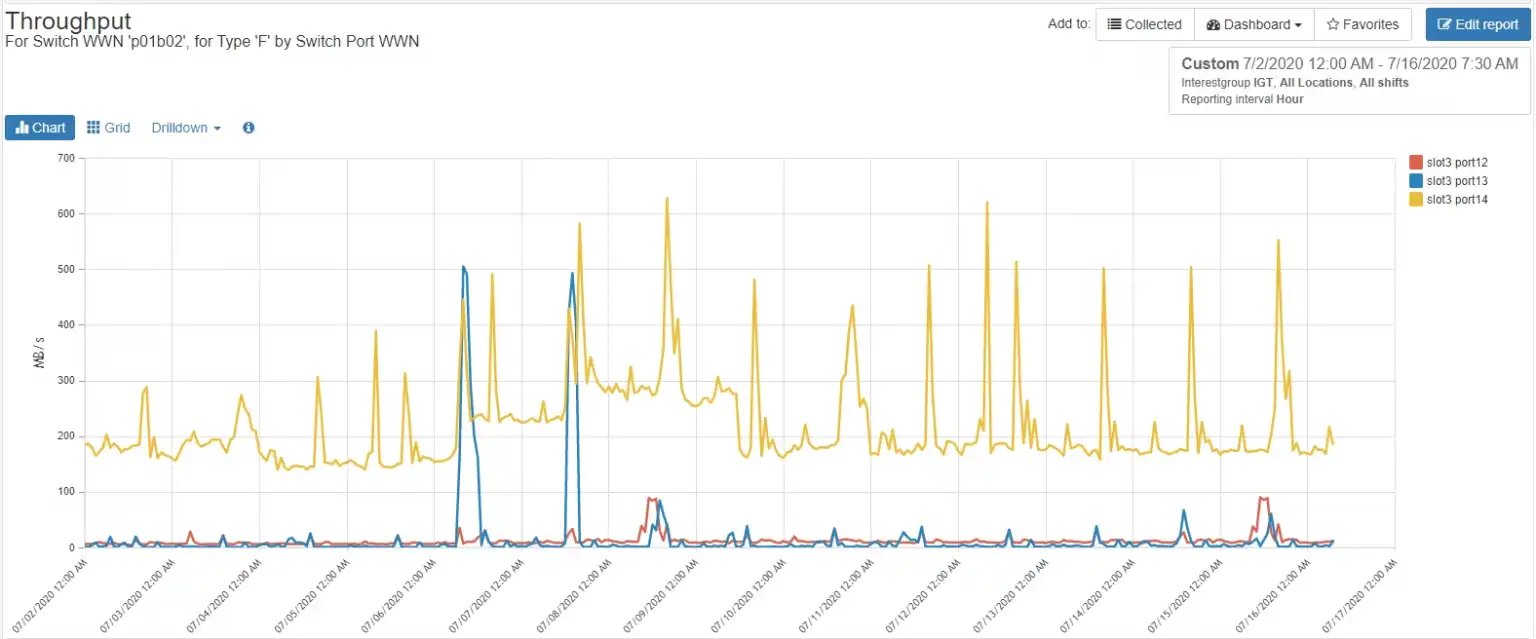
Figure 9: “B” Fabric Utilization
The “A” fabric showed a different situation as seen in Figure 10. There was almost no throughput for any of the hosts in the cluster after July 10th. This indicates that the multipathing for node lnx01 was either malfunctioning or not implemented.
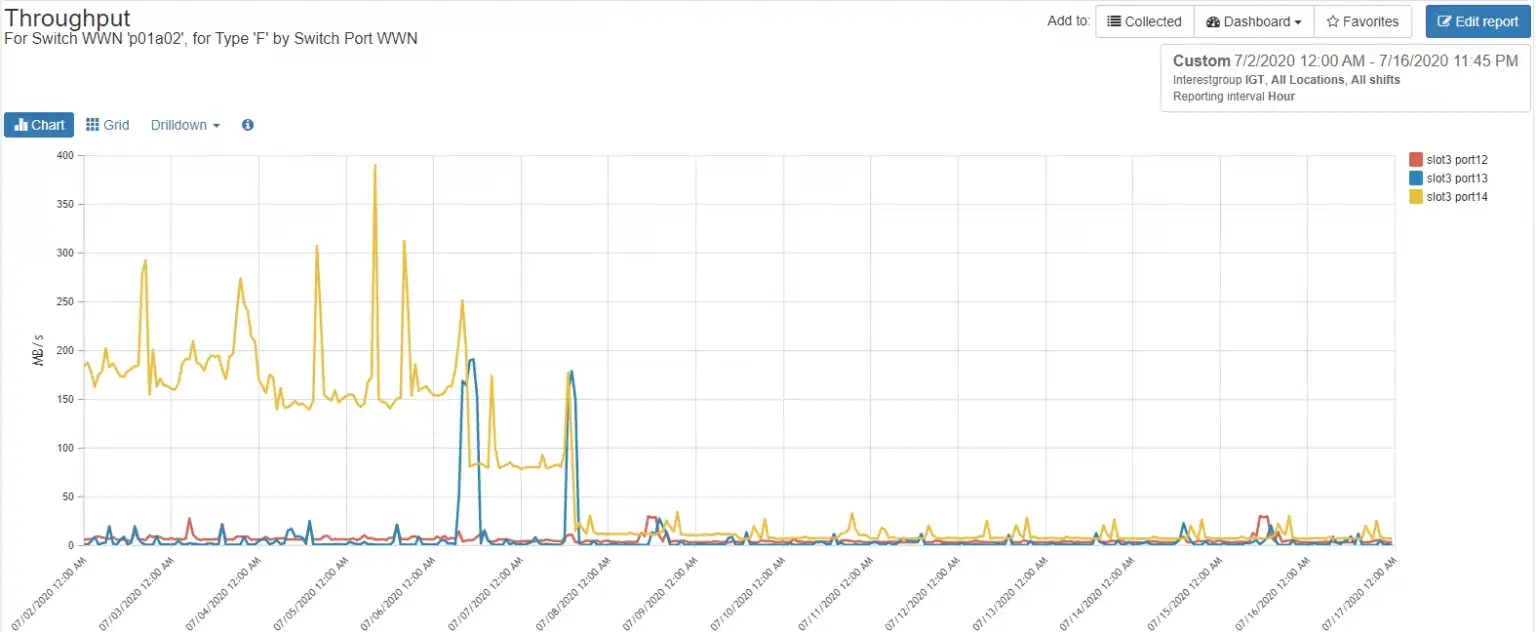
Figure 10: “A” Fabric Utilization
Figure 11 shows the complete path of connectivity for host lnx01 across the “A” fabric.
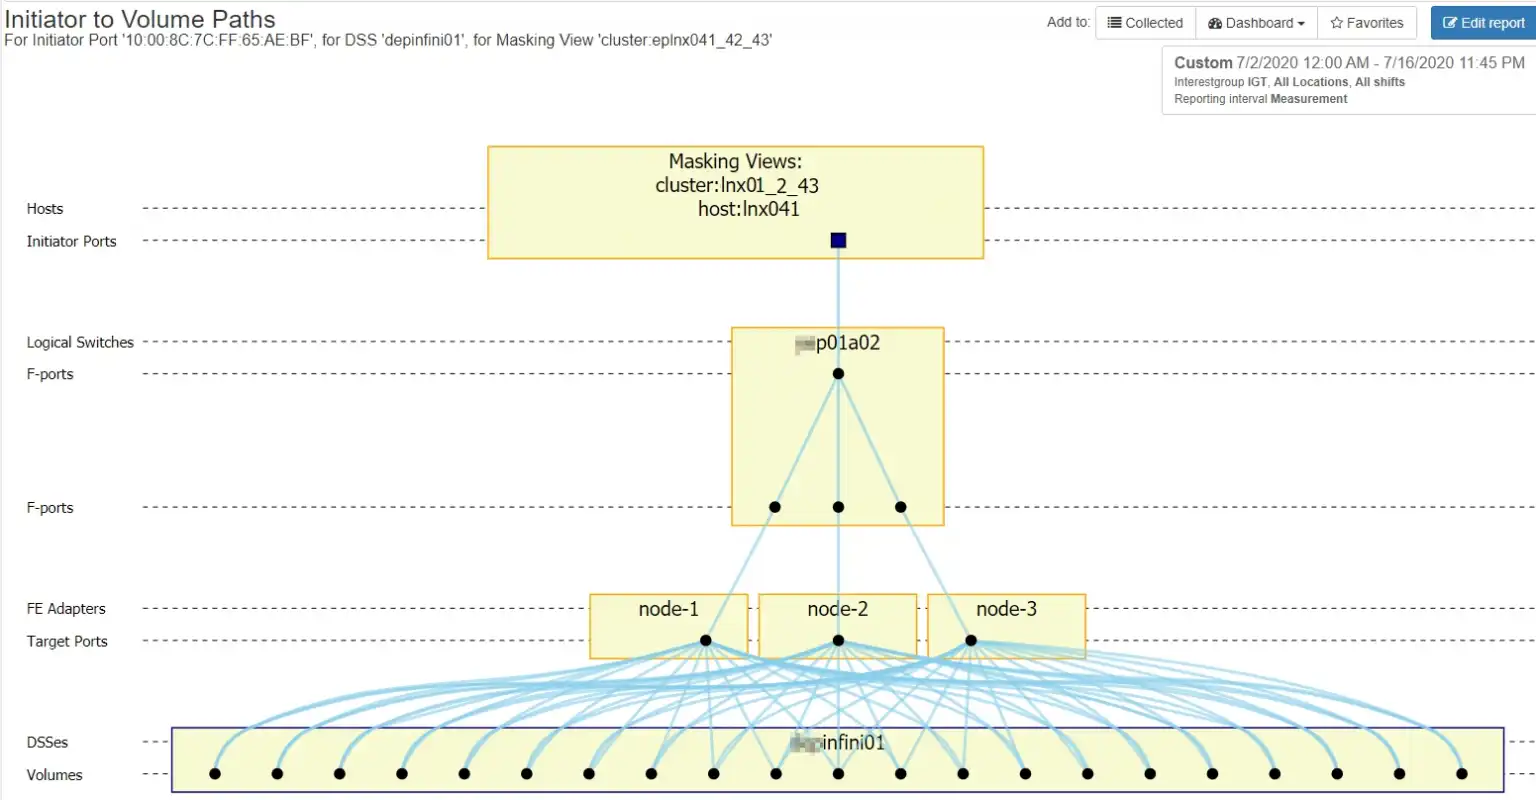
Figure 11: “B” Fabric Connectivity
I told the customer about the multipathing issue on host lnx01 and they subsequently arranged a change window to address the issue.
Taking your sports car to the garage
Modern storage arrays are like sports cars in that they require specialized tools and knowledge to properly diagnose issues with them. Now more than ever, performance issues require end-to-end visibility to properly diagnose issues. IntelliMagic Vision provides the tools and built-in knowledge to quickly zoom into the cause of an issue in your storage environment and get your sports car of a storage array running smoothly once more.
This article's author
 Tim Chilton
 Share this blog
Subscribe to our Blogs
Subscribe to our newsletter and receive monthly updates about the latest industry news and high quality content, like webinars, blogs, white papers, and more.
Related Resources
Challenging the Skills Gap – The Next Generation Mainframers | IntelliMagic zAcademy
Hear from these young mainframe professionals on why they chose this career path and why they reject the notion that mainframes are obsolete.
Making Sense of the Many I/O Count Fields in SMF | Cheryl Watson's Tuning Letter
In this reprint from Cheryl Watson’s Tuning Letter, Todd Havekost addresses a question about the different fields in SMF records having different values.
Insights into Subsystem and Hardware Configurations through Topology Views | IntelliMagic zAcademy
Explore mainframe complexities and visualize hardware/software connections with Todd and John in our webinar. Gain insights into ensuring application resilience.
Request a Free Trial or Schedule a Demo Today
Discuss your technical or sales-related questions with our availability experts today