
Understanding NetApp performance can seem an overwhelming task. There are many things that can affect host performance, making it easy to get “lost in the weeds.” This blog will cover the basics of key performance metrics you should keep an eye on, an overview of NetApp performance monitoring best practices, and provide you a good baseline to be able to effectively measure performance and detect performance issues on your NetApp storage array.
Key NetApp Performance Metrics
Let’s start by defining a few of the most important metrics to get you started on your performance monitoring journey.
Operation: The fundamental unit of work performed on any disk storage system is the operation. We will focus on read and write operations in this blog. There are other types of operations on a NetApp than read and write, particularly if you’re using NFS and CIFS/SMB workloads such as creation/deletion of files and directories, lookups, and get and set attributes.
IOPS: IOPS is a measure of the number of Input/Output Operations per Second.
Throughput: Measures how much data can be managed per second expressed in megabytes per second or MB/s
Latency: Measures how long it takes to perform a read or write request expressed in milliseconds (ms) or microseconds (µs)
NetApp Architecture
A NetApp storage system can be logically divided into 3 main areas when discussing performance:
- Connectivity – the NIC or the HBA port that connects the NetApp to the outside world
- The system itself – The CPU, memory, and NVRAM
- The storage subsystem – persistent media (spinning disks and flash drives), Flash Cache, and Flash Pool (Figure 1). Note that for an all-flash array (AFA), there is no need for Flash Cache or Flash Pool because primary storage is already on very fast flash media. (Figure 2)
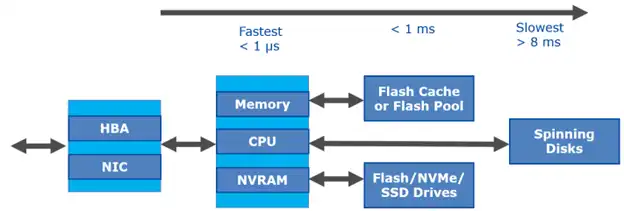
Figure 1: NetApp Hybrid Array
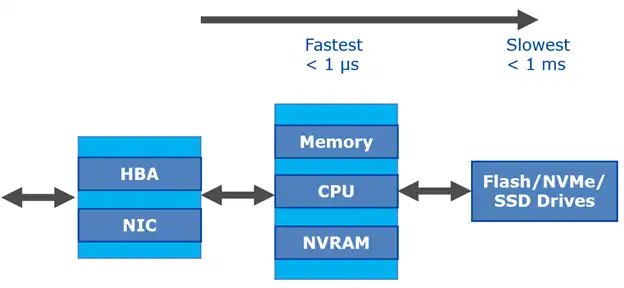
Figure 2: NetApp All Flash Array (AFF)
Read Operation
A read first hits the front-end ports of the architecture, which consists of the HBA if using Fibre Channel or the NIC if using iSCSI, CIFS/SMB, or NFS protocols. Regardless of the protocol in use, if the port in use is saturated or near saturated in terms of throughput, performance will suffer.
After the data is fetched from the media it is cached in main memory. If the data is read again soon, the data is likely still cached in main memory, making subsequent access extremely fast because there is no access to back-end media required. If more memory is needed in the memory cache because the working data set is larger than the cache itself, data is removed from read cache to make room for the data request. If the system has Flash Cache or Flash Pool, blocks evicted from main memory cache can be inserted into the flash-based cache, still giving superior response times to back-end spinning disks.
In general, ONTAP only puts randomly read data and metadata into flash-based cache. After data is inserted into Flash Cache or Flash Pool, subsequent reads of this block will be from the flash-based cache. After a period of time as the data access to a particular block “cools,” it will age out of flash-based cache as well.
Write Operation
For most storage systems, writes must be placed into a persistent and stable location prior to acknowledging the write to the client. Waiting for the storage system to write an operation to disk can introduce significant latency. To solve this issue, NetApp uses battery-backed NVRAM to log incoming writes. When controllers are in HA pairs, half of the NVRAM is used to mirror the remote partner node’s log while the other half is for logging local writes.
When a write enters a NetApp array, the write is logged into NVRAM and is buffered in main memory. After the data is persistent in local NVRAM and mirrored to the HA partner’s NVRAM, it is acknowledged to the host. NVRAM is only accessed in the event of a failure. When the NetApp destages the data to disk, it does so from the main memory cache, not the NVRAM. The memory is destaged as a sequential write, which optimizes the write and incurs the least necessary latency.
Under most circumstances writes take a minimal amount of time, but if the back-end media are unable to keep up with the client workload, write latency can increase. If the NVRAM fills before data can be destaged from write cache to the media, it can cause queuing at the HBA/NIC and to the host itself. In worst case scenarios, it can result in data needing to be retransmitted, further increasing latency.
Ballpark Latency Expectations
Once the expected performance of each component is measured, system overhead must also be taken into consideration. Figure 3 shows ballpark latency expectations for a system under less than 50% load.
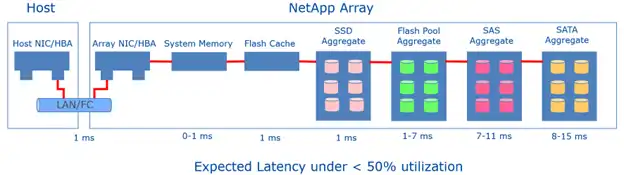
Figure 3: Ballpark Latency Expectations for a NetApp Storage Array
Workload Characteristics
Different workloads have different characteristics that need to be considered when analyzing performance:
- Read/Write balance – reads can be processed more quickly than writes because reads can often be serviced from cache and do not incur the latency induced by NVRAM mirroring and destaging from cache to disk
- Random/Sequential access mix – media, particularly spinning disks, tend to prefer sequential workloads. ONTAP is write-optimized in that almost all writes behave as if they were sequential writes.
- Block Size – More work can be done with larger operations than smaller ones. Each operation has a fixed overhead associated with it. When the operation size increases, the ratio of overhead to data is decreased, allowing more throughput per unit of time. The effective data rate decreases with smaller block sizes and vice-versa.
Performance Measurement
NetApp provides many ways that one can use to measure performance on a NetApp array. Some examples are:
- CLI – The ONTAP CLI interface provides a rich set of performance metrics to analyze performance internal to the storage array
- NetApp PerfStat is a performance and statistics data collection tool that helps troubleshoot issues relating to storage system performance
- System Manager – NetApp’s GUI also provides a rich set of charts, graphs, and tables that can be used to look at current and historical performance
- NetApp Active IQ is a digital advisor that uses telemetry data from the entire NetApp installed base and uses AI and ML to uncover risks and performance issues
- NetApp OnCommand Insight (OCI) gives visibility into performance across your storage infrastructure
The issue with most vendor-provided tools is that they are either vendor centric and don’t provide vendor specific insights into other storage hardware, or they are storage-centric and don’t provide insights into other aspects of the storage environment (such as Fabric or VMware).
There are tools provided by external vendors that fill this gap. IntelliMagic Vision for SAN, for instance, provides a rich set of performance metrics, not only for NetApp products, but for multiple other storage vendors. It also adds value by giving insight into VMware performance and SAN fabric performance, giving a true end-to-end picture of storage performance, configuration, and capacity.
Whew! That Was Just the Basics
We covered a lot of ground in just a short time there. This blog should give you a starting point for NetApp performance analysis.
Performance analysis is a multi-tiered approach. One must first gather the data, normalize the data, then interpret the data, all of which are different and specialized skillsets.
In the next blog I will discuss the internal and external factors that can affect NetApp performance.
This article's author
 Tim Chilton
 Share this blog
Related NetApp Resources
Factors That Affect NetApp Performance: NetApp Performance Management 102
This blog covers the factors affecting NetApp performance and how to remediate them if necessary.
Improve Collaboration and Reporting with a Single View for Multi-Vendor Storage Performance
Learn how utilizing a single pane of glass for multi-vendor storage reporting and analysis improves not only the effectiveness of your reporting, but also the collaboration amongst team members and departments.
A Single View for Managing Multi-Vendor SAN Infrastructure
Managing a SAN environment with a mix of storage vendors is always challenging because you have to rely on multiple tools to keep storage devices and systems functioning like they should.
Request a Free Trial or Schedule a Demo Today
Discuss your technical or sales-related questions with our availability experts today