
As the complexity of Information Technology has accelerated, one reaction has been to apply machines to keep machines running smoothly. This phenomenon has been dubbed AIOps (Artificial Intelligence for IT Operations), and it is basically how machine intelligence solutions are applied to IT operations and performance management.
It’s often very difficult to find the truth behind the tagline and distill the usefulness behind the hype. A little skepticism is wise, but there are practical use cases where AIOps can make the job of performance and capacity analysts much easier.
When Should You Use AIOps for z/OS Performance Management?
You likely haven’t seen too many abacuses or slide rules in quite a while! That is because most people realize that computers are designed to complete complex mathematical computations faster and more accurately than a human ever could.
Here are six use cases where outsourcing z/OS performance monitoring to the machine can make a lot of sense.
| Use Cases for AIOps on z/OS |
Answers the Question: |
Who Benefits? |
| 1) Detect Application & Workload Changes | “What’s new today?” | IT Planning, Service and Cost Monitoring
|
| 2) Quick Notification of Service Degradation | “How do I know about this issue immediately?“ | Support Desk
|
| 3) Avoid Service Disruption | “How do we prevent this from happening?” | Performance Staff
|
| 4) Understand Workload Peaks in Context | “What is causing this?” | Support Desk and/or Performance Staff
|
| 5) Forecasting Usage and Capacity Growth | “How many days do we have?” | Capacity Planning, Performance Staff
|
| 6) Cross-Platform Monitoring & Integrating with Enterprise Dashboards | “Give me an overview” |
Operations and/or Performance Staff
|
1) Detect Application and Workload Changes
Trying to continuously monitor every aspect of the applications in your z/OS infrastructure would drive even the most diligent technician crazy. The ability to automatically detect workload and application changes can relieve the tedium and improve your responsiveness. Examples include when:
- a new application is brought online
- a new version of an existing application behaves differently
- there is a problem with a started task
- important workloads or transactions deviate from the norm
Statistical approaches help save CPU time and MSU’s by being able to quickly see when something new comes online or when new application versions are less efficient.
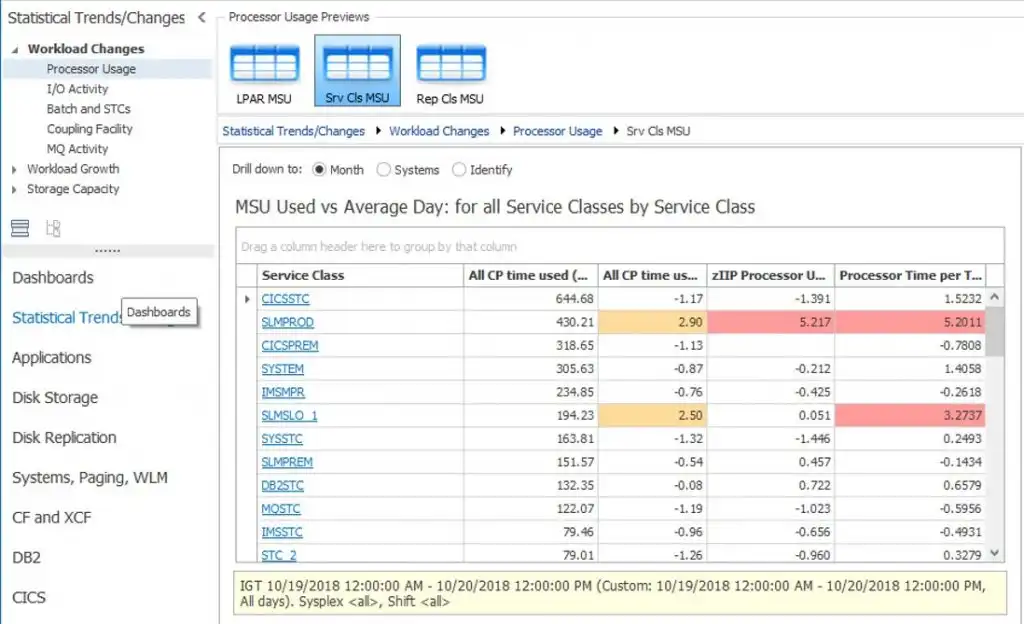
Figure 1 below shows warning (yellow) and exception (red) status alerts to workload changes that a performance analyst would need to know about.
2) Quick Notification of Service Degradation
Another common request is to be alerted when key performance indicators are out of the usual range. This allows you to quickly identify service level violations so further problems can be avoided.
Through the use of averages and balance charts, or intelligent thresholds, AIOps solutions can quickly determine and show when key metrics have deviated from “normal”.
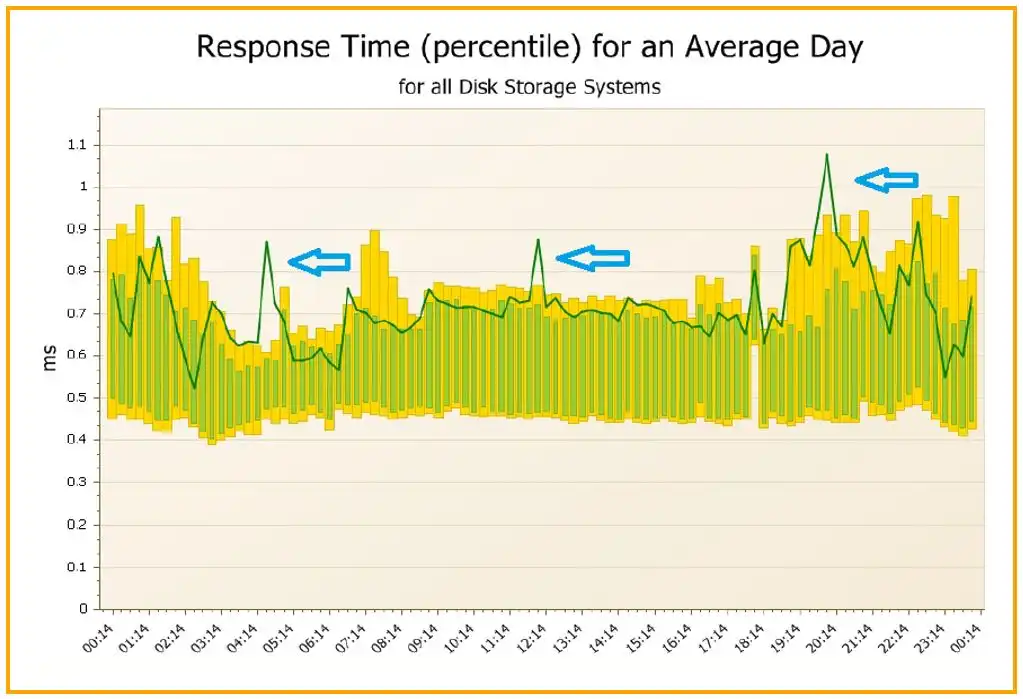
Figure 2 shows how a “Balance Chart” easily represents response times that are higher than the average for a given period.
3) Avoid Service Disruptions
At IntelliMagic, we often talk a lot about how AIOps can help proactively prevent application infrastructure performance problems. It would take an army of experts to check the health of the entire infrastructure every single day without AIOps!
With the increasing complexity of the infrastructure, the growing multitude of available metrics, and the already critically low staffing levels, AIOps has moved from “nice to have” to “mission critical”.
Under the best of circumstances, an experienced analyst knows the key metrics and areas to check for likely issues or has decades worth of SAS/MXG code to help with this endeavor. But that is neither scalable, nor transferrable to the next generation.
Machine intelligence designed correctly has a deep understanding of the system and can do all the computing, analyzing, normalizing, and prioritizing automatically. This enables experienced and novice performance analysts to efficiently and effectively resolve problems before they impact operations.
4) Understand Workload Peaks in Context
Every analyst knows that information without context is as good as useless. And it’s no different for z/OS performance analysts. Just seeing numbers or lines on a static graph is rarely enough information to make an educated decision or fully understand a problem.
AIOps solutions help here by providing an intelligent graphical interface, so the data is no longer static and elusive. With built-in drilldown capabilities, intelligent AIOps solutions provide context for every report with just one (or two) clicks away.
Figure 3 represents an example of the type of context an AIOps solution can provide.
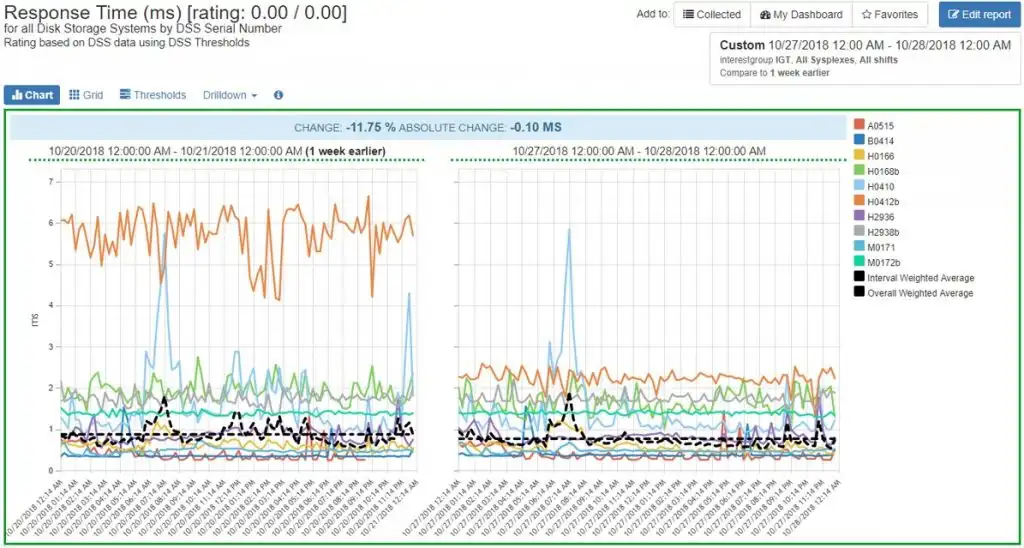
In Figure 3, the response time for the disk storage system on the right-hand side shows a spike, however, it would be extremely useful for the analyst looking at this information to know how that compares to previous time periods. By utilizing the built-in compare feature of this solution (IntelliMagic Vision), the analyst could compare the response time to the previous week and get a greater context for the spike in response time.
AIOps solutions can assist the human analyst understand the context of each report with a variety of features, including:
- Side-by-side comparison charts – to compare two-time intervals with each other
- Intuitive drilldowns – clicking on any metric or chart takes you to a more detailed report of that metric to assist in root cause analysis
- Prioritized ratings of risk – metrics are numerically rated and ordered as either healthy, a warning for a possible upcoming issue, or a current issue
- Intelligent descriptions of each rated problem
5) Forecasting Usage and Capacity Growth
A fifth use case of using AIOps for z/OS performance monitoring is in the aiding of forecasting usage and capacity growth. Although things may be running well today, it is best to be proactive and plan any necessary upgrades before the situation becomes critical. By monitoring growth in capacity utilization, you can avoid any emergency hardware purchases that can be disruptive and expensive.
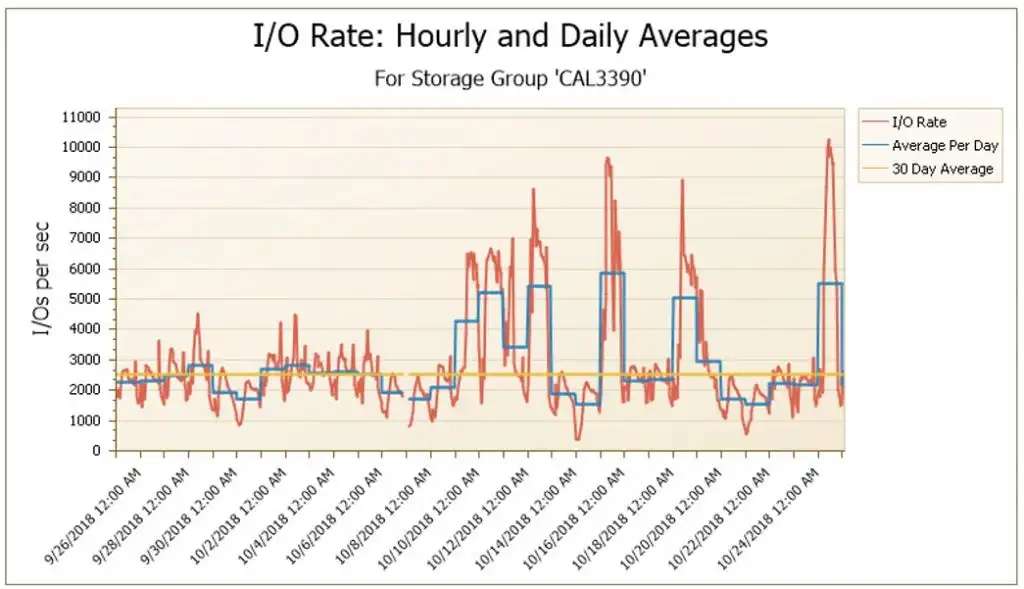
Figure 4 below shows how monitoring and tracking the hourly and daily averages of your I/O rate over time can easily be visualized. And the yellow line showing the 30-day average of the I/O rate provides further insight.
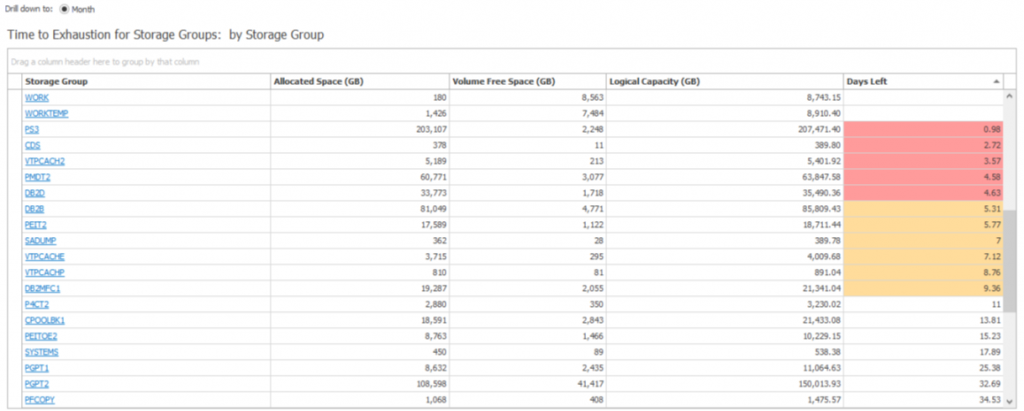
Other important reports include predicting how many days you have before a resource is totally exhausted, as show in Figure 5 below. This helps you justify any upgrades you request and provides the appropriate level of urgency.
6) Cross-Platform Monitoring & Splunk Integration
Some companies use enterprise dashboards, such as those created by Splunk, to create an overview of their IT environment. People who are heavily involved in these dashboards may also wish to see their z/OS performance management solution summarized in their enterprise dashboard.
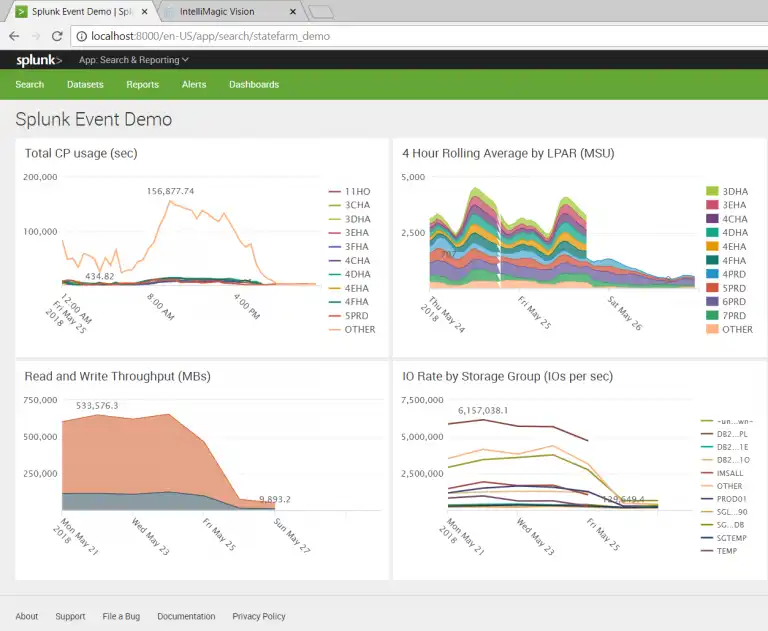
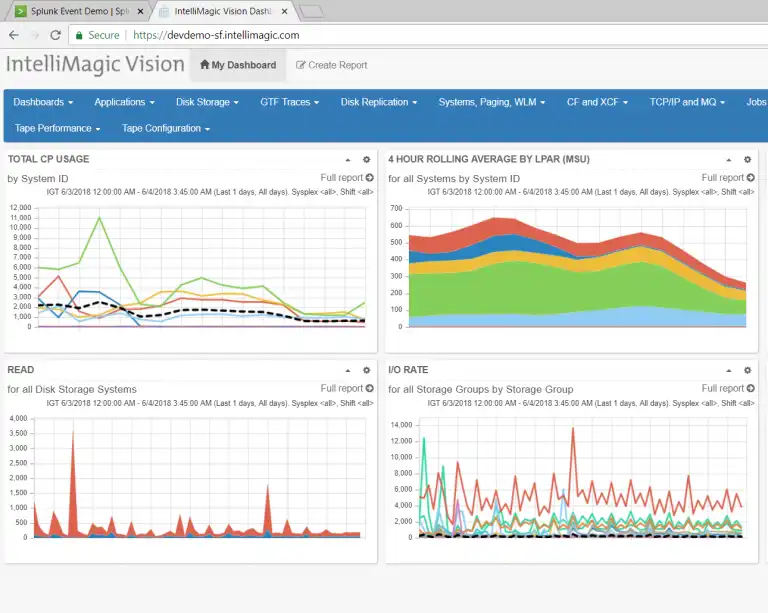
IntelliMagic Vision can export z/OS performance data into a Splunk-ready format, after which it can be imported into Splunk. The benefits of going this route is that because the data is first processed and improved by IntelliMagic Vision, and only the results are given to Splunk, much less data is ingested by Splunk, which can be a significant cost-saver. In addition, IntelliMagic Vision computes many new metrics that are not available in RMF/SMF thus increasing the value of the data that Splunk can use.
AIOps: Grim Reaper or Scythe?
The abacus never made mathematicians obsolete but instead greatly increased their effectiveness. Similarly, the scythe (and eventually the tractor) made farmers more efficient and allowed them to work smarter instead of harder. AIOps acts as a force multiplier that makes the performance analyst get a lot more done in less time. Rather than signaling the end of days for human experts, this new tool enhances their capabilities.
Call it AI, AIOps, machine intelligence, or simply statistics: the fact remains that the machine is an effective tool that puts availability back in the hands of the performance team.
When in doubt, test it out! Request a demo with us using generic data or your own and identify which use cases will make your life easier.
This article's author
 Morgan Oats
 Share this blog
Related Resources
Making Sense of the Many I/O Count Fields in SMF | Cheryl Watson's Tuning Letter
In this reprint from Cheryl Watson’s Tuning Letter, Todd Havekost addresses a question about the different fields in SMF records having different values.
What's New with IntelliMagic Vision for z/OS? 2024.2
February 26, 2024 | This month we've introduced changes to the presentation of Db2, CICS, and MQ variables from rates to counts, updates to Key Processor Configuration, and the inclusion of new report sets for CICS Transaction Event Counts.
Expanding Role of Sub-Capacity Processors in Today's Mainframe Configurations | Cheryl Watson's Tuning Letter
In this reprint from Cheryl Watson’s Tuning Letter, Todd Havekost delves into the role of sub-capacity processors in mainframe upgrades, providing insights on transitioning to a more efficient CPC.
Book a Demo or Connect With an Expert
Discuss your technical or sales-related questions with our mainframe experts today