
If not resolved quickly, SAN Fabric bottlenecks (starting with the Inter-Switch Links) often result in buffer credit shortages which can lead to performance delays.
In this blog I’ll demonstrate how adding additional Inter-Switch Links (ISL) can spread out the load and reduce the utilization on your fabric. Afterwards, I’ll compare the utilization and buffer credit shortages/sec after an additional ISL was added.
Inter-Switch Links – Helping to Prevent Buffer Credit Shortages
The SAN Fabric is the collection of switches, and sometimes routers, that connect hosts to storage systems over a Fibre channel network.
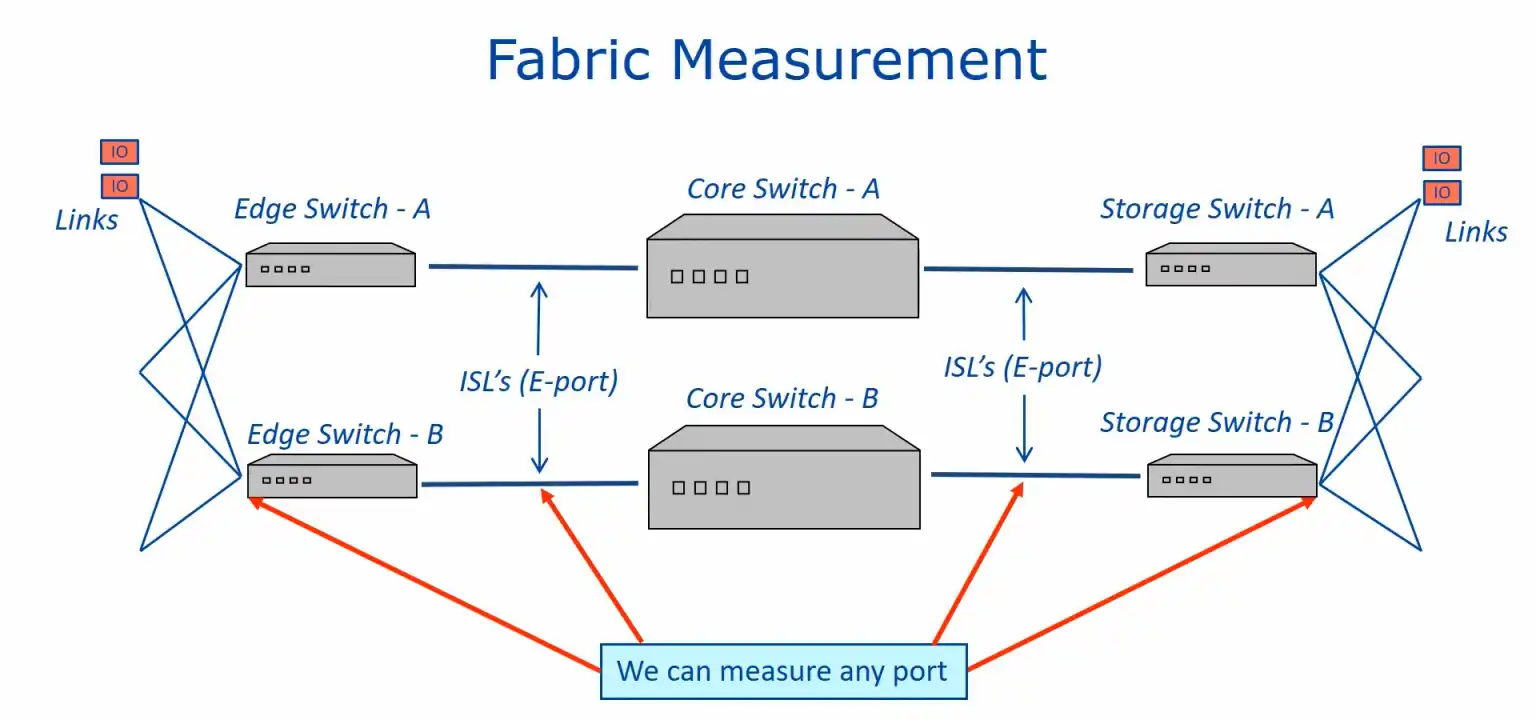
Figure 1: SAN Fabric Measurement
Currently, 8 Gbit/sec is the most common host interface speed, although we are seeing storage connections and switch connections running 16 Gbit/sec. In some Storage Area Network environments (SAN) there are switches that connect to other switches. These are called Inter-switch Links, or ISLs for short, and the port type for ISLs is ‘E’.
You can think of the ISL’s as the connectors that link major freeways. When these connectors do not have enough lanes to keep traffic flowing smoothly it can cause congestion and result in buffer credit shortages which can lead to performance delays.
How to Troubleshoot and Resolve Port Utilization Issues
Figure 2 below shows a port utilization chart by switch. The utilization data is aggregated at the switch level, so the average utilizations are pretty low. The ratings for the busiest port on each switch are rolled up to the switch level, so that if you look in the legend you will see ratings for several of the switches in bold and with ratings ranging between .40 and .76.
Anything over .3 indicates that the warning threshold has been exceed at least 30% of the time or the exception threshold has been exceeded 10% of the time.
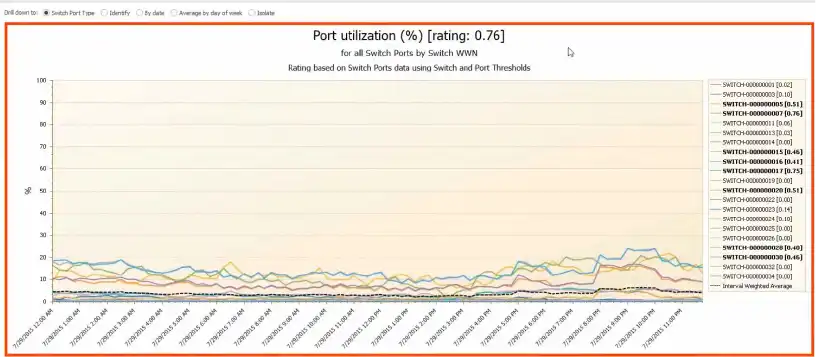
Figure 2: Port Utilization by Switch
I want to inspect the individual ports, so I drill down on SWITCH-000000015 as seen in Figure 3.
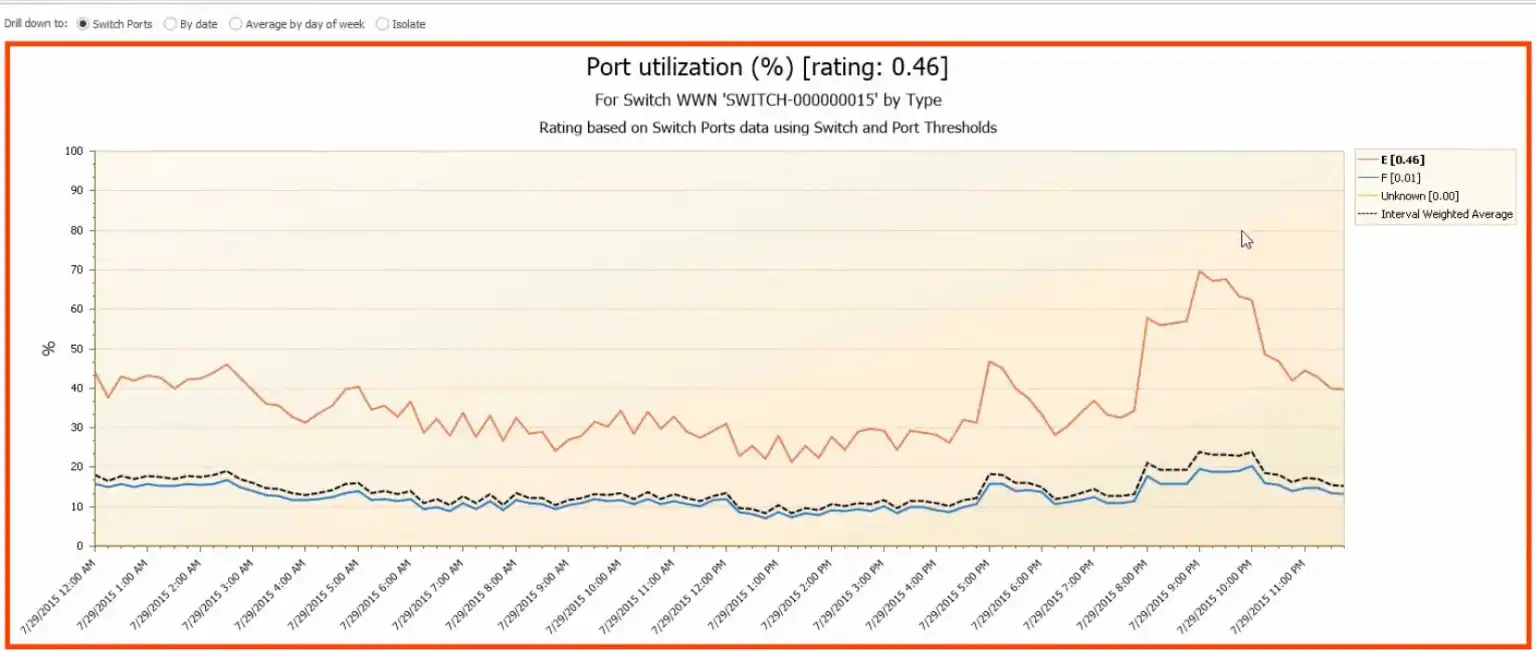
Figure 3: Switch Port Average Utilization by Port Type
Figure 3 shows the switch port average utilization by port type. The E port shows as the group of ports that has the highest rating with a rating of .46. I can drill down to the individual E ports by selecting the E port line in the chart.
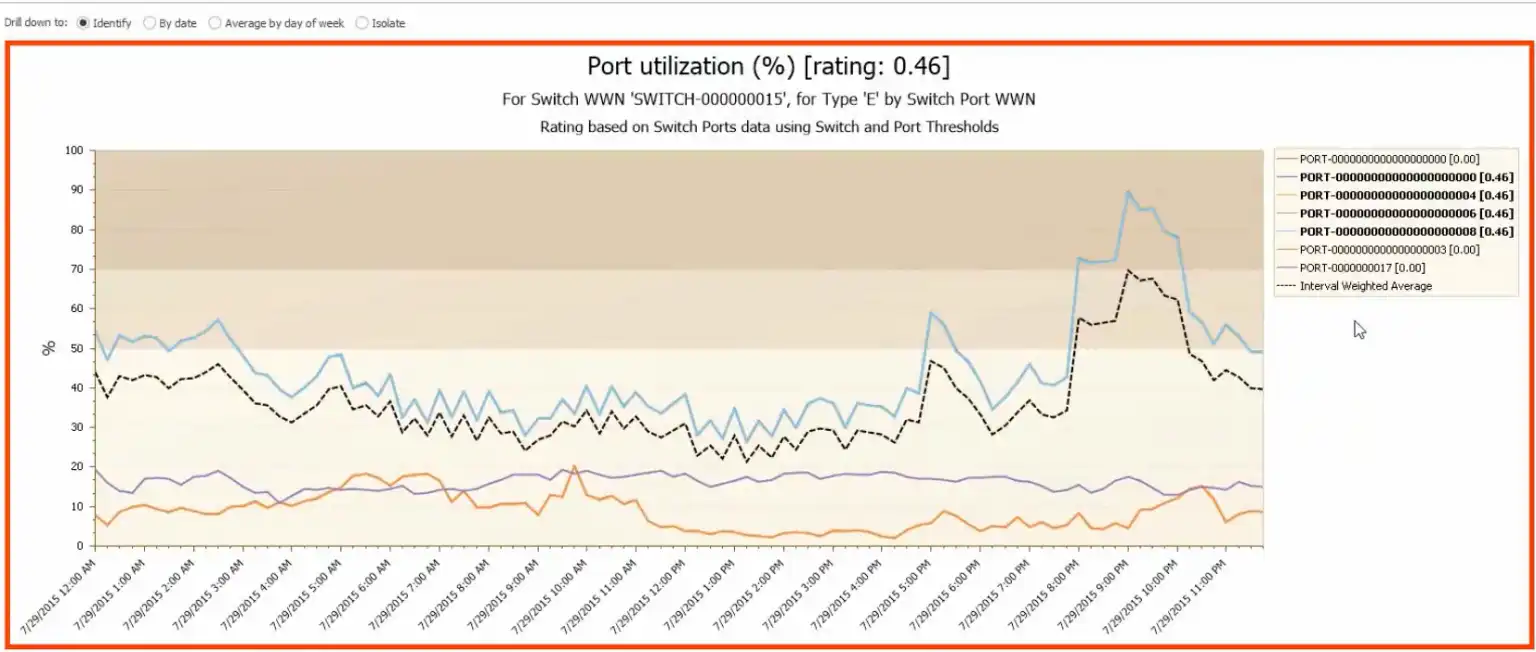
Figure 4: Switch Port Average Utilization for E Port
There are four ports in the legend in Figure 4 that have a rating of .46. During the peak period around 8:30 the utilization averages 90% for these four ports. This is very busy and is most likely contributing to buffer credit shortages at this time. Now let’s look at the buffer credit shortages during this period.
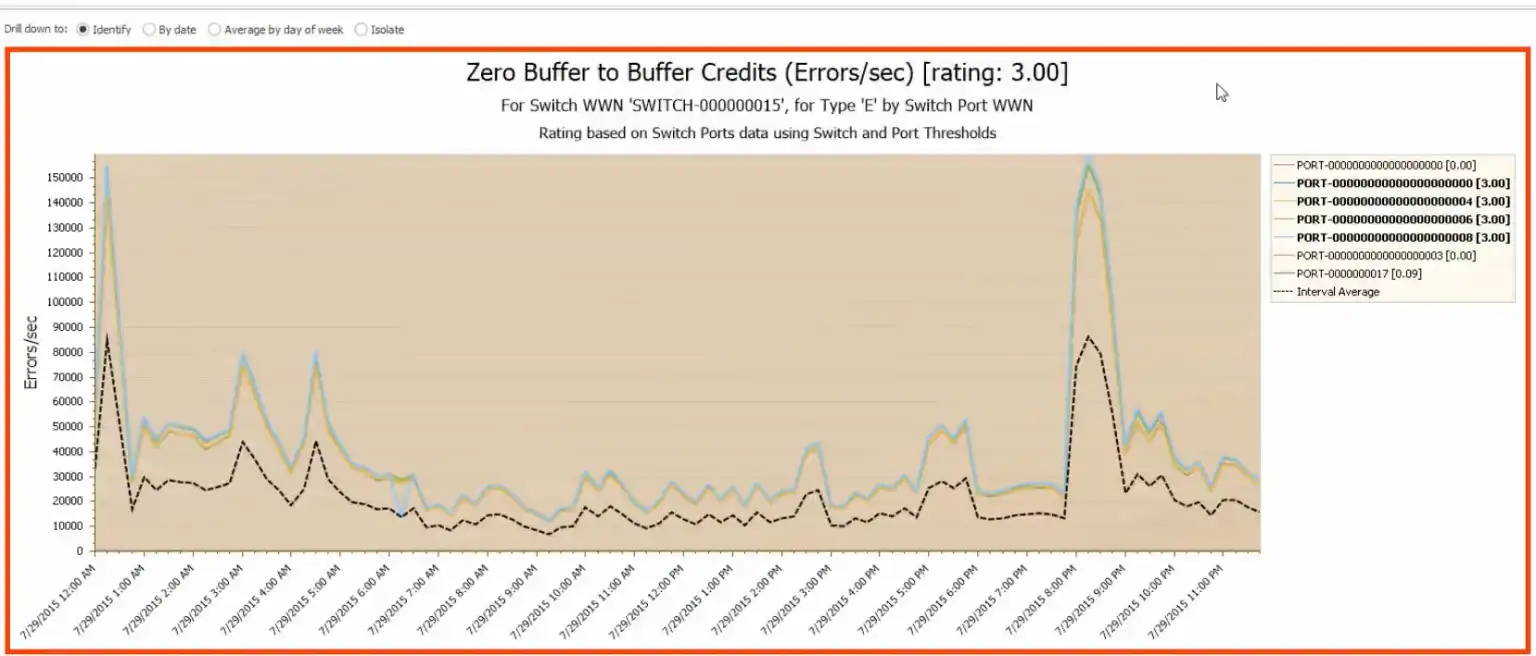
Figure 5: Zero Buffer to Buffer Credits
Figure 5 shows that during the period from 8:00 – 9:00 PM there were a significant number of buffer credit shortages. At this customer site we recommended adding an additional ISL to spread the load over another port. Let’s take a look at what happened when we added the additional ISL.
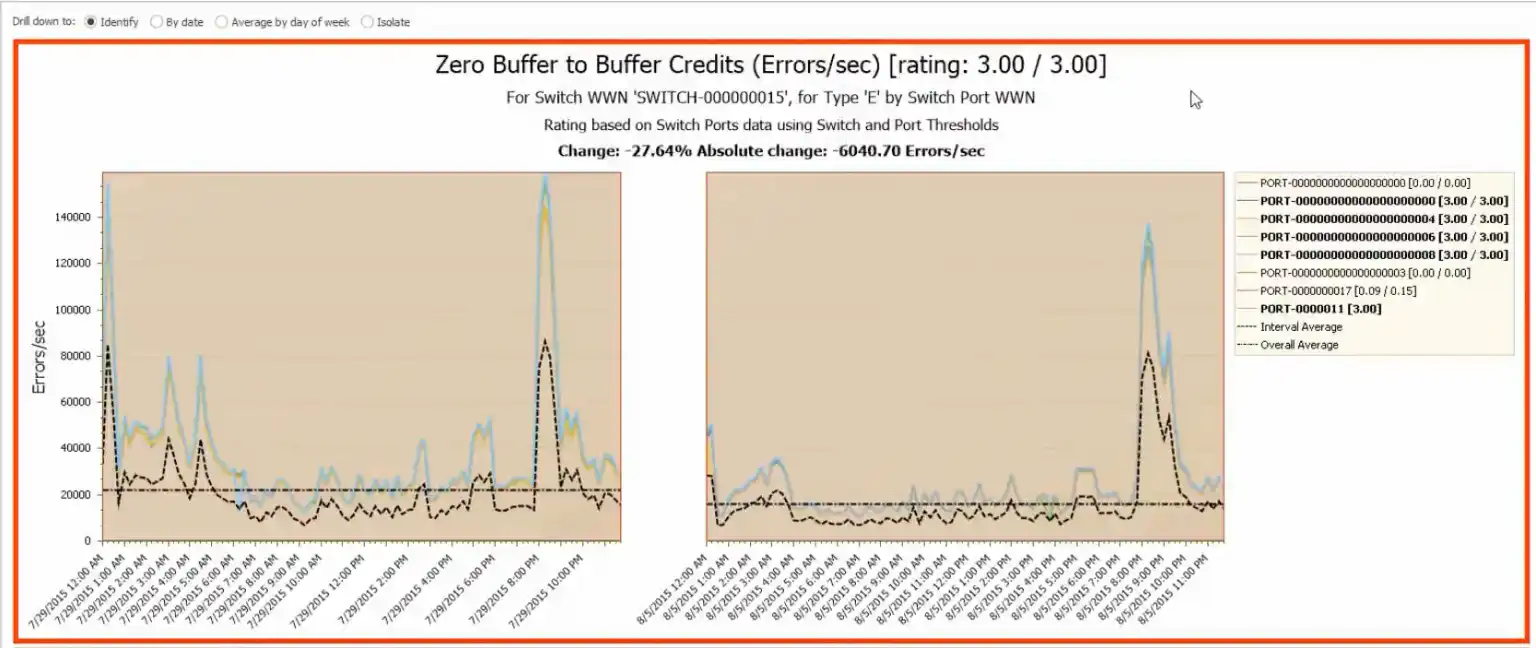
Figure 6: Zero Buffer to Buffer Credits (Before and After Added ISL)
Figure 6 shows the Zero Buffer to Buffer credits (Errors/sec) decreased by 27.64% or 6,040.70 errors per second. Let’s look at the utilization.
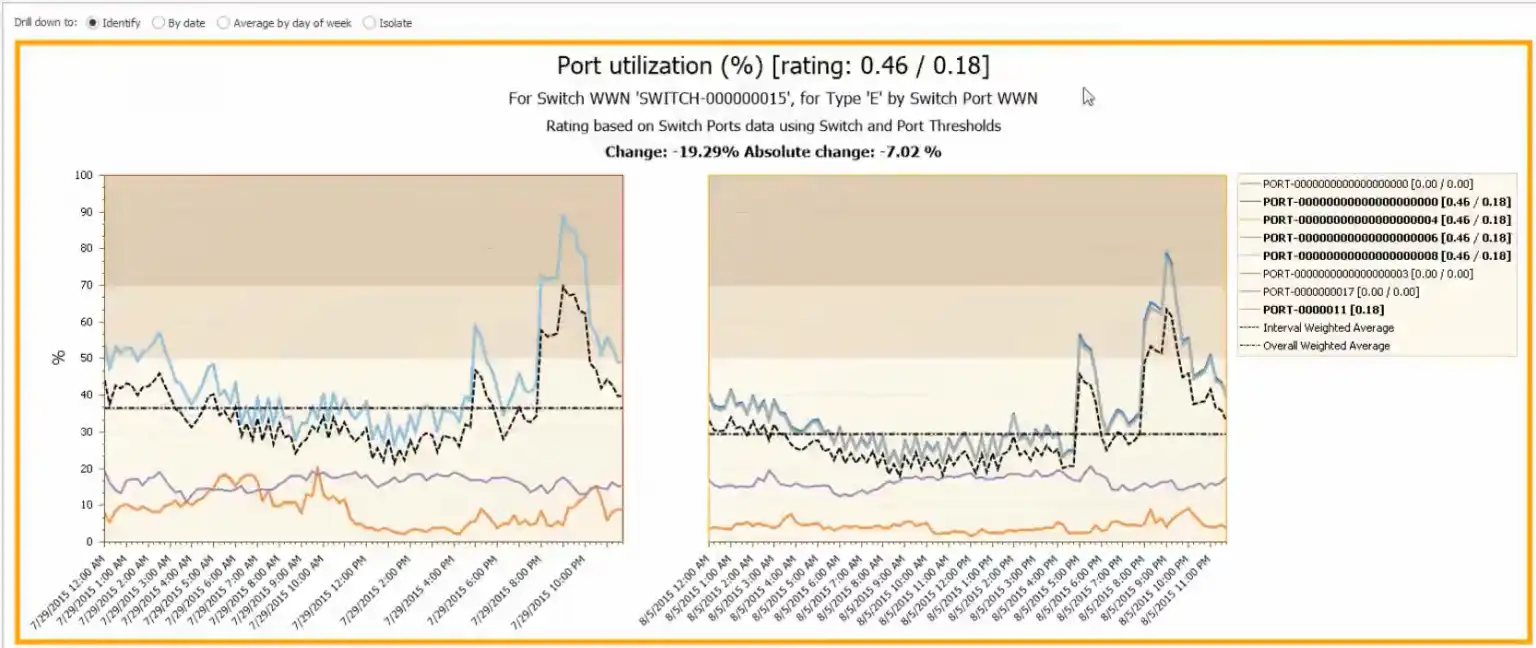
Figure 7: Port Utilization (Before and After Added ISL)
Figure 7 shows the port utilization improved by 19.29% with an absolute change of 7.02%. While it did not resolve all the issues, adding the additional ISL improved the performance and reduced the number of buffer credit errors/sec during the peak periods.
Resolve High ISL Port Utilization Issues with Built-in AI
Thanks to the built-in AI based best practice compliance ratings IntelliMagic Vision for SAN Fabric was able to automatically identify high ISL port utilization that, once addressed, resulted in a significant reduction in the overall utilization and buffer credit shortages on the ISL ports affected.
For more information on how IntelliMagic Vision can reduce risk and improve performance in your SAN environment contact us at info@intellimagic.com, or click here to start your trail today.
This article's author
 Brett Allison
 Share this blog
Subscribe to our Blogs
Subscribe to our newsletter and receive monthly updates about the latest industry news and high quality content, like webinars, blogs, white papers, and more.
Related Resources
How to Detect and Resolve “State in Doubt” Errors
IntelliMagic Vision helps reduce the visibility gaps and improves availability by providing deep insights, practical drill downs and specialized domain knowledge for your SAN environment.
Finding Hidden Time Bombs in Your VMware Connectivity
Seeing real end-to-end risks from the VMware guest through the SAN fabric to the Storage LUN is difficult, leading to many SAN Connectivity issues.
Platform-Specific Views: Vendor Neutral SAN Monitoring Part 2
Each distributed system platform has unique nuances. It's important for a solution to be capable of getting the detailed performance data capable of supporting vendor-specific architectures.
Request a Free Trial or Schedule a Demo Today
Discuss your technical or sales-related questions with our availability experts today