Automated Health Assessment for Workload Manager Goals
IntelliMagic Vision for z/OS leverages underlying knowledge about the Workload Manager to help you optimize goals and performance and alert you to otherwise hidden availability risks.

Optimize WLM Performance and Highlight Availability Risks
Dynamic workload management, which is performed by the Workload Manager (WLM), is an essential part of the z/OS operating system where multiple workloads run simultaneously.
Workloads are categorized into distinct service classes, for which a ‘goal’ and ‘importance’ is defined. The goal describes what performance a service class should get, and the importance defines how important it is that goals are met for this service class, relative to the other service classes. WLM uses this to make sure the most important workloads get priority at times when resources are scarce.
The performance index (PI) is the metric that measures whether WLM goals are met, by computing how high the response time was relative to the goal: PI = Measured Transaction Response Time / Response Time Goal. A value greater than 1 means the response time for the service class did not meet the goal.
With easy-to-use interactive data navigation, historical reporting, single-click data comparisons and report customizations, built-in recommendations and anomaly detection, and a comprehensive set of WLM reports, IntelliMagic Vision provides unrivaled visibility into your environment.
Clear Insights into WLM Goals
IntelliMagic Vision for z/OS makes a rating for how well goals were met, based on the height of the PI in combination with the importance. This gives clear insight into how well WLM manages to achieve its goals, and in case of missed goals, how severe problems are. These ratings are shown in the WLM dashboard.
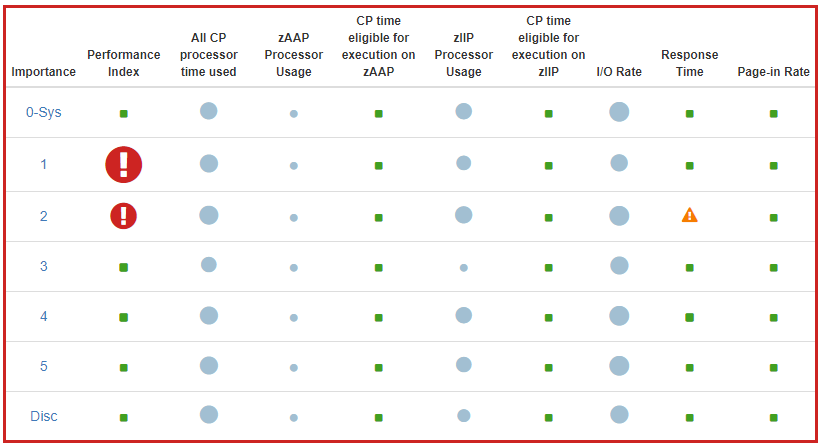
Understand Internal Components with Deep Insights
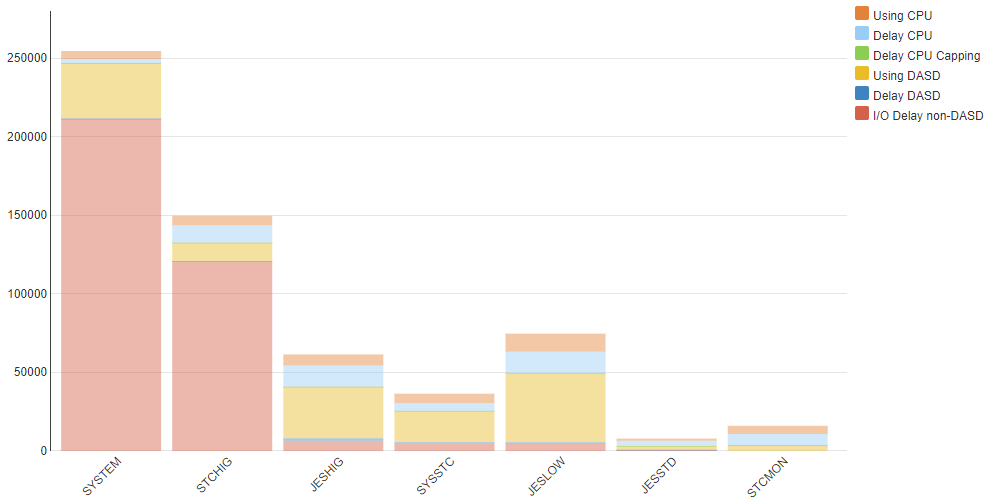
When the dashboard shows yellow or red bubbles, it is important to be able to find out why the response time goals were not met. The “using” and “delay” components of the response time are shown by IntelliMagic Vision at various levels, such as per LPAR or per service class. This provides a very deep insight in whether CPUs are busy doing actual work, or whether there is any contention on the processors or on the DASD.
For instance, when the Using DASD component is significant, it is very worthwhile to investigate using IntelliMagic Vision drill-downs if I/O tuning or a (partial) storage system upgrade can make a difference. These are likely much less expensive than a processor upgrade.
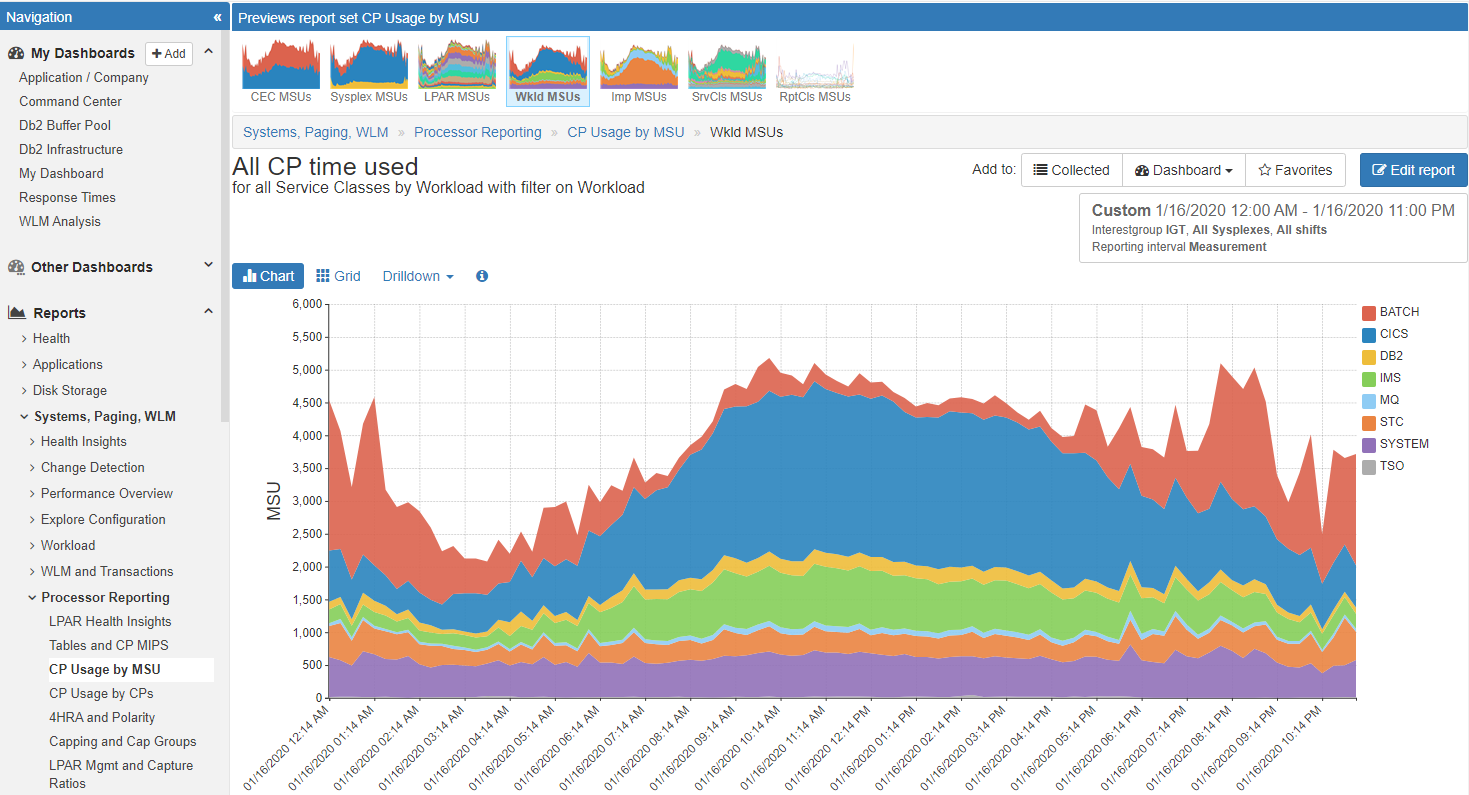
Intuitive Visibility into SMF Data
In contrast to approaches today that require coding programs or mastering tooling siloed by technology to access various types of SMF data, a common, intuitive user interface eliminates effort spent mining data and instead frees up staff to focus entirely on high-value analysis.
This single interface used across the entire z/OS platform greatly expedites learning, promotes collaboration, and enhances analytical effectiveness.
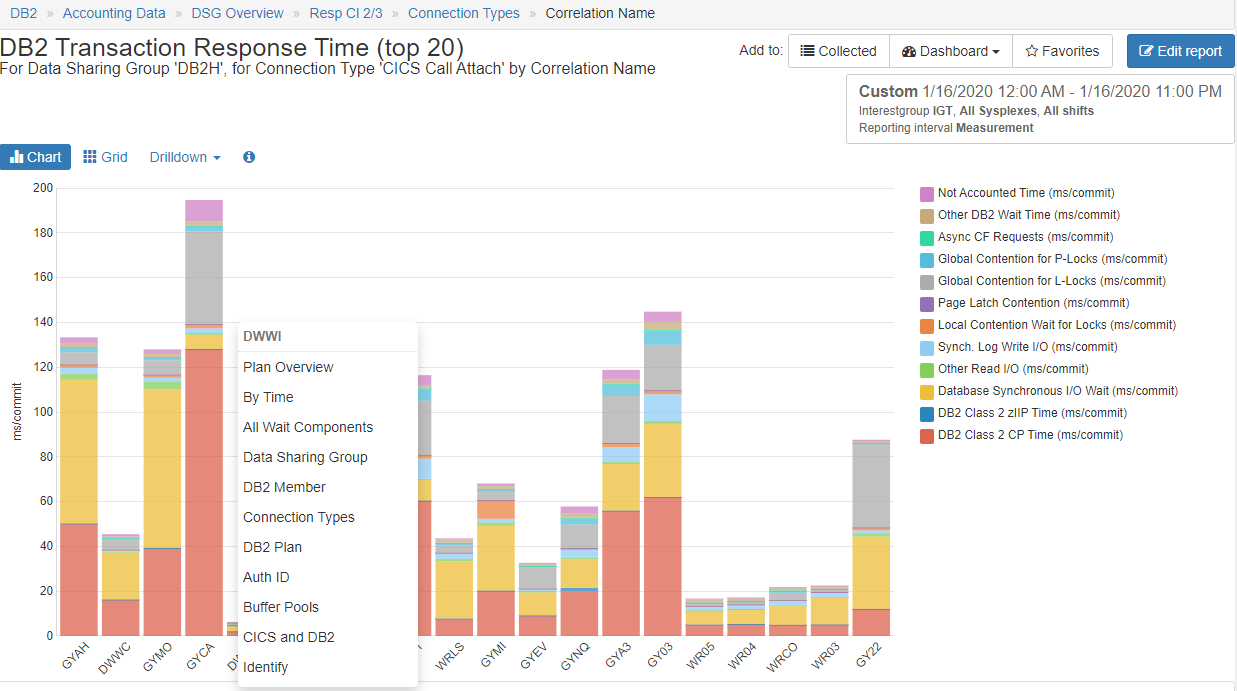
Context Sensitive Drill Downs
Context sensitive drill downs enable an analyst to identify alternative analytical paths based on the data currently being displayed and quickly investigate each hypothesis with just a few clicks, greatly reducing lost time when exploring what ends up being a “dead-end” path.
When dealing with massive SMF data volumes, this capability to focus analysis on the desired subset of data becomes especially valuable.
Accelerated Root Cause Analysis
Highly flexible drill-down capabilities of IntelliMagic Vision enable data to be viewed at the processor, system, card, or address space level and specific migration activity. Built-in conditional filters can further be a customized for a set of reports on a focused dashboard.
Quickly investigate each hypothesis with just a few clicks and greatly reducing lost time when exploring “dead-end” paths.
Secure and Flexible Deployment and Monitoring

In the Cloud
Cloud based deployment can be accessed from everywhere in the world and is easy to share with colleagues

Services & Support
Take advantage of IntelliMagic's experienced performance experts for standalone custom services or daily monitoring

On Premise
Install the software on premise and use it offline for total control of your installation
zSystems Performance Management
Optimize z/OS Mainframe Systems Management with Availability Intelligence
Benefits
Optimize z/OS Systems performance management using AI-driven analytics to proactively monitor and manage your z/OS environment, prevent disruptions, reduce costs, and preserve the reliability and availability that mainframes are known for.
Explore z/OS Systems Performance Analytics
Db2 Performance Management
Prevent Availability Risks and Optimize Db2 Performance
Benefits
The volume and complexity of Db2 Statistics data and Db2 Accounting data creates a major challenge for analysts who want to derive value from the rich metrics available.
Easy visibility into key Db2 metrics through SMF records is crucial to proactively prevent availability risks and to effectively manage and optimize performance.
Explore Db2 Performance Analytics
Easy visibility into key Db2 metrics through SMF records is crucial to proactively prevent availability risks and to effectively manage and optimize performance.
CICS Performance Management
Monitor and Profile CICS Transactions and Regions with IntelliMagic Vision
Benefits
CICS SMF Transaction data is a rich source of performance insights, but its volume can make analysis challenging using traditional approaches that rely on static reports. Proactive assessment of key Statistics metrics across all regions is essential to identify potential risks to availability.
IntelliMagic Vision enables performance analysts to manage and optimize their z/OS CICS transactions more effectively and efficiently, as well as proactively assess the health of their CICS regions.
Explore CICS Performance Analytics
IntelliMagic Vision enables performance analysts to manage and optimize their z/OS CICS transactions more effectively and efficiently, as well as proactively assess the health of their CICS regions.
Virtual Tape Performance Management
Proactively Manage Virtual and Physical Tape Environments
Benefits
With tape virtualization, tape storage became easier and more economical, but at the same time, more difficult to understand which changes or hardware upgrades are the best choices. With tape libraries being shared across multiple z/OS images, the full picture can only be obtained by aggregating workload and tape hardware information from all z/OS LPARs.
IntelliMagic Vision enables performance analysts to manage and optimize their z/OS Virtual Tape environments more effectively and efficiently.
Explore Tape Performance Analytics
IntelliMagic Vision enables performance analysts to manage and optimize their z/OS Virtual Tape environments more effectively and efficiently.
Disk & Replication Performance Management
Automatically Detect DASD Performance Risks & Quickly Resolve Issues
Benefits
As DASD speeds and throughputs have increased, z/OS applications have come to rely on fast and consistent storage performance. To respond quickly to unexpected disk and replication issues, it is essential that you have insight into the health of the various components in your storage environment.
IntelliMagic Vision enables performance analysts to manage and optimize their z/OS Disk and Replication environment more effectively and efficiently.
Explore Disk Performance Analytics
IntelliMagic Vision enables performance analysts to manage and optimize their z/OS Disk and Replication environment more effectively and efficiently.
MQ Performance Management
Optimize and Analyze MQ Activity and Performance
Benefits
MQ is widely used across z/OS environments, but sites often find it challenging to derive the valuable performance insights potentially available from MQ SMF Statistics and Accounting data due to limitations in existing reporting and available tooling.
IntelliMagic Vision enables performance analysts to manage and optimize their z/OS MQ configurations and activity more effectively and efficiently, as well as proactively assess the health of their queue managers.
Explore MQ Performance Analytics
IntelliMagic Vision enables performance analysts to manage and optimize their z/OS MQ configurations and activity more effectively and efficiently, as well as proactively assess the health of their queue managers.
z/OS Network Performance Management
Automatically Monitor Mainframe Network Security and Protect Your Data
Benefits
TCP/IP is the core of the communication for the z/OS mainframe, both for traffic into and out of the mainframe and internal communication among z/OS images and processor complexes. Proper management is necessary to secure and protect system availability.
IntelliMagic Vision automatically generates GUI-based, interactive, IBM best-practice compliant rated reports that proactively identify areas that indicate potential upcoming risk to TCP/IP health, performance, and security.
Explore z/OS Network Performance Analytics
IntelliMagic Vision automatically generates GUI-based, interactive, IBM best-practice compliant rated reports that proactively identify areas that indicate potential upcoming risk to TCP/IP health, performance, and security.
z/OS Connect: Modern Mainframe API Environment
Optimizing Mainframe API Monitoring for Improved Resource Management
Benefits
IntelliMagic Vision enhances mainframe API monitoring and profiling, providing crucial visibility to address issues at the API or service level, ultimately aiding performance analysts in better resource planning and management reporting.
Explore z/OS Connect Analytics
Book a Demo or Connect With an Expert
Discuss your technical or sales-related questions with our mainframe experts today