Monitor and Profile CICS Transactions and Regions with IntelliMagic Vision
IntelliMagic Vision enables performance analysts to manage and optimize their z/OS CICS regions and transactions more effectively and efficiently, as well as proactively assess the health of their CICS regions.
Analyze and Optimize CICS Performance with Built-In Health Insights and AI

Proactively Analyze and Prevent Risks
Utilize built-in health insights and artificial intelligence to proactively identify risks, ensure availability, and optimize your CICS environment.
Save Time and Quickly Resolve Issues
Quickly spot and resolve issues using thousands of out-of-the-box reports, built-in live edit, compare, share, and drill down features.

Expedite Learning and Enhance Domain Expertise
Detailed built-in explanations, guided drilldown options, and end-to-end z/OS support facilitates easy system understanding and knowledge transfer.
Built-In Intelligence at Your Fingertips
Proactively Assess Key CICS Region Metrics to Enhance Availability
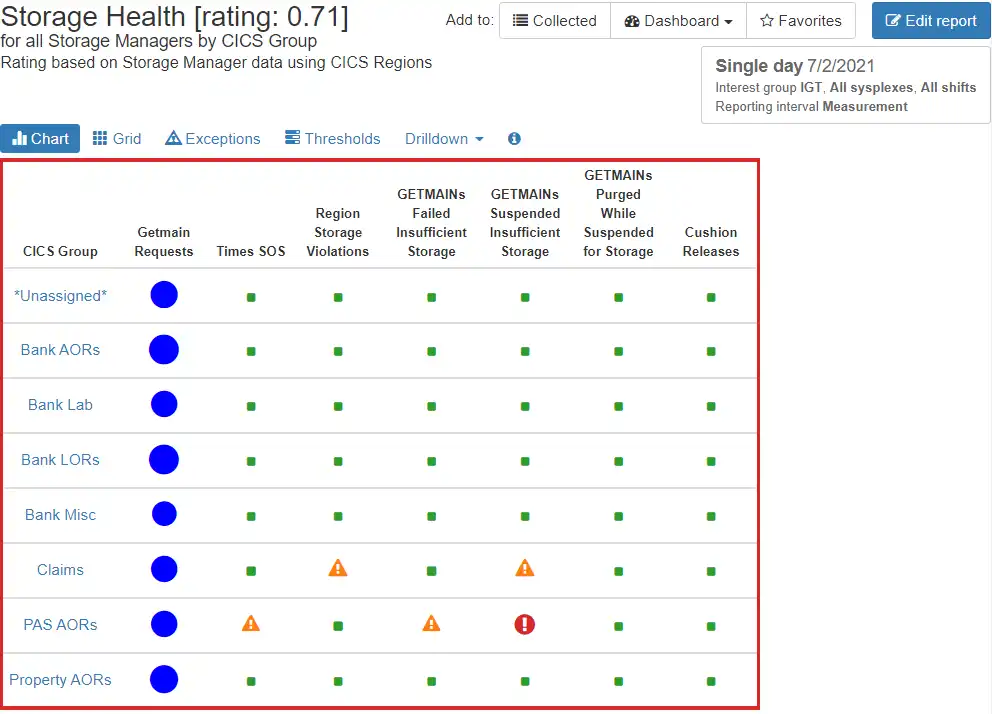
The CICS statistics 110.2 records contain many metrics that lend themselves to being assessed as part of the overall health of a region. IntelliMagic Vision assesses key metrics across every CICS region against best practice values to identify potential risks to availability that may warrant additional investigation.
The assessments are initially rolled up into user-defined logical groupings of regions and presented in a red/yellow/green manner that can be quickly consumed. From here the user can drill into additional levels of detail, all regions making up the selected group, or into time charts for the metrics.
View CICS Statistics Data at Additional Levels of Detail
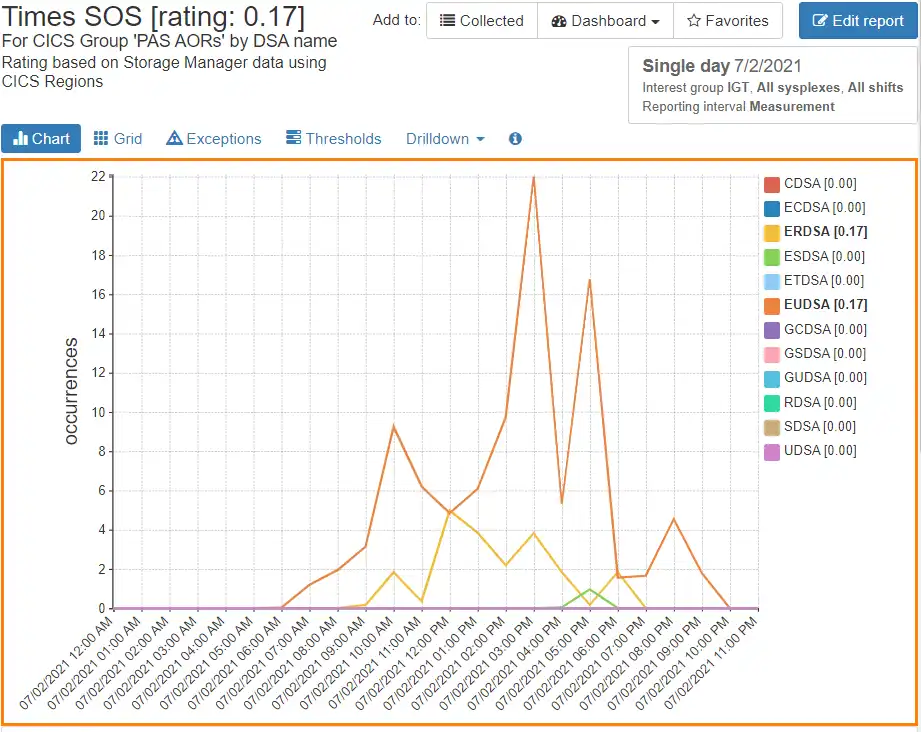
Many types of CICS Statistics data can be explored at additional levels of detail, e.g., file name, enqueue name, transaction class, and TCB mode. This image leverages dynamic navigation and context-sensitive drilldowns to determine which CICS storage areas are experiencing Short on Storage conditions.
View Transaction Response Time Profiles
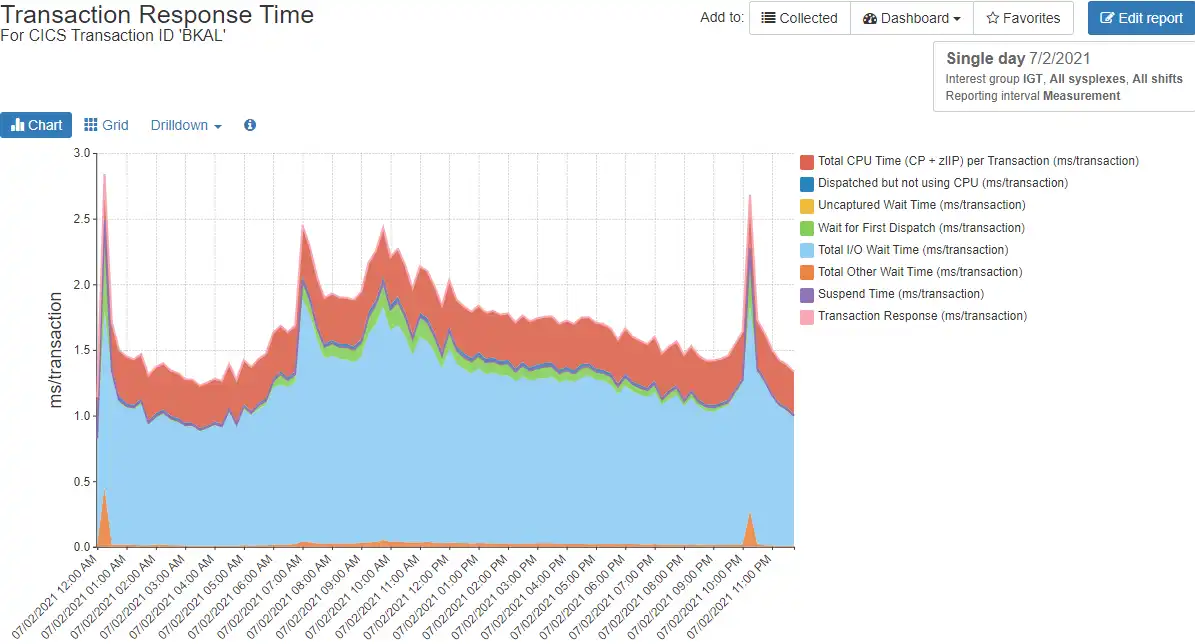
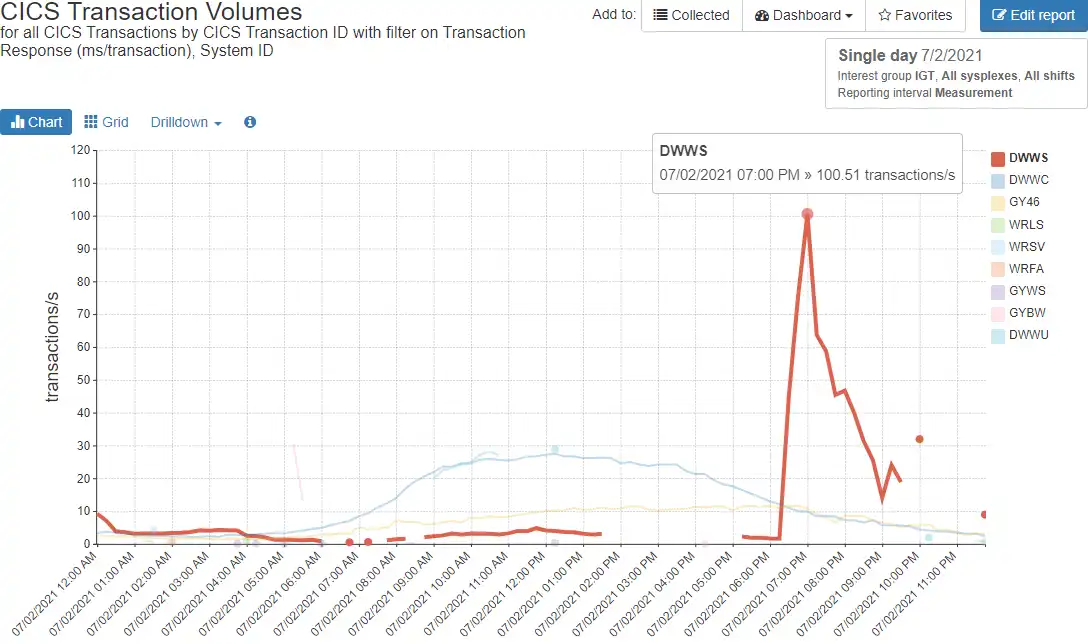
One common starting point for analysis of CICS workloads is a “Top n” view of transactions by total CPU consumption or by transaction volume.
Drill downs from here can quickly focus the analysis on response time profiles, with the nearly 100 timing buckets of the CICS SMF 110.1 records initially grouped into high-level summary categories (as shown here). From there the user can drill into the detailed components of the categories of interest.
Identify Primary Drivers of Transaction Response Times
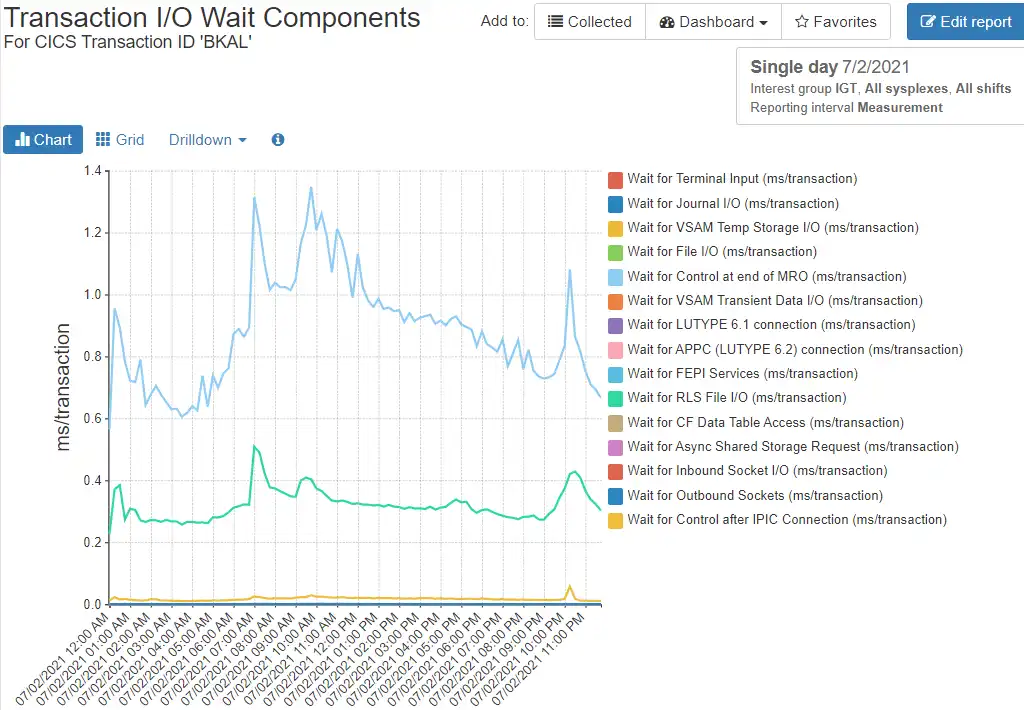
Once the initial response time display identifies the high-level categories that are primary contributors to response time, dynamic navigation and context-sensitive drilldowns can be leveraged to identify the specific components of interest.
If a primary response time category for a transaction is “Total I/O Wait Time” (as seen in the previous image), its subcomponents can be examined with a single click. Here “Wait for Control at end of MRO” and “Wait for RLS File I/O” are quickly identified as primary response time components.
Elapsed Time Profiles Across Transactions
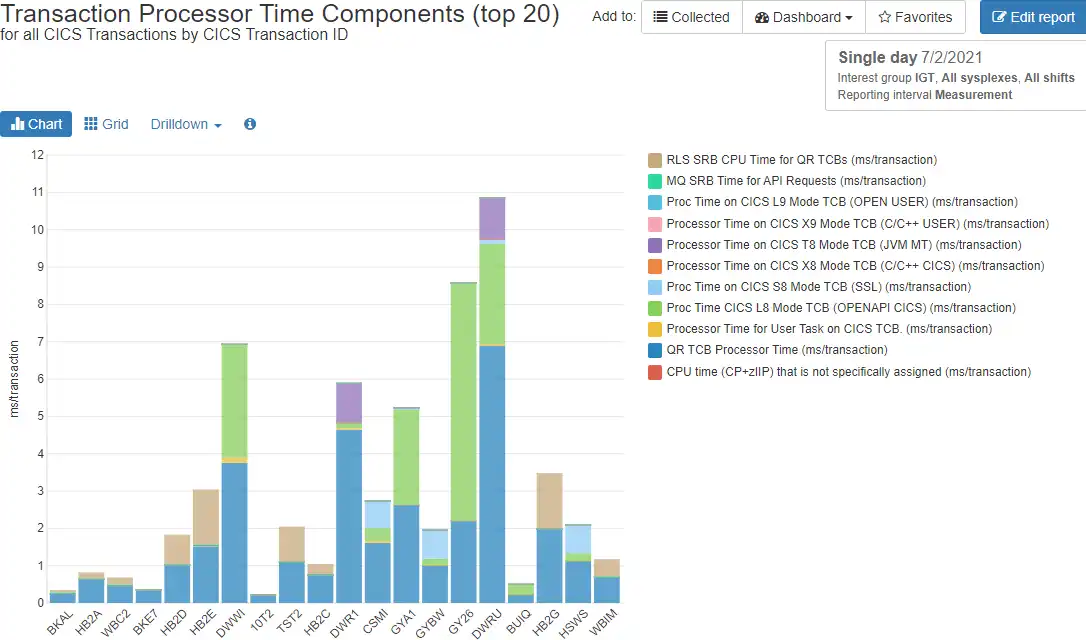
The ability to compare profiles across transactions by the primary CICS response time categories can also provide helpful insights. This example shows CPU per CICS transaction across the set of top transactions.
Global filters can also be specified to further focus the selected transactions.
Compare Across Time Intervals
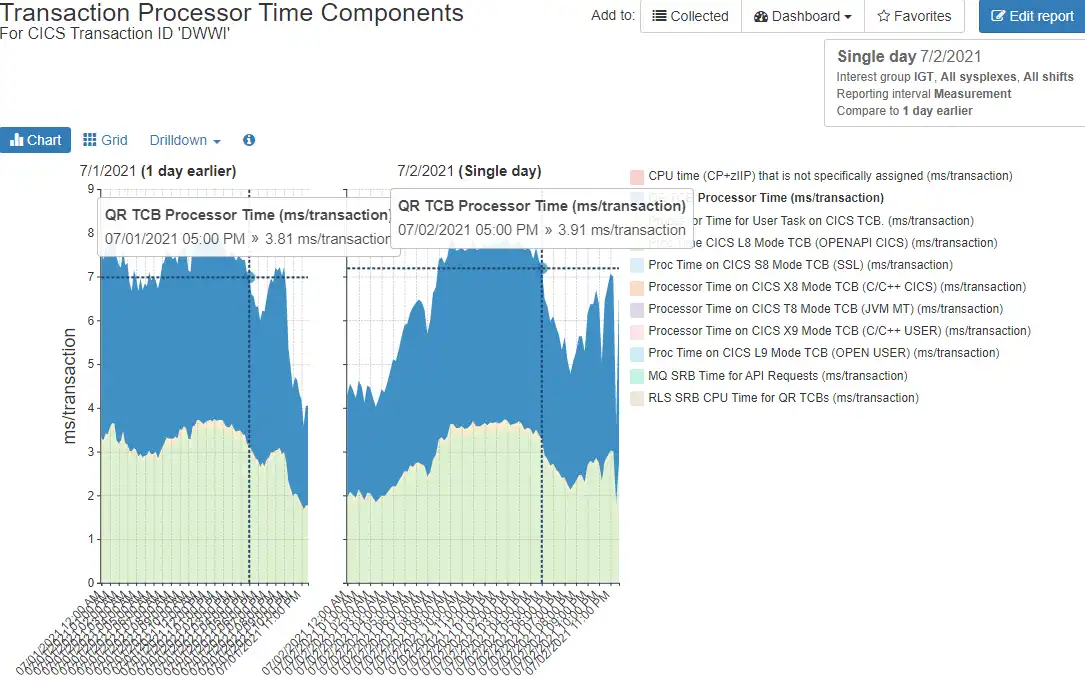
Comparisons across multiple time intervals are often of interest when analyzing the impact of the implementation of an application release on CPU per transaction. Throughout the product IntelliMagic Vision enables easy comparisons of values across any two time intervals to facilitate analysis.
In addition, crosshairs corresponding to the mouse position display tooltips with the numeric values for the selected interval, enabling at-a-glance comparison of specific before and after intervals.
Analysis Leveraging Response Time Views
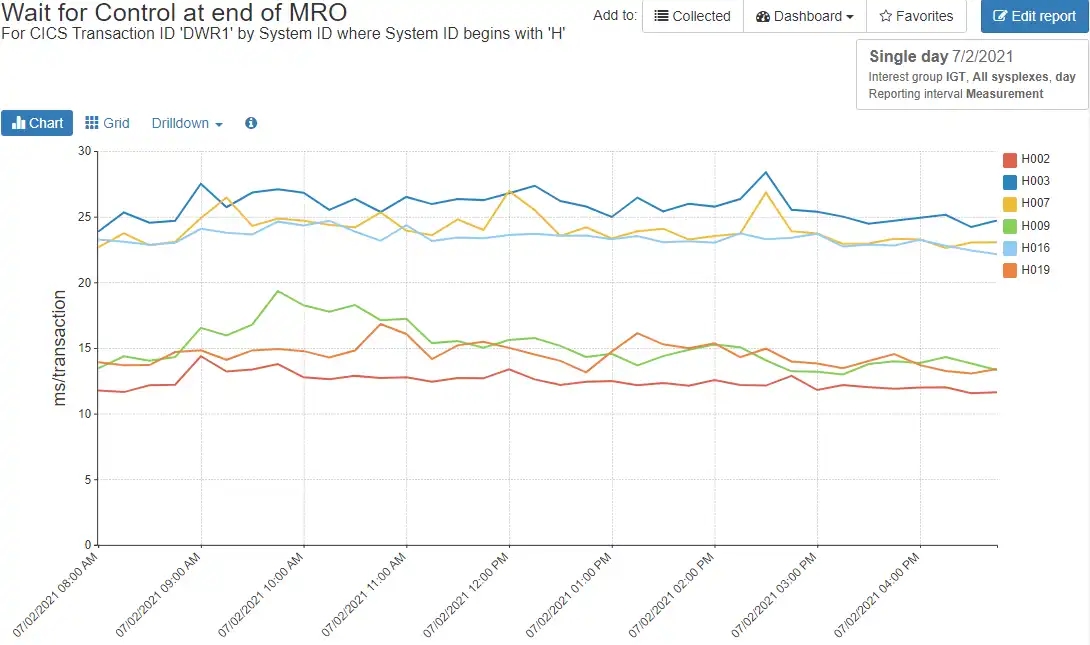
If investigating a response time issue, one may choose to begin from a response time view. From here, analysis seeking to isolate the issue may examine times for the selected transaction across systems and/or regions.
This image displays an example where a specific transaction timing component differs significantly across two sets of systems.
View Demo: Response Time Analysis Scenario 1 Values Differing by System ID
Integrating CICS Transaction with Db2 Data
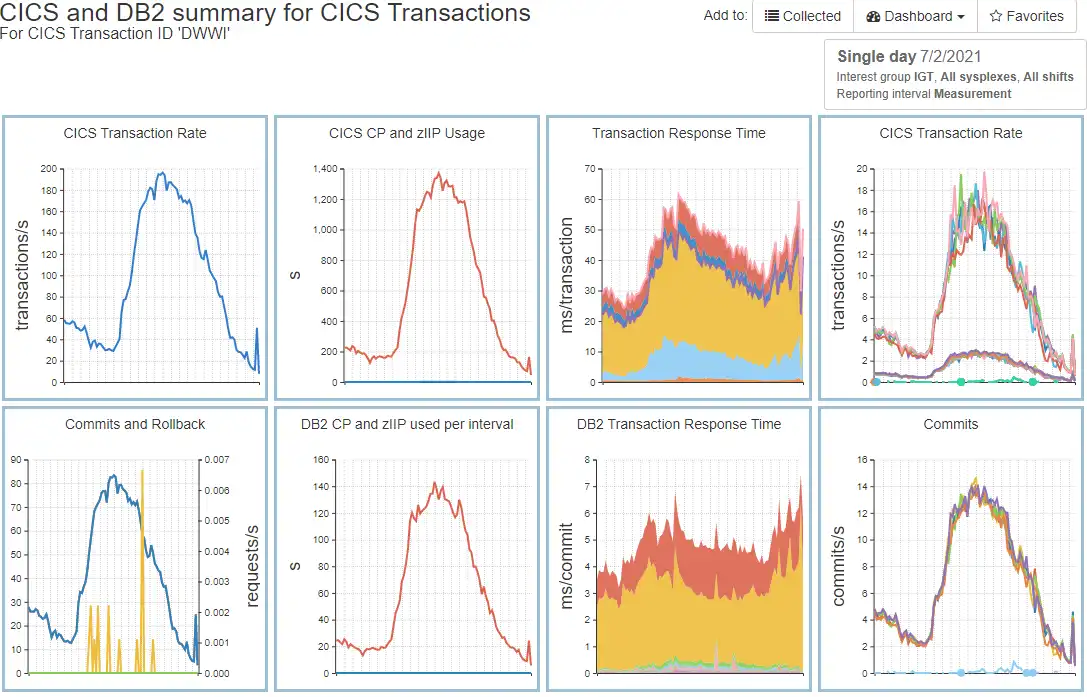
Capitalizing on the fact that Db2 Accounting data (SMF 101) captures the CICS transaction ID, IntelliMagic Vision seamlessly integrates key metrics from Db2 with the CICS SMF data.
This set of charts integrates metrics from the CICS perspective on the top row (based on the transaction ID) and DB2 perspective on the bottom row (using correlation ID from the Accounting data).
View Demo: CICS Transaction (110.1) and Db2 Accounting (101)
Leveraging Integrated Visibility Across Types of z/OS Data
IntelliMagic Vision delivers integrated visibility across various types of z/OS data to aid CICS and all types of performance analysis. In this scenario, a prior view from Systems data indicates a WLM goal not being met for selected time intervals.
Easy visibility across into CICS data shows increased volumes of a long-running transaction corresponding to the intervals when the WLM goal is being missed.
View Demo: Integrating WLM Performance Index and CICS Transaction Analysis
Analyzing Non-timing Transaction Data Fields
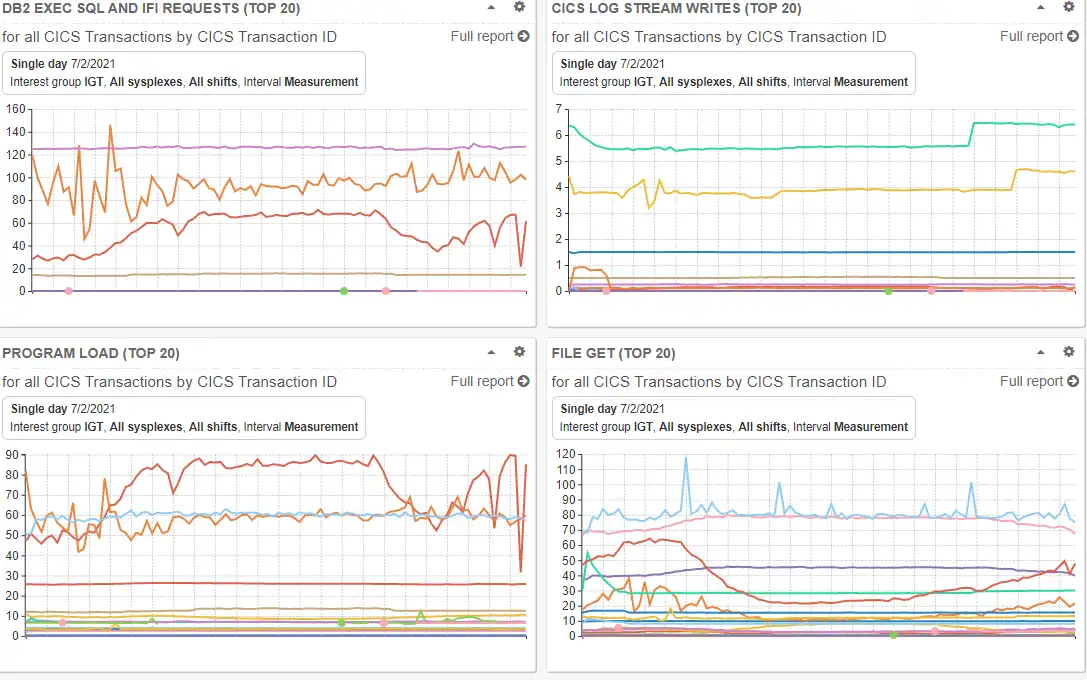
Finally, more than 250 non-timing fields in the CICS 110.1 records are available for detailed analysis and are organized into the subgroups provided in the IBM documentation.
The customized dashboard in this image shows examples of several of these, including Db2 SQL calls per CICS transaction, log stream writes, program loads, and file gets.
AIOps via SaaS Delivery
Advantages to adopting a cloud model include rapid implementation (no lead time to install and setup the product locally), minimal setup (only for transmitting SMF data), offloading staff resources required to deal with SMF processing issues or to install product maintenance, and easy access to IntelliMagic consulting services to supplement local skills.
Proactively Assess Key CICS Region Metrics to Enhance Availability
The CICS statistics 110.2 records contain many metrics that lend themselves to being assessed as part of the overall health of a region. IntelliMagic Vision assesses key metrics across every CICS region against best practice values to identify potential risks to availability that may warrant additional investigation.
The assessments are initially rolled up into user-defined logical groupings of regions and presented in a red/yellow/green manner that can be quickly consumed. From here the user can drill into additional levels of detail, all regions making up the selected group, or into time charts for the metrics.
View CICS Statistics Data at Additional Levels of Detail
Many types of CICS Statistics data can be explored at additional levels of detail, e.g., file name, enqueue name, transaction class, and TCB mode. This image leverages dynamic navigation and context-sensitive drilldowns to determine which CICS storage areas are experiencing Short on Storage conditions.
View Transaction Response Time Profiles
One common starting point for analysis of CICS workloads is a “Top n” view of transactions by total CPU consumption or by transaction volume.
Drill downs from here can quickly focus the analysis on response time profiles, with the nearly 100 timing buckets of the CICS SMF 110.1 records initially grouped into high-level summary categories (as shown here). From there the user can drill into the detailed components of the categories of interest.
Identify Primary Drivers of Transaction Response Times
Once the initial response time display identifies the high-level categories that are primary contributors to response time, dynamic navigation and context-sensitive drilldowns can be leveraged to identify the specific components of interest.
If a primary response time category for a transaction is “Total I/O Wait Time” (as seen in the previous image), its subcomponents can be examined with a single click. Here “Wait for Control at end of MRO” and “Wait for RLS File I/O” are quickly identified as primary response time components.
Elapsed Time Profiles Across Transactions
The ability to compare profiles across transactions by the primary CICS response time categories can also provide helpful insights. This example shows CPU per CICS transaction across the set of top transactions.
Global filters can also be specified to further focus the selected transactions.
Compare Across Time Intervals
Comparisons across multiple time intervals are often of interest when analyzing the impact of the implementation of an application release on CPU per transaction. Throughout the product IntelliMagic Vision enables easy comparisons of values across any two time intervals to facilitate analysis.
In addition, crosshairs corresponding to the mouse position display tooltips with the numeric values for the selected interval, enabling at-a-glance comparison of specific before and after intervals.
Analysis Leveraging Response Time Views
If investigating a response time issue, one may choose to begin from a response time view. From here, analysis seeking to isolate the issue may examine times for the selected transaction across systems and/or regions.
This image displays an example where a specific transaction timing component differs significantly across two sets of systems.
View Demo: Response Time Analysis Scenario 1 Values Differing by System ID
Integrating CICS Transaction with Db2 Data
Capitalizing on the fact that Db2 Accounting data (SMF 101) captures the CICS transaction ID, IntelliMagic Vision seamlessly integrates key metrics from Db2 with the CICS SMF data.
This set of charts integrates metrics from the CICS perspective on the top row (based on the transaction ID) and DB2 perspective on the bottom row (using correlation ID from the Accounting data).
View Demo: CICS Transaction (110.1) and Db2 Accounting (101)
Leveraging Integrated Visibility Across Types of z/OS Data
IntelliMagic Vision delivers integrated visibility across various types of z/OS data to aid CICS and all types of performance analysis. In this scenario, a prior view from Systems data indicates a WLM goal not being met for selected time intervals.
Easy visibility across into CICS data shows increased volumes of a long-running transaction corresponding to the intervals when the WLM goal is being missed.
View Demo: Integrating WLM Performance Index and CICS Transaction Analysis
Analyzing Non-timing Transaction Data Fields
Finally, more than 250 non-timing fields in the CICS 110.1 records are available for detailed analysis and are organized into the subgroups provided in the IBM documentation.
The customized dashboard in this image shows examples of several of these, including Db2 SQL calls per CICS transaction, log stream writes, program loads, and file gets.
AIOps via SaaS Delivery
Advantages to adopting a cloud model include rapid implementation (no lead time to install and setup the product locally), minimal setup (only for transmitting SMF data), offloading staff resources required to deal with SMF processing issues or to install product maintenance, and easy access to IntelliMagic consulting services to supplement local skills.
End-to-End Infrastructure Analytics for z/OS Performance Management
zSystems Performance Management
Optimize z/OS Mainframe Systems Management with Availability Intelligence
Benefits
Optimize z/OS Systems performance management using AI-driven analytics to proactively monitor and manage your z/OS environment, prevent disruptions, reduce costs, and preserve the reliability and availability that mainframes are known for.
Explore z/OS Systems Performance Analytics
Db2 Performance Management
Prevent Availability Risks and Optimize Db2 Performance
Benefits
The volume and complexity of Db2 Statistics data and Db2 Accounting data creates a major challenge for analysts who want to derive value from the rich metrics available.
Easy visibility into key Db2 metrics through SMF records is crucial to proactively prevent availability risks and to effectively manage and optimize performance.
Explore Db2 Performance Analytics
Easy visibility into key Db2 metrics through SMF records is crucial to proactively prevent availability risks and to effectively manage and optimize performance.
CICS Performance Management
Monitor and Profile CICS Transactions and Regions with IntelliMagic Vision
Benefits
CICS SMF Transaction data is a rich source of performance insights, but its volume can make analysis challenging using traditional approaches that rely on static reports. Proactive assessment of key Statistics metrics across all regions is essential to identify potential risks to availability.
IntelliMagic Vision enables performance analysts to manage and optimize their z/OS CICS transactions more effectively and efficiently, as well as proactively assess the health of their CICS regions.
Explore CICS Performance Analytics
IntelliMagic Vision enables performance analysts to manage and optimize their z/OS CICS transactions more effectively and efficiently, as well as proactively assess the health of their CICS regions.
Virtual Tape Performance Management
Proactively Manage Virtual and Physical Tape Environments
Benefits
With tape virtualization, tape storage became easier and more economical, but at the same time, more difficult to understand which changes or hardware upgrades are the best choices. With tape libraries being shared across multiple z/OS images, the full picture can only be obtained by aggregating workload and tape hardware information from all z/OS LPARs.
IntelliMagic Vision enables performance analysts to manage and optimize their z/OS Virtual Tape environments more effectively and efficiently.
Explore Tape Performance Analytics
IntelliMagic Vision enables performance analysts to manage and optimize their z/OS Virtual Tape environments more effectively and efficiently.
Disk & Replication Performance Management
Automatically Detect Disk Performance Risks & Quickly Resolve Issues
Benefits
As Disk speeds and throughputs have increased, z/OS applications have come to rely on fast and consistent storage performance. To respond quickly to unexpected disk and replication issues, it is essential that you have insight into the health of the various components in your storage environment.
IntelliMagic Vision enables performance analysts to manage and optimize their z/OS Disk and Replication environment more effectively and efficiently.
Explore Disk Performance Analytics
IntelliMagic Vision enables performance analysts to manage and optimize their z/OS Disk and Replication environment more effectively and efficiently.
MQ Performance Management
Optimize and Analyze MQ Activity and Performance
Benefits
MQ is widely used across z/OS environments, but sites often find it challenging to derive the valuable performance insights potentially available from MQ SMF Statistics and Accounting data due to limitations in existing reporting and available tooling.
IntelliMagic Vision enables performance analysts to manage and optimize their z/OS MQ configurations and activity more effectively and efficiently, as well as proactively assess the health of their queue managers.
Explore MQ Performance Analytics
IntelliMagic Vision enables performance analysts to manage and optimize their z/OS MQ configurations and activity more effectively and efficiently, as well as proactively assess the health of their queue managers.
z/OS Network Performance Management
Automatically Monitor Mainframe Network Security and Protect Your Data
Benefits
TCP/IP is the core of the communication for the z/OS mainframe, both for traffic into and out of the mainframe and internal communication among z/OS images and processor complexes. Proper management is necessary to secure and protect system availability.
IntelliMagic Vision automatically generates GUI-based, interactive, IBM best-practice compliant rated reports that proactively identify areas that indicate potential upcoming risk to TCP/IP health, performance, and security.
Explore z/OS Network Performance Analytics
IntelliMagic Vision automatically generates GUI-based, interactive, IBM best-practice compliant rated reports that proactively identify areas that indicate potential upcoming risk to TCP/IP health, performance, and security.
z/OS Connect: Modern Mainframe API Environment
Optimizing Mainframe API Monitoring for Improved Resource Management
Benefits
IntelliMagic Vision enhances mainframe API monitoring and profiling, providing crucial visibility to address issues at the API or service level, ultimately aiding performance analysts in better resource planning and management reporting.
Explore z/OS Connect Analytics
See Why IntelliMagic is Trusted by Some of the World’s Largest Mainframe Sites
Book a Demo or Connect With an Expert
Discuss your technical or sales-related questions with our mainframe experts today
Solutions for your Problems
Elevate IT Team Impact
Empower new staff and experts. Replace antiquated reporting with automated, intelligent analytics.
Benefits
Artificial Intelligence using built-in expert knowledge and statistics assesses and rates key metrics as good versus bad from a performance or efficiency perspective for the analyst.
Force multiplier - Invite AI to the team to help both new and expert team members in a tight job market.
Cloud Delivery - Immediate access with no maintenance needed.
Force multiplier - Invite AI to the team to help both new and expert team members in a tight job market.
Cloud Delivery - Immediate access with no maintenance needed.
Optimize & Reduce Costs Safely
Save money without compromising service levels or availability.
Benefits
Reduce cost with superior visibility into drivers of cost such as inefficient CPU utilization, configuration and priority issues, imbalance of workloads across hardware resources, consolidation opportunities, etc.
Reduce hardware spend without negative impact on service levels.
Avoid the costs of service delivery problems without both human cost and application unavailability cost.
Reduce hardware spend without negative impact on service levels.
Avoid the costs of service delivery problems without both human cost and application unavailability cost.
Prevent Performance Problems
Predict and Prevent many IT issues without incurring typical false positive and false negative issues.
Benefits
Automatically quantify risks in the z/OS infrastructure for peak workloads or configuration issues prior to production impact being felt by application end-users. Go beyond KPI to KRI (Key Risk Indicators) root cause monitoring.
Continuous Health Assessment of application and infrastructure stress; assesses millions of metrics using context-specific expert knowledge and statistical techniques.
Continuous Health Assessment of application and infrastructure stress; assesses millions of metrics using context-specific expert knowledge and statistical techniques.
Resolve Issues Quickly
Accelerate Mean Time To Resolution for unpredictable problems with AI-augmented diagnosis.
Benefits
Rapidly identify where problems are occurring with infrastructure wide exception (anomaly) tables, intelligent navigation through the data from big picture to extremely granular levels, automated compare of time periods, and more.
See and understand what applications are affected, what part of the infrastructure, what time frames, and get clues as to probable cause.
See and understand what applications are affected, what part of the infrastructure, what time frames, and get clues as to probable cause.
Flexible Deployment and Monitoring

In the Cloud
Cloud based deployment can be accessed from everywhere in the world and is easy to share with colleagues

Services & Support
Take advantage of IntelliMagic's experienced performance experts for standalone custom services or daily monitoring

On Premise
Install the software on premise and use it offline for total control of your installation
Optimize and Analyze CICS Transactions and Regions
CICS SMF Transaction data is a rich source of performance insights, but its volume can make analysis challenging using traditional approaches that rely on static reports. Proactive assessment of key Statistics metrics across all regions is essential to identify potential risks to availability.
IntelliMagic Vision provides GUI-based, interactive reports with dynamic navigation and context-sensitive drilldowns to facilitate rapid and focused access to CICS data to tune, optimize, and profile your transactions.
With IntelliMagic Vision, you will be able to:
- Profile CICS transactions and analyze response times
- Save time with quick access to interactive reports by transaction/CICS region
- Leveraging automated assessments of key metrics to manage large numbers of regions and proactively direct your attention to potential risks to region availability and performance
- Analyze levels of detail within CICS regions provided by the Statistics data including by storage area, TCB pool and mode, TCLASS, and enqueue names
- Leverage integrated visibility across various types of z/OS data to aid CICS analysis
- Get access to CICS raw data to filter, compare, and find problems
IntelliMagic Vision offers you the out-of-the-box visibility and seamless navigation to manage every component of your z Systems infrastructure under a single solution.
Continue Learning with These Resources
Brochures and Datasheets
Connect With an Expert
Discuss your technical or sales-related questions with our mainframe experts today