
Everyone wants performance analysts to be proactive but what does that really mean? If I look in the dictionary for “proactive”, I find the following definition: “Acting in anticipation of future problems, needs, or changes”. It seems like we need to be some sort of modern soothsayer to be truly proactive. But the right technology can help us be proactive without resorting to the dark arts.
Wouldn’t you like to avoid most surprises in your SAN environment? Chances are you can. Over the years I have learned the hard way that spending a little bit of time proactively assessing the health of the SAN environment is worth a thousand hours of reactive problem management.
Some History
Many years ago, I had a job at IBM where I helped manage a large SAN infrastructure with more than 20 storage arrays. There were lots of point solutions for managing the storage arrays, but there was nothing that provided my performance team with a simple view of the performance health of the storage.
Initially it took my teammate and I a couple of weeks to assess the health of each individual unit. Over the course of a few months I identified the key performance indicators for these arrays. I then created an automated report that would pull the necessary information and create a report summarizing the performance health across the storage infrastructure.
This updated approach reduced the amount of time required for analysis to just a couple of hours. It also gave us the information we needed to make workload adjustments and plan storage capacity allocations without experiencing painful performance issues.
Over time I refined this reporting into a full-blown interactive Linux Apache MYSQL PHP (LAMP) solution. I just dated myself but that’s okay. It was a fun project. The point is, we could do the analysis on-demand and it only took a few minutes a day to perform. This allowed us to spend a few minutes every morning doing a health assessment.
Fast forward to 2010. I joined the IntelliMagic team where we began to realize our joint vision to provide a proactive, end–to–end performance management solution for all SAN environments.
After nine years we have made a lot of improvements including the addition of in-depth platform support for most industry leading storage arrays, VMware performance and configuration reporting, SAN switch performance and health, and end–to–end topology mapping for all supported platforms. I now feel I have all the necessary tools to conduct proactive health assessments of almost any SAN environment.
Daily Proactive Best Practices for Managing your SAN Performance
While storage arrays have become faster, more reliable and cheaper over the last 15 years, there are still things that can go wrong. In terms of the evolution of best practices for SAN health, the main thing that has changed since then is that with fewer performance issues, the health assessment needs to be more holistic. Besides performance, it needs to include the capacity and configuration attributes of SAN health.
The purpose of this blog is to illustrate some of the things that can be done to proactively avoid potential SAN storage issues.
Best Practice #1: Daily Review of Vendor Specific Storage Array Key Performance Indicators (Performance)
Each vendor has a slightly different architecture. Sometimes the differences are trivial but often they are not. IntelliMagic does a couple of very helpful things from the point of view of a performance analyst.
It presents all the key performance indicators relevant to each vendor in a single view. The second and most important part of this view is the assessment and rating of the health of each key performance indicator. IntelliMagic Vision tells you what is bad or risky. The assessment is based on a deep understanding of the configuration, architecture and workload.
In Figure 1: INFINIDAT Storage System Performance Health we see the key performance indicators across the top in the column header position. Along the y-axis are the names of the storage systems.
There are several things in the display that are important to note. The first is the red border around the chart. This indicates that there is a performance concern. The red border is there because of the red circle with an exclamation mark for the storage system with serial, “AMDC-INFINIBOX01”. It is triggered because the Read and Write Throughput metric is above the performance exception threshold for at least 10% of the analysis period.
The yellow triangle icon (like a yield sign shape) indicates a performance warning for the Front-end Read Response time. The green indicators for all the other metrics indicate that there are no significant warnings or exceptions for the other metrics. Furthermore, you can drill down on any of these areas to identify the cause of the performance concern.
By keeping an eye on this dashboard, you can understand if there are any storage risks in the environment.
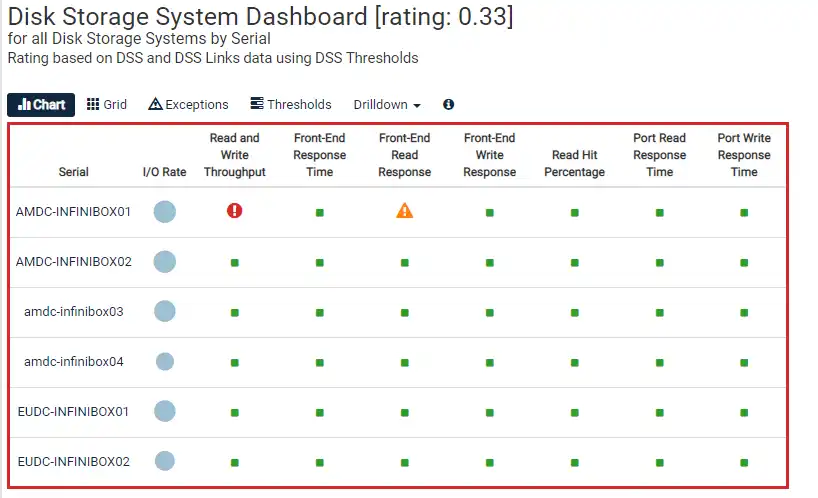
Figure 1: INFINIDAT Storage System Performance Health
Best Practice #2: Daily Review of SAN Fabric Health (Performance)
There are lots of things that can go wrong in a SAN fabric. Fortunately, both hardware errors and performance metrics are available from both Brocade and Cisco.
Figure 2: SAN Fabric Health shows the switches in the environment along with their key health indicators. The red border is a result of one or more red exclamation points for some of the errors. This indicates that the frequency of these errors is significant and should be further investigated.
In one quick view I can assess the overall health of my SAN switch equipment and drill down to identify which port is having the issue.
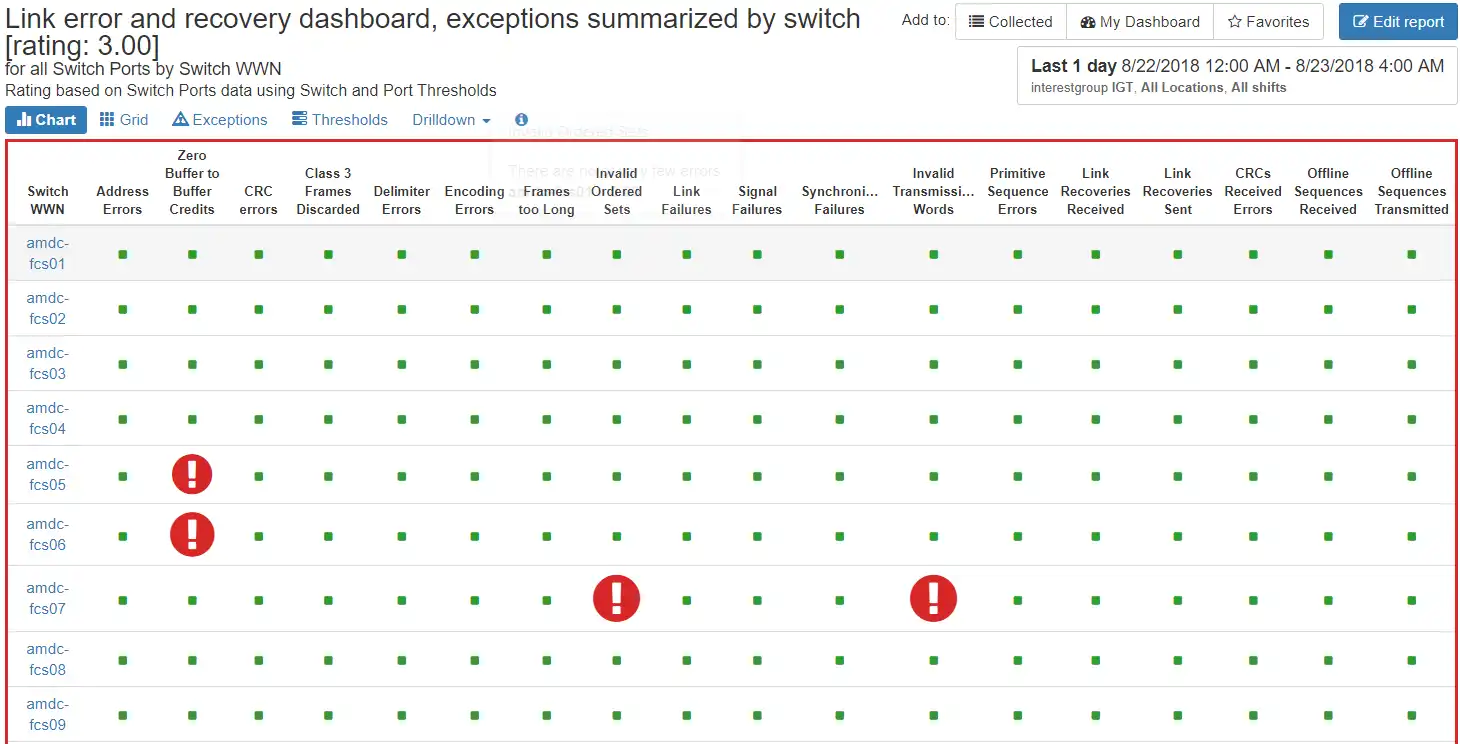
Figure 2: SAN Fabric Health
Best Practice #3: Daily Review of Host I/O Workload (Performance)
The best way to know your environment is to understand the workloads, and the best way to know the workloads is by reviewing what the hosts are running.
Figure 3: Heavy Hitting Hosts shows the busiest VMware hosts and physical hosts across the infrastructure. This is a great place to start understanding the workload attributes in the environment. If you examine this information regularly you will be able to easily spot when a workload is acting unusual.
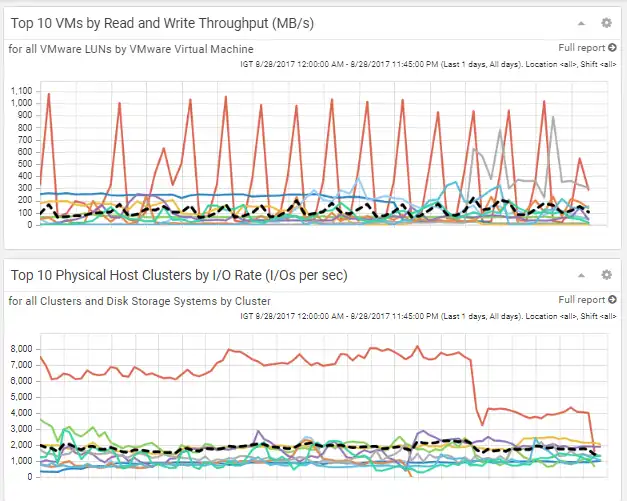
Figure 3: Heavy Hitting Hosts
Best Practice #4: Review Key Capacity Indicators (Capacity)
One of the challenges in capacity reporting is that every array type seems to have a different way of reporting the amount of space that is used and allocated. Sometimes it is just semantics, but other times it is significant to the architecture. In a large environment this can lead to difficult interpretation and normalization of the storage capacity.
IntelliMagic Vision for SAN provides a condensed and consolidated view of storage capacity health across all your storage arrays. It uses storage pool provisioned percentage, storage pool full percentage and free usable capacity as the key metrics and provides thresholds for each.
The storage pool provisioned percentage is the ratio of the amount of storage provisioned compared to the amount of usable storage. In a typical thinly provisioned environment, we will see ratios as high as 250% (2.5).
The storage pool full percentage shows the ratio between the amount of storage that has actually been written to on disk compared to the available usable storage. Most customers like to be alerted when the storage pool full percentage nears 90%.
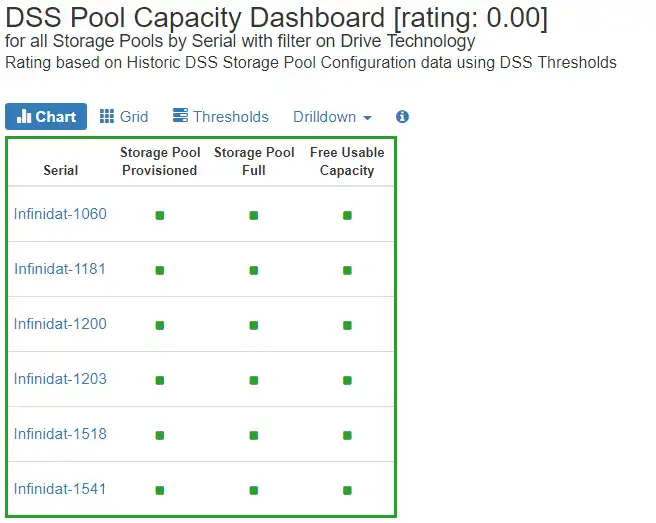
Figure 4: Storage Capacity Dashboard
Best Practice #5: Audit SAN Zoning Health (Configuration)
One of the most tedious aspects of SAN administration is managing the hundreds of zones and their associated members. In a large environment with thousands of physical hosts and a significant amount of change, the potential for errors or sub-optimal zoning configuration is significant.
Most of the errors we see represent ‘orphaned ports’ so named because they are included in a masking view on a storage array but have no associated zone that would support connectivity.
In the best case, these types of issues represent cleanup from de-commissioned servers, but in other cases we see sub-optimal and accidental limitations in connectivity. In rare cases, the mistakes made in this area result in single paths to the storage. Fortunately, IntelliMagic has reports that allow users to identify orphaned storage as well as hosts with single paths.
Figure 5: Orphaned SAN Ports represents a host named P715VIO1_2_PROJ_PURESCALE that has eight initiator ports and none of them are included in any of the zones on any of the switches.
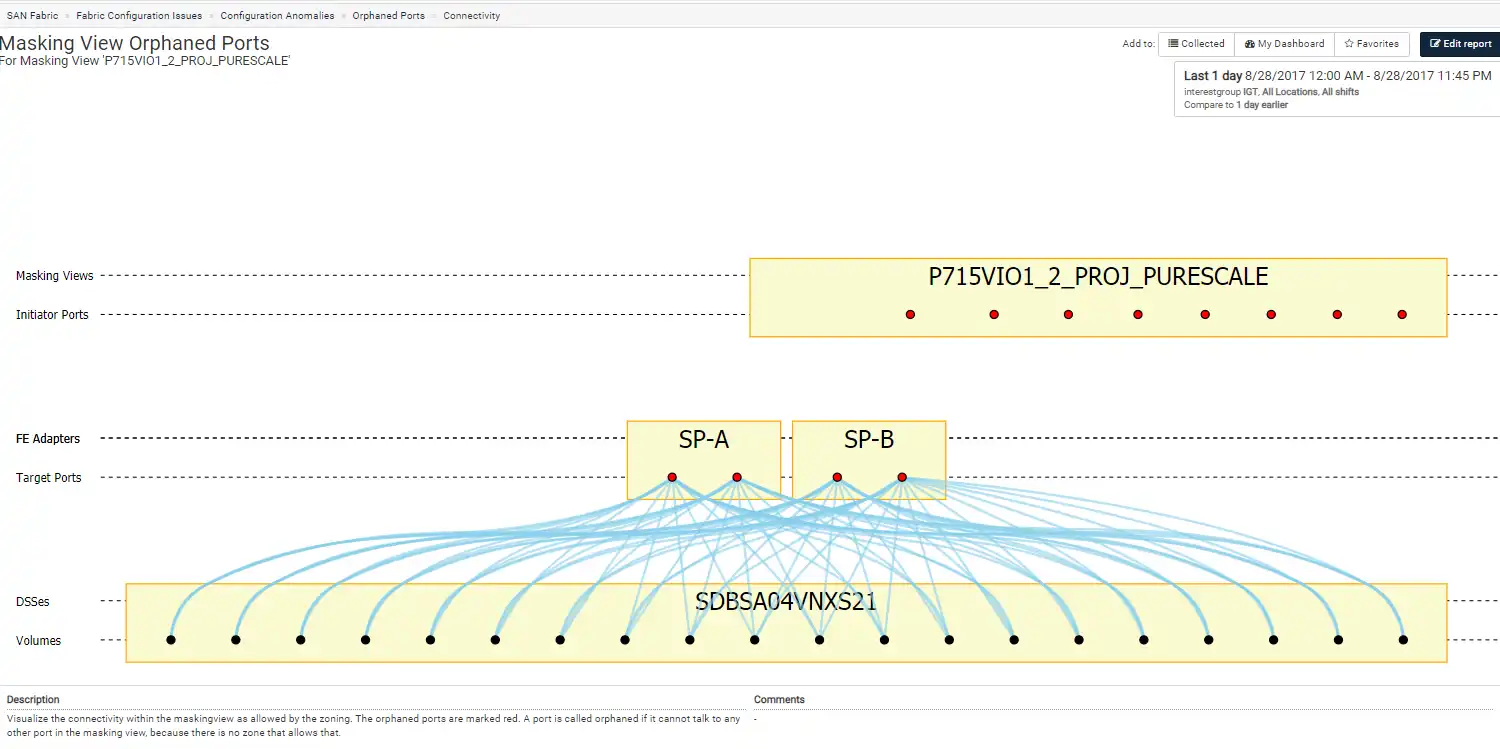
Figure 5: Orphaned SAN Ports
Proactive SAN Performance
The beauty of these reports is that they are automatically generated (all the time) which enables me to quickly and accurately assess the health of the environment. What this means is that in only a few minutes I can significantly reduce the number of unexpected surprises in my SAN infrastructure.
Sometimes, even when you do your best to keep an eye on an environment there are still some unexpected surprises. In the second part of this blog I’m going to walk through how to approach a couple of typical reactive scenarios.
This article's author
 Brett Allison
 Share this blog
Best Practices for Managing your SAN Performance Part 2: Reactive
Read part 2 of the blogRelated Resources
Finding Hidden Time Bombs in Your VMware Connectivity
Seeing real end-to-end risks from the VMware guest through the SAN fabric to the Storage LUN is difficult, leading to many SAN Connectivity issues.
Should There Be a Sub-Capacity Processor Model in Your Future? | IntelliMagic zAcademy
In this webinar, you'll learn about the shift towards processor cache efficiency and its impact on capacity planning, alongside success stories and insights from industry experts.
How to Detect and Resolve “State in Doubt” Errors
IntelliMagic Vision helps reduce the visibility gaps and improves availability by providing deep insights, practical drill downs and specialized domain knowledge for your SAN environment.
Request a Free Trial or Schedule a Demo Today
Discuss your technical or sales-related questions with our availability experts today