Building on the z16 support released recently, IntelliMagic Vision version 11.8.0 provides additional insights into processor cache metrics through the new “CPUs, Cache, Nest and RNI” report set in the Processor Hardware focal point.
The IBM z16 architecture is very different from the z14 and z15, but overall, the z16 will be about 12% faster than the z15 according to IBM. Understanding the performance characteristics of the z16 has become even more difficult, however. IntelliMagic Vision helps solve this problem by providing detailed insights into the behavior of the new processor architecture of the z16, as well as the older processor types.
An example of the new report set appears below. This new report set provides a lot of new information in the following tables and charts:
CEC LSPR Workload Summary Table. The workload categorization based on the activity from all LPARs in each CEC as if the RNI metric can be applied. It is only defined by IBM for LPARs
CP MSU Used CPs, L1 Cache Hit and RNI. This table shows the workload for the GCPs, the processor usage and the RNI as if there were only GCPs. This metric is not defined by IBM for just GCPs, but it predicts the MSU.
GCPs and zIIPs in use based on Processor Hardware Counters. This is an alternative for getting processor usage counters from RMF 70. In this case all activity is covered.
CPUs in use based on Processor Hardware Counters. Includes both GCPs and zIIP, just as for the L1 miss counter and the RNI. You can use this information to track possible changes after application changes or new z/OS software versions. The changes are not necessarily good or bad but must be understood.
Cycles per instruction, Cache Miss and TLB impact. This chart shows the number of cycles per instruction, the impact of cache misses and TLB together, and the number of cycles for the TLB misses separately. For CPUs (GCPs or zIIPs) the “Estimated Impact of Cache and TLB Misses” is the “Finite CPI”, which tends to be less than half the total cycles per instructions when most work runs on Vertical High processors. For an example of this report, refer to the figure below.
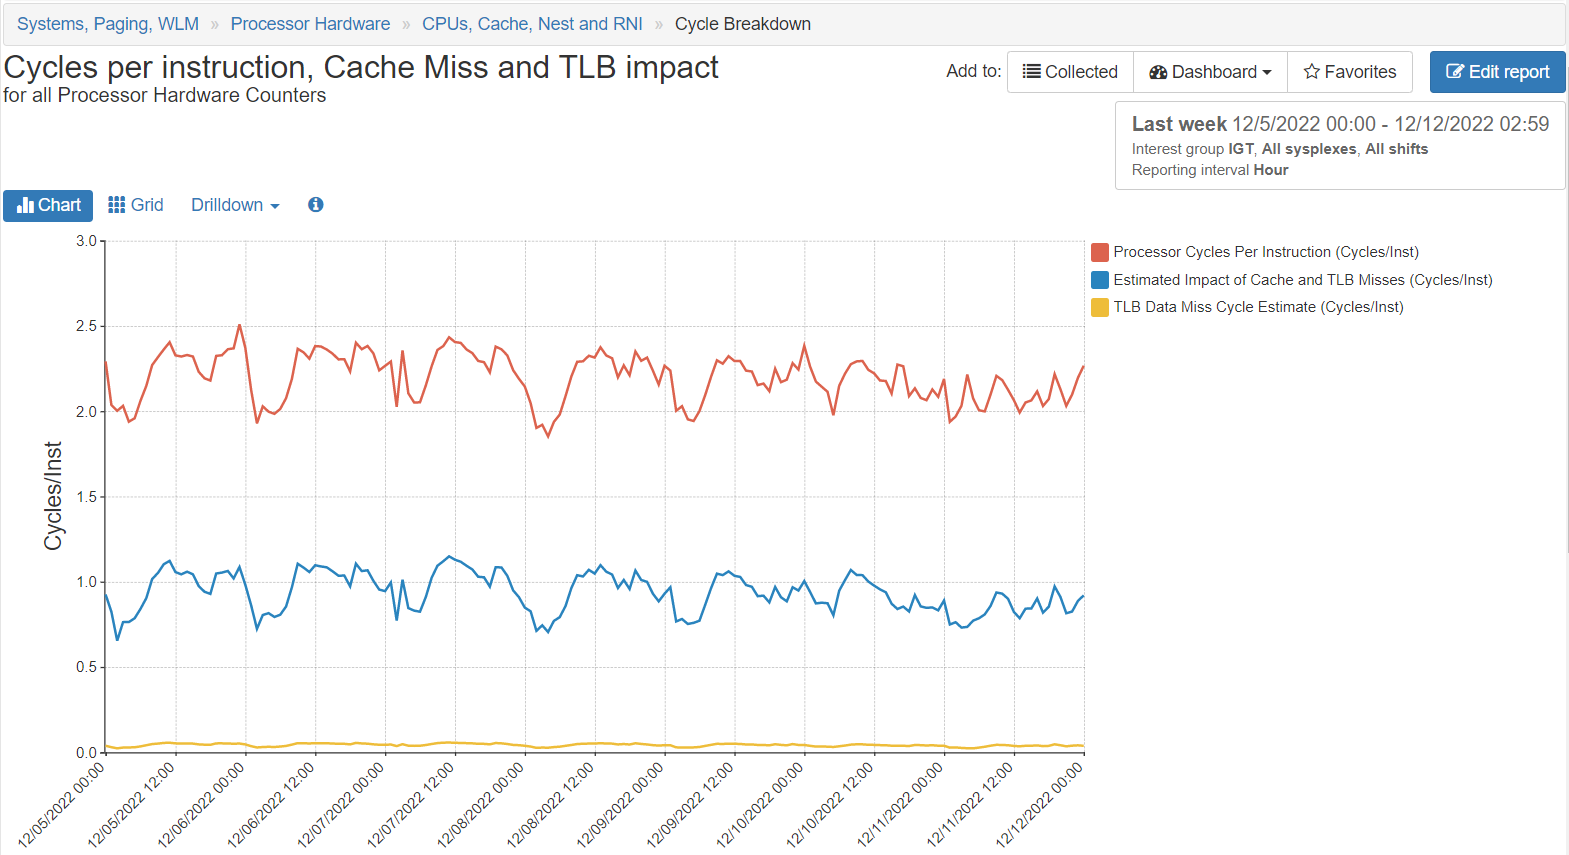
Note: this chart is also available for all Processor Hardware Counters summarized by Processor Complex Serial Number.
Level 1 Cache Misses. The number of Level 1 Cache Misses per second. It shows how many misses needed to be handled in Level 2 and the Nest (L3, L4, Memory). Most of those misses are handled by the L2 cache, which is dedicated to a core. In the z16, the physical L2 cache also contains the virtual L3 and L4 caches, allowing busy cores to steal some L3 cache slots from other cores on the chip. And conversely, inactive cores will see some L2 space used by VL3 and VL4 on the z16. Up to and including the z15 the L2 was truly dedicated.
Note: this chart is also available for all Processor Hardware Counters summarized by Processor Complex Serial Number, and per processor core. When GCP values are higher than the values for zIIPs, it means that demand on the caches (L2 and Nest) is greater for GCPs than for zIIPs. The z16 in particular will use cache slots from a less active CPU.
Nest Activity (L3, L4 & MEM. The Nest Activity (L3, L4 & Memory) per second. It shows how many misses needed to be handled in the Nest. In the z16, the physical L2 cache also contains the virtual L3 and L4 caches, allowing busy cores to steal some L2 cache slots from other cores on the chip for VL3, or from VL4s on other chips. And conversely, inactive cores will see some L2 space used by VL3 and VL4 on the z16.
Nest Activity (L3, L4 & MEM) by processor type. The Nest Activity (L3, L4 & Memory) per second. It shows how many misses needed to be handled in the Nest. In the z16, the physical L2 cache also contains the virtual L3 and L4 caches, allowing busy cores to steal some L2 cache slots from other cores on the chip for VL3, or from VL4s on other chips. And conversely, inactive cores will see some L2 space used by VL3 and VL4 on the z16.
Nest Activity (L3, L4 & MEM) per processor core by processor type. The Nest Activity (L3, L4 & MEM) per GCPs and zIIPs per second. When CP values are higher than for zIIPs, it means that demand on the caches (Nest) is greater than for zIIPs. The z16 in particular will use cache slots from a less active CPU.
RNI components. The RNI is defined for GCPs and zIIPs together per LPAR. It is the normalized performance for L3 and L4 cache and memory. The breakdown this chart shows is simply a breakdown of the IBM formula and your counters. You can possibly see changes when you migrate to a different architecture.
Relative Nest Intensity by processor type. The RNI is only defined by IBM for the total workloads for GCPs and zIIPs. This chart shows the RNI computation applied to GCPs and zIIPs individually as a larger RNI value for the CPs predicts a higher MSU cost. A higher RNI is likely to correlate to a higher Finite CPI (i.e., more waiting cycles). While you cannot change the workload, you can optimize the Vertical High/Medium/Low settings. Depending on your agreement with IBM and the need to optimize, you are likely to benefit from Vertical CP configurations optimized for differing workload characteristics across shifts.
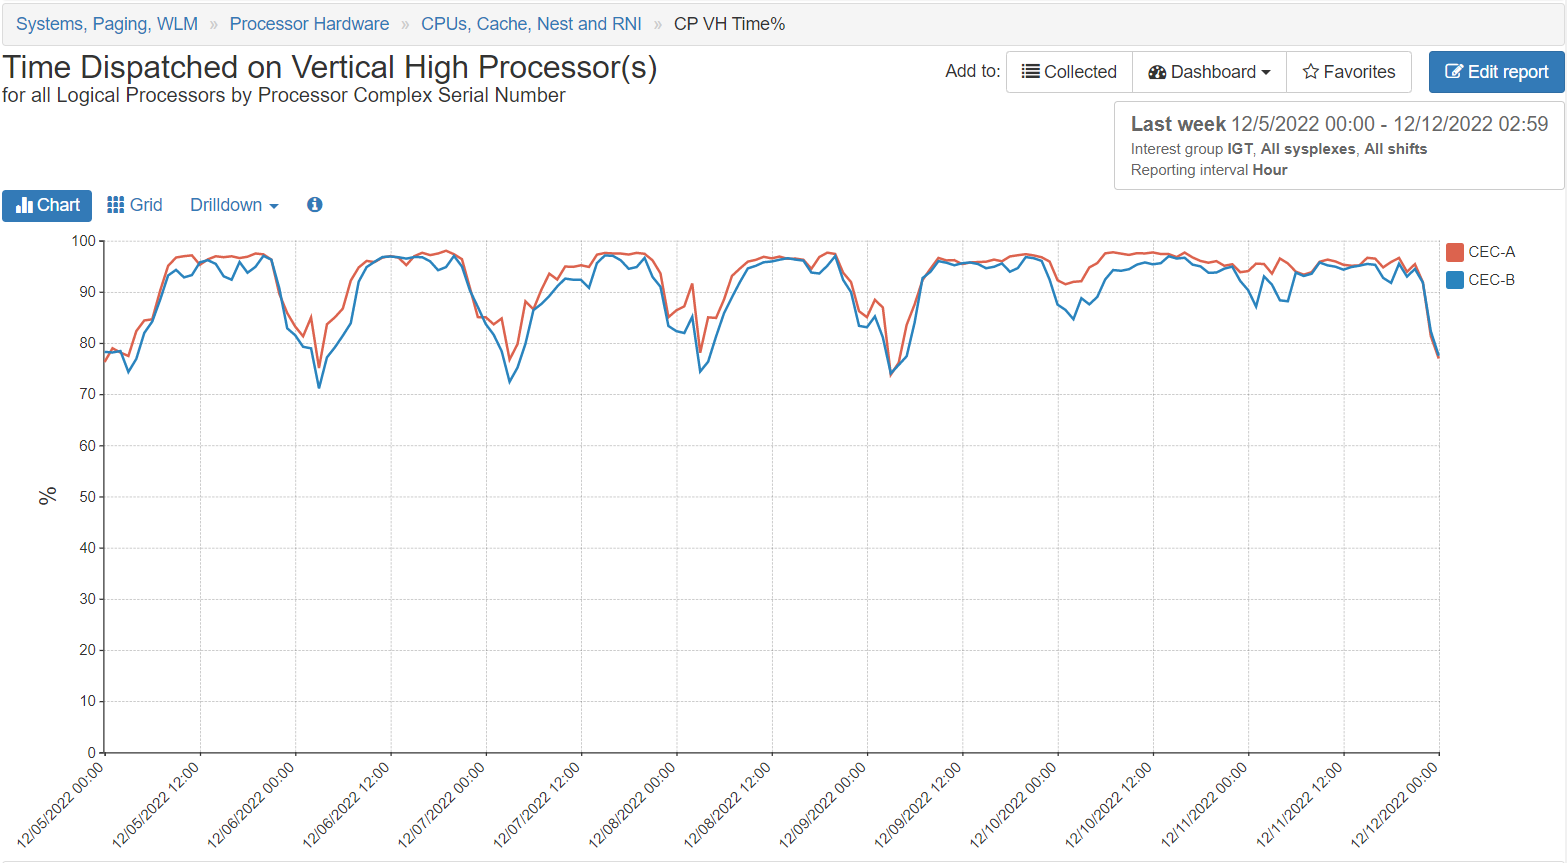
Time Dispatched on Vertical High Processor(s). The percentage of the time dispatched on Vertical High processors. Vertical High means that the logical processor for the LPAR is dedicated to a physical processor, and hence have no competition for its L1 and L2 caches from other LPARs.
Dispatched CP MIPS by LPAR by Polarity. This report includes CPs only. It is based on information from RMF 70 records on processor polarization. The report will only be valid when all processors are managed with HiperDispatch (have a polarization). For best performance, you want to maximize the MIPS running on vertical high processors, especially during peak hours. Note that you can change the LPAR weights by shift to make this happen when the LPAR workload is very different for each shift.
Summarizing, IntelliMagic Vision version 11.8.0 provides a lot of additional insights into processor cache metrics in the new “CPUs, Cache, Nest and RNI” report set.
You Might Also Be Interested In:
Why Am I Still Seeing zIIP Eligible Work?
zIIP-eligible CPU consumption that overflows onto general purpose CPs (GCPs) – known as “zIIP crossover” - is a key focal point for software cost savings. However, despite your meticulous efforts, it is possible that zIIP crossover work is still consuming GCP cycles unnecessarily.
Making Sense of the Many I/O Count Fields in SMF | Cheryl Watson's Tuning Letter
In this reprint from Cheryl Watson’s Tuning Letter, Todd Havekost addresses a question about the different fields in SMF records having different values.
What's New with IntelliMagic Vision for z/OS? 2024.2
February 26, 2024 | This month we've introduced changes to the presentation of Db2, CICS, and MQ variables from rates to counts, updates to Key Processor Configuration, and the inclusion of new report sets for CICS Transaction Event Counts.