
This blog was originally published on March 20, 2017.
At some point or another, we have probably all experienced noisy neighbors, either at home, at work, or at school. There are just some people who don’t seem to understand the negative effect their loudness has on everyone around them.
Similarly, our server and storage environments also have these “noisy neighbors” whose presence or actions may disrupt the performance of the rest of the storage environment. In this case, we’re going to take a look at VMware datastore, where just one bad VM could potentially impact the performance of other VMs in the same environment.
VMware storage architecture
Before going any further, it is important to understand the nature of the underlying architecture and how things can be shared and connected within a VMware environment. The easiest way to accomplish this is to show you the layers leveraging IntelliMagic Vision dynamic topology views. In this scenario, let’s pretend a user calls the help desk and complains about the performance of their precious VM named “cltry1aliv0032”. This VM lives an ESX cluster containing several hosts, and is currently residing on ESX host named bs-riscvmesx663 as shown below.
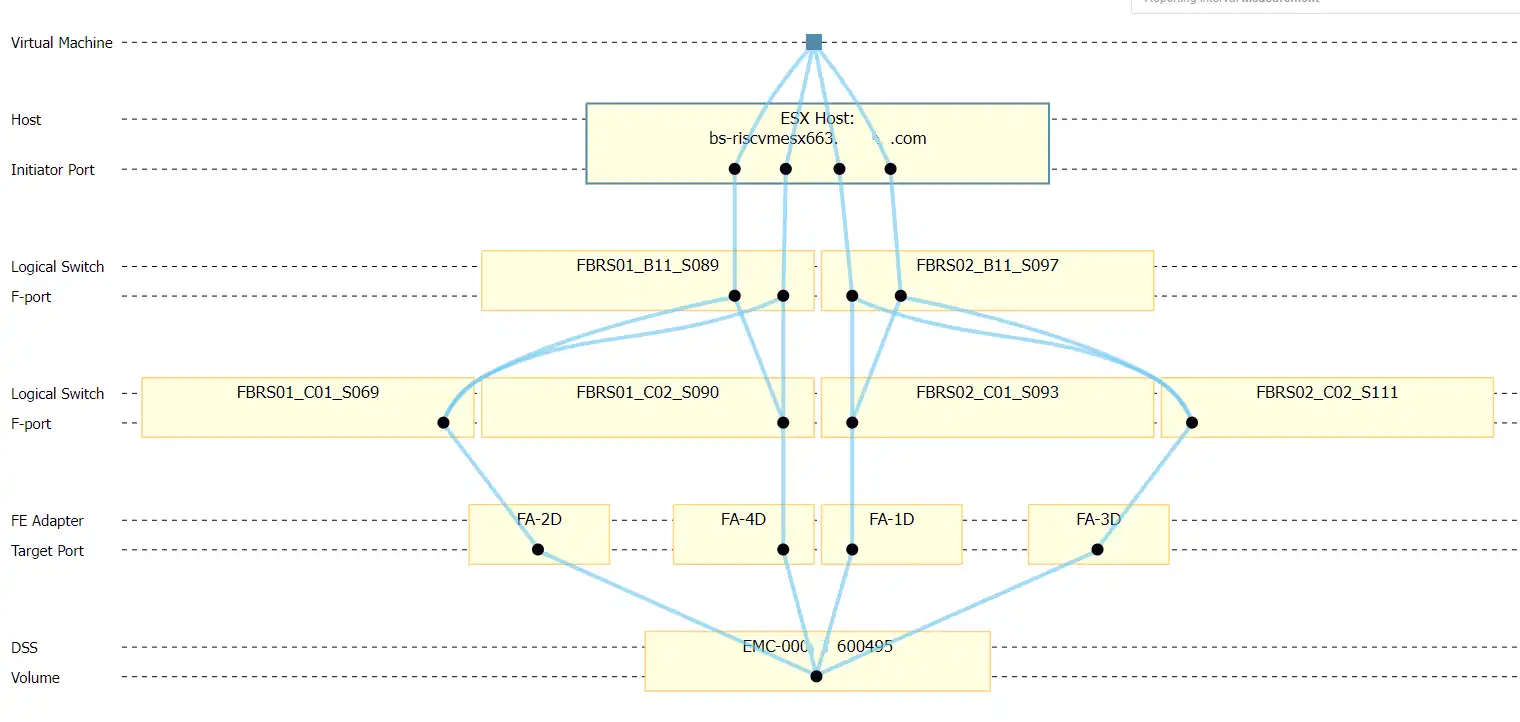
The VM in question shares a number of things with other VMs. In this case, the VM shares the following:
- ESX host resources: CPU, Memory, Datastore
- The Datastore is connected to a SAN LUN which means the host also shares Host initiator ports, switch ports (8 Gb) and storage ports (16 Gb)
- The LUN also resides on a storage controller that has shared resources such as CPU, Memory and back-end drives
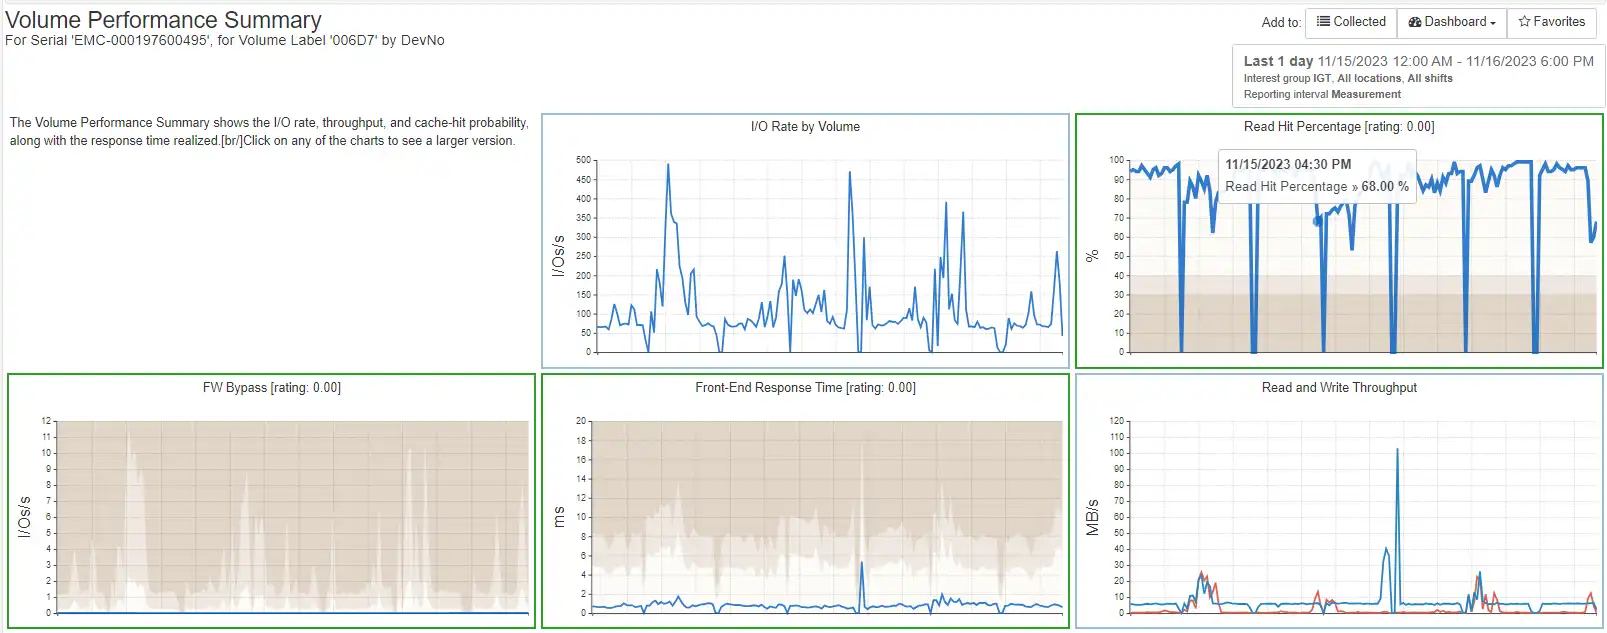
Let’s take a closer look at the shared resources starting with the datastore from the perspective of VMware. Which other VMs are also sharing the datastore? The following chart shows the Total Operations for all VMs on the datastore used by the host.
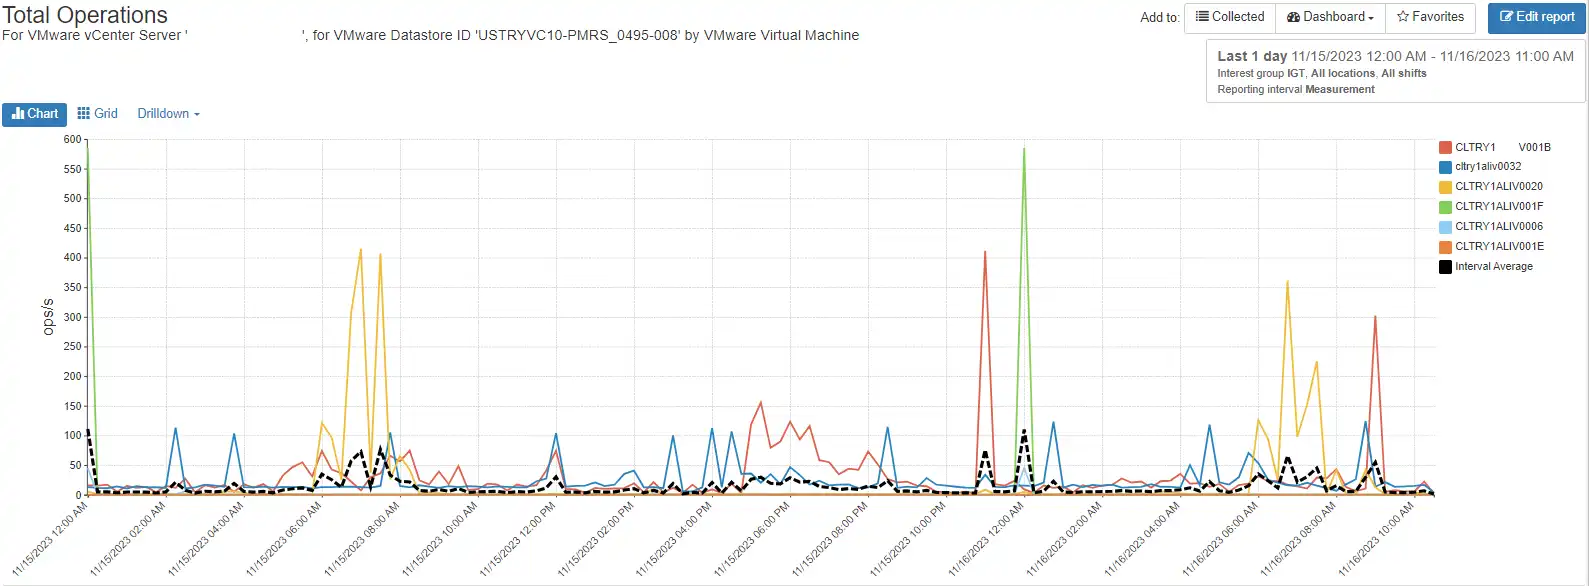
The user that the customer is complaining about is called cltry1aliv0032 which is represented by the blue line. There are other VMs that are driving much higher I/Os to the same device.
We can also inspect the ports on the switch connected to the host initiator ports of the ESX host to see if there are any issues with the port. The following chart shows the port activity for all of the ESX host initiators:
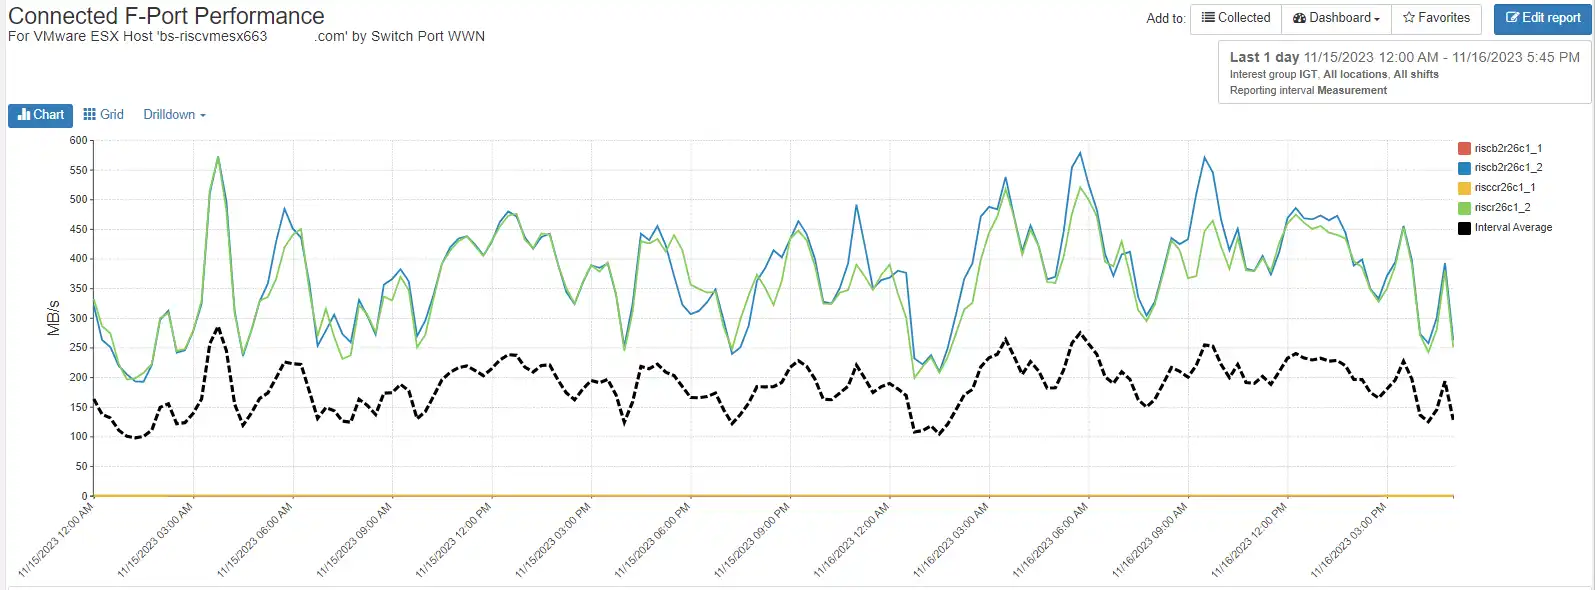
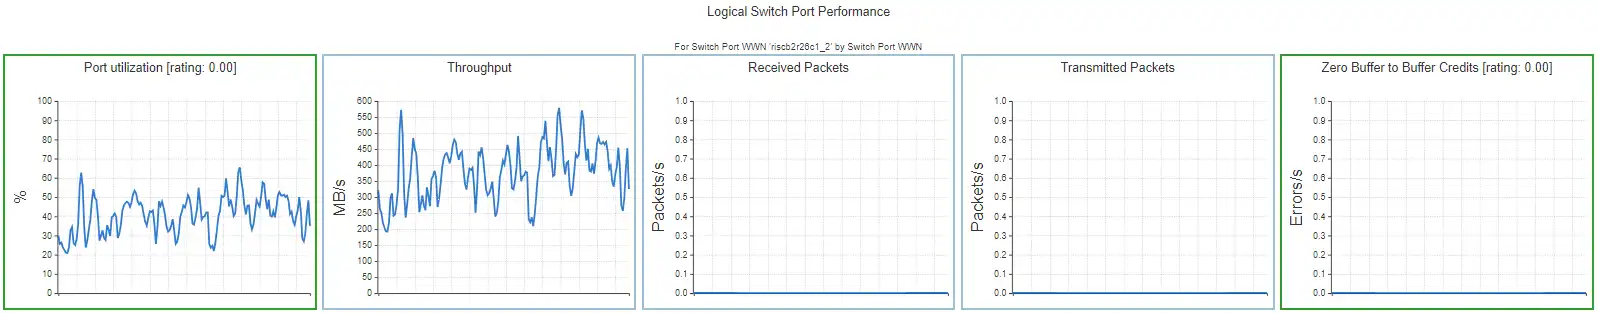
In this case, which is typical for SAN fabric, only two of the four ports are active. They are quite busy running about 50% busy during the entire period and experiencing some buffer credit issues as seen in the chart below:
This port and the other active port (two were active and two were inactive) are shared by other VMs and other datastores within the ESX host so even if one datastore is not stressing the fabric the combined effect of multiple active datastores could stress the fabric.
The backend storage volume associated with the datastore is also shared and we can see the performance here:
Fortunately, the performance on the back-end storage volume is excellent and the storage system is handling the load well. If it was the case that the VM was experiencing poor performance IntelliMagic Vision would be able to quickly identify which shared is constrained.
For more information on how IntelliMagic Vision can reduce risk and improve performance in your storage environment, please visit IntelliMagic Vision for SAN, or request a personalized demo.
Storage Performance Analysis for IBM SAN Volume Controller (Spectrum Virtualize)
This white paper discusses the end-to-end I/O path, SVC architecture, SVC key measurements, and then provides guidance in diagnosing and resolving performance issues.
This article's author
 Brett Allison
 Share this blog
Related Resources
Improve Collaboration and Reporting with a Single View for Multi-Vendor Storage Performance
Learn how utilizing a single pane of glass for multi-vendor storage reporting and analysis improves not only the effectiveness of your reporting, but also the collaboration amongst team members and departments.
A Single View for Managing Multi-Vendor SAN Infrastructure
Managing a SAN environment with a mix of storage vendors is always challenging because you have to rely on multiple tools to keep storage devices and systems functioning like they should.
Components of an Effective Storage Infrastructure Health Assessment
Learn how you can proactively identify and correct dangerous configuration, capacity, and performance issues in your Open Systems environment.
Request a Free Trial or Schedule a Demo Today
Discuss your technical or sales-related questions with our availability experts today