
Every storage engineer is familiar with the situation. It’s one of your company’s peak periods, and it is critical that your production applications run smoothly. You get a phone call or an email stating that there is a critical virtual machine or datastore that is performing poorly, and that poor storage performance is the cause. There is often no more information than that. How do you either:
- ascertain the root cause, or
- show with a certainty that your storage infrastructure isn’t the problem?
When you consider the huge number of data points that can be given by VMware, your fibre channel switches, and your storage arrays, how do you quickly and easily discern the cause of the issue? This blog will provide an overview that can help separate the signal from the noise.
VMware Overview
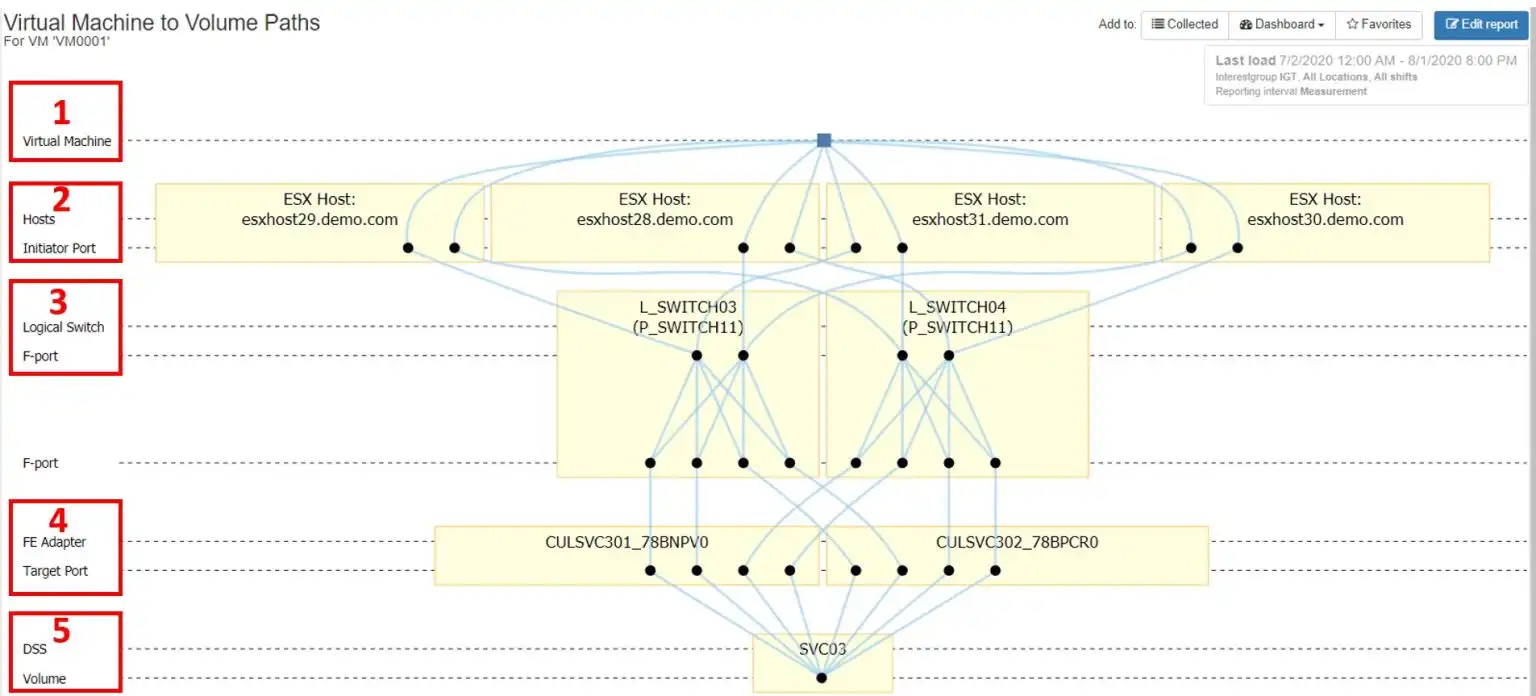
Figure 1 – IntelliMagic Vision Topology Chart
Figure 1 is a topology chart from IntelliMagic Vision that shows the end-to-end connectivity for a simple ESX configuration: One virtual machine on one ESX cluster consisting of four hosts. Each host in the cluster is connected via two independent fibre channel switch fabrics to an IBM SVC, which is presenting volumes to the ESX hosts. For the remainder of this blog, we will discuss the key performance metrics for each layer as it pertains to VMware performance metrics.
1 – Virtual Machine
The virtual machine (VM) is a logical construct that uses the physical resources of a particular VMware host, including RAM, CPU, network adapter, host bus adapter (HBA) and disk. The disk and HBA resources are of chief concern when evaluating storage performance. Since these are shared resources, they will be discussed more in the VMware Host section of this blog.
When troubleshooting VM storage performance, it’s important to gather the following information:
Current VMware Host
Since a VM only resides on one host, any performance issues will be restricted to that host, and not to other hosts in the cluster.
There are multiple ways to determine the current host. One typically logs onto the vSphere client or CLI to gather this information. Figure 2 below shows how IntelliMagic Vision represents this information. If the host is constrained at either the datastore or HBA, this will affect the performance of all VMs that reside on the host.
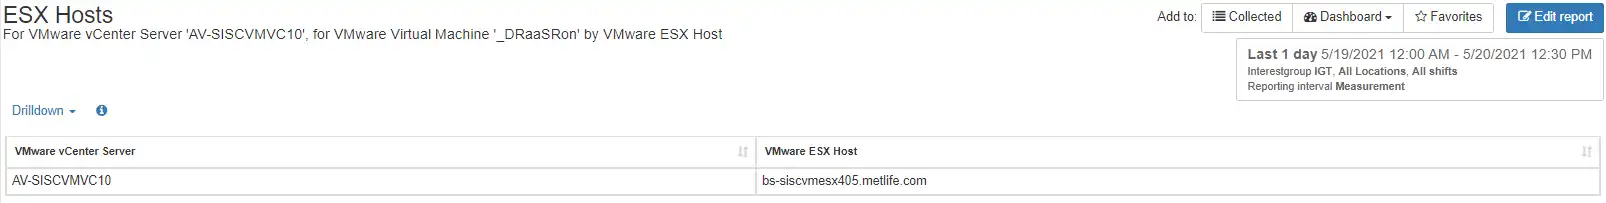
Figure 2 – Current ESX Host
Datastores Used
A VM can utilize space from one or more datastores. A VMware host typically has multiple datastores, so isolating which datastores a particular VM is using allows you to determine the storage array and volume the datastore is using. This can offer valuable insights as to the tier and performance level one should expect for the VM.
Figure 3 shows the relationship between a virtual machine, datastore, storage array, and volume.
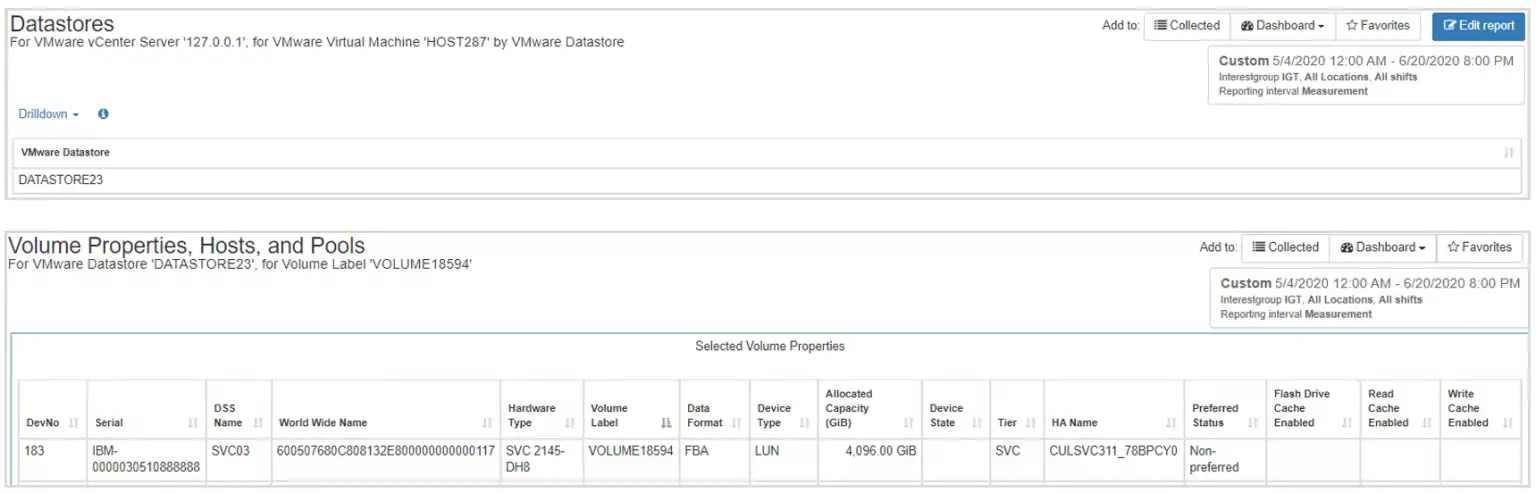
Figure 3 – Datastore, Volume, Host, and Storage Pool Properties
The key metrics to consider for datastore performance at the VM level is input/output operations per second (IOPS) and throughput.
IOPS (Input/Output Operations Per Second)
IOPS is a measure of the number of input/output requests a device processes per second. Total, read, and write IOPS should be considered.
IOPS are an indication of how much workload is being sent to the storage array. Most storage arrays acknowledge a write operation as soon as it’s written into cache and mirrored to another controller. The array will attempt to service a read operation from cache, but if there is no cache hit, the read operation will have to come from back-end media, which isn’t as fast as cache.
Throughput
Throughput is a measure of the amount of data that is being placed onto the SAN fabric by a particular VM and can be considered a measurement of how much workload is being placed on the host HBA and the SAN fabric.
The throughput and IOPS presented by an individual VM are a subset of total VMware host workload, as there are typically multiple VMs on a host.
Figure 4 shows a group of mini-charts that show the storage workload that multiple VMs present to a datastore. Charts such as this make it easy to see if there are VMs that are “noisy neighbors” on the datastore, consuming most of the resources.
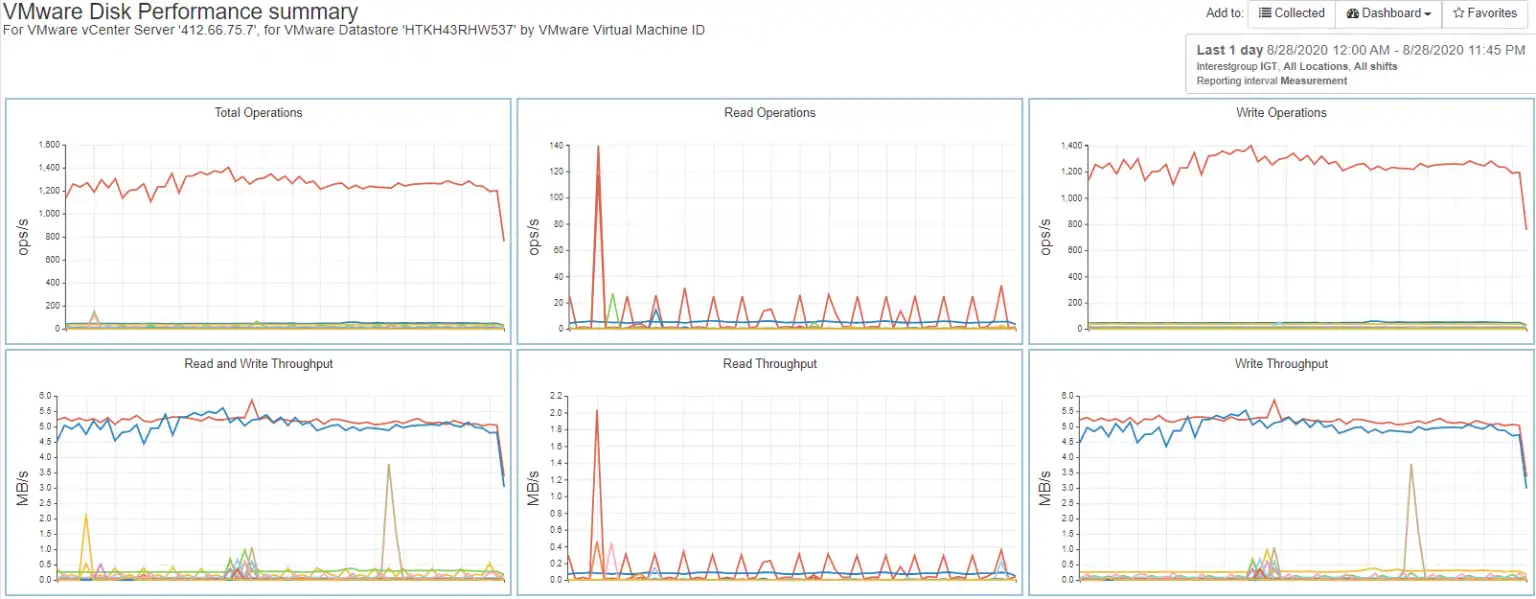
Figure 4 – Virtual Machine Workload on Datastore
2 – VMware Host
The VMware host provides physical resources to the VMs that reside on it. If a host has constraints on any of the resources it provides to those VMs, their performance will suffer. From a storage standpoint, the key resources to consider are the HBA, the HBA ports, and disk resources.
HBA and HBA ports
The HBAs for a host are the conduit through which the hosts provide the disk resources shared by the virtual machines. HBA ports are referred to as initiators and connect to the SAN fabric as F_ports. The host typically has an even number of initiators with half on each of two redundant SAN fabrics. If the multi-pathing (MPIO) implemented on a host is functioning properly, the throughput for all ports associated with the host should be roughly balanced on each fabric and across fabrics.
Figure 5 shows the throughput for a host with 4 initiators that are well-balanced, indicating properly functioning MPIO.
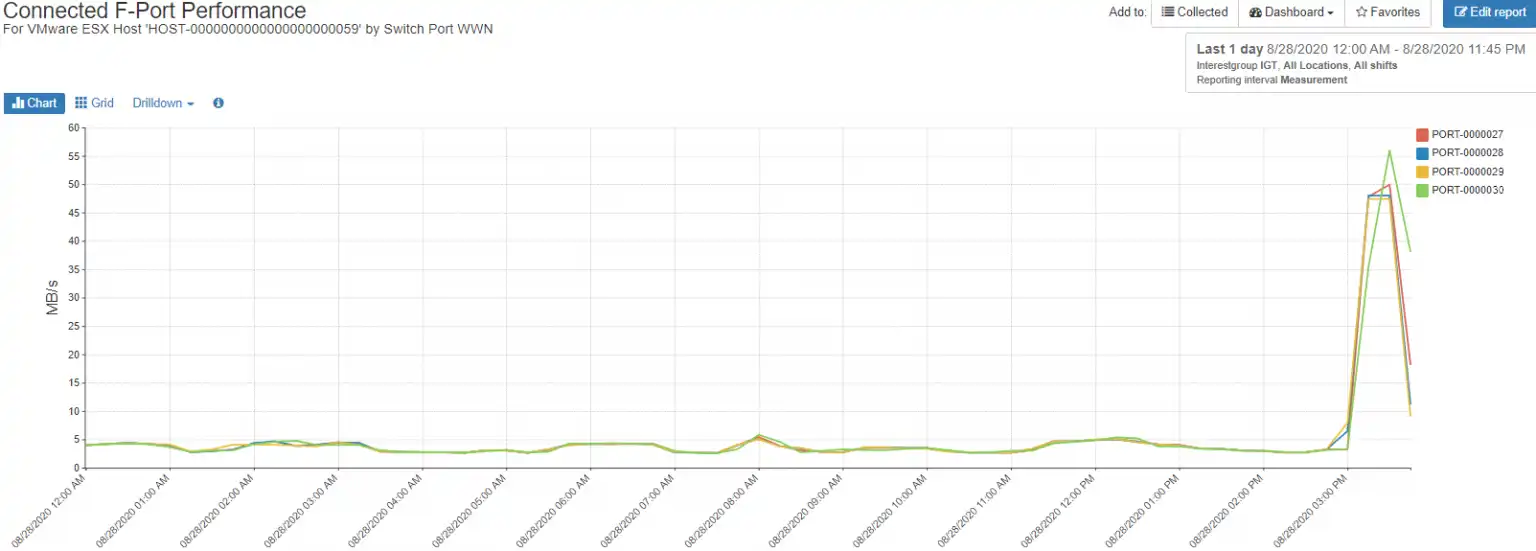
Figure 5 – Balanced Host Initiators
Poorly functioning MPIO can result in an imbalance of the workload on an initiator as shown in figure 6, where each of the four initiators shows a markedly different workload.
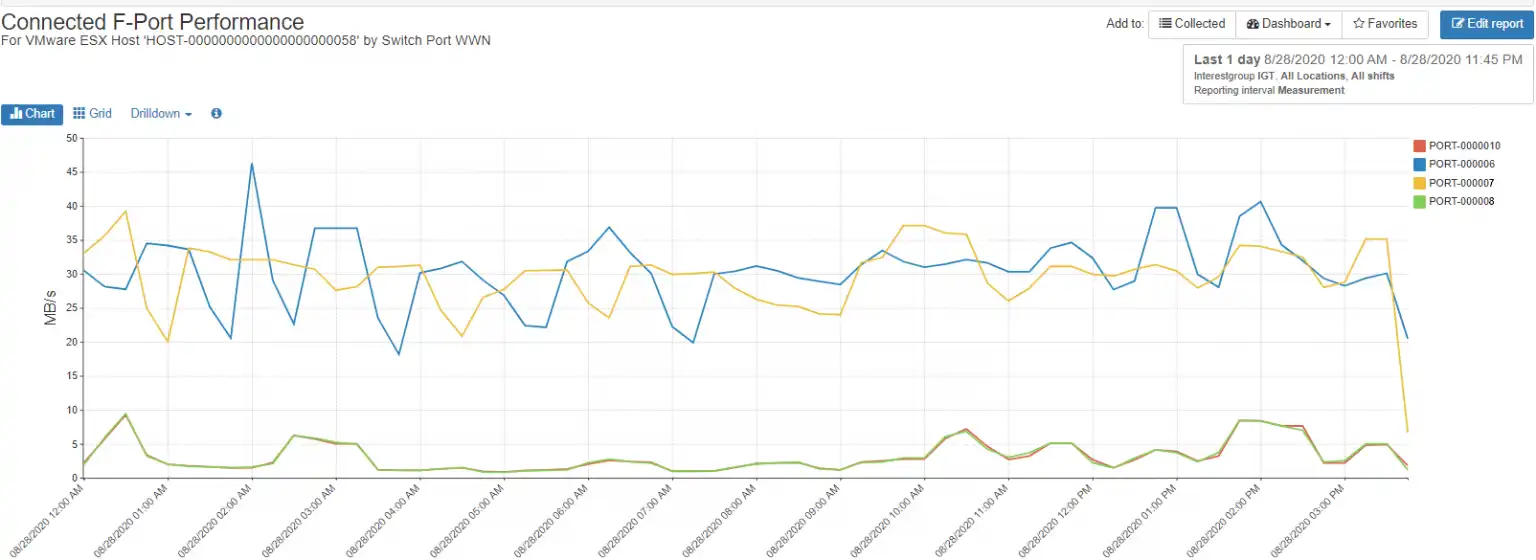
Figure 6 – Imbalanced Host Initiators
Although this particular host doesn’t have overutilized initiators, it demonstrates that if the workload on the host increases drastically by creating or moving more VMs to it, that ports PORT-000006 (blue line) and PORT-000007 (yellow line) will become saturated before PORT-000008 and PORT-000010 (green and red lines).
Disk Resources
VMware hosts create a datastore on a storage volume. Since the datastore and the volume on which it is created are shared amongst the VMs that access it, the workload placed on the volume is the aggregation of the workload of all virtual machines leveraging the datastore. As we saw earlier with VMs, IOPS and throughput should be considered. At the host level we have additional metrics read hit percentage and front-end response time.
Read hit percentage for a volume containing a datastore is a measure of how efficiently the storage array providing the volume is serving data from its read cache. Storage arrays use a variety of algorithms to attempt to place the data most likely to be accessed, “hot data”, into cache, which is much faster than the media on which the data resides. A poor read hit percentage indicates that the working data set is too large to be held in cache or that the data being requested is so random that it defeats the caching algorithms.
Figure 7 illustrates the inverse relationship between read hits and response time.
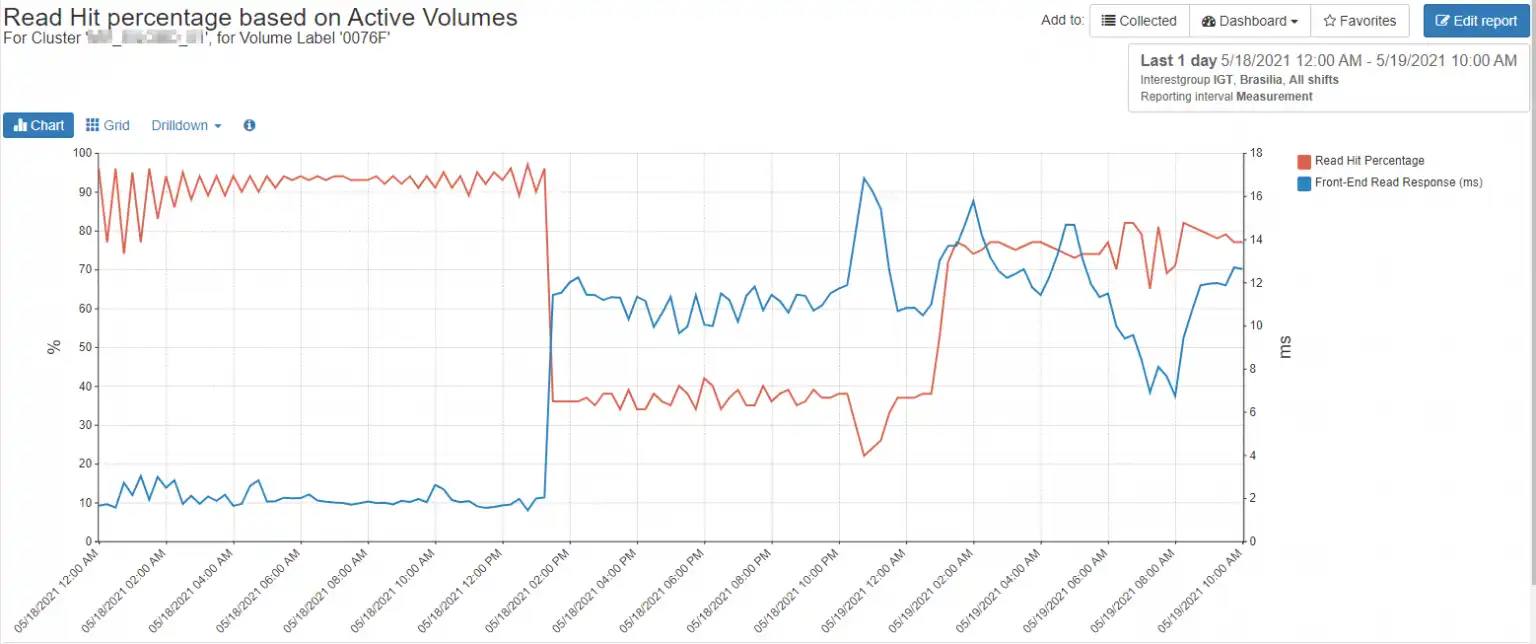
Figure 7 – Read Hit vs. Response time on Active Volumes
The other metric to be considered for host datastores is response time.
Response Time (Read and Write)
Read response time is the amount of time from when the data is requested and when the data is received by the host.
Write response time is the time between when a write I/O is generated by the host and acknowledgement is received from the storage array.
There are many factors that can affect response time, such as overutilized ports (host HBA, switch, and array front-end), or overutilized storage array media.
3 – Logical Switches and Ports
At a high level, the considerations for VMware host connectivity are port utilization, port configuration, path configuration, and port errors.
Port Utilization
The utilization of each fibre channel port from the host HBA to the array front-end port should be considered. A saturated port at any point in the path will affect performance. Fibre channel ports typically start degrading in performance after ~70% utilization. Additionally, saturated ISL ports can affect not only the host in question, but all other hosts that traverse the ISL to connect to their storage.
Port Configuration
If a host HBA port is capable of 32Gb/s but is connected to a port that is either configured for or negotiates a speed less than that rate, performance will suffer.
Path Configuration
A host typically has an even number of ports with half on one redundant switch fabric. Care should be taken to ensure that the hop count between the VMware host HBA and the array front-end ports is minimal, preferably 2 hops or less as each hop introduces latency to the solution.
Additionally, if there is a mismatch in port speed between the host HBA ports and the array front-end ports, or any hop along the way, you run the risk of introducing a slow-drain device to your fabric, which can affect the performance of every host on the fabric.
Zoning misconfigurations can result in imbalanced throughput for the host. Figure 8 shows a host with three configured HBA ports, two in one switch fabric and one port in the other. The path highlighted with the red rectangle is the fabric with the single path.
This configuration represents a risk for this VMware host on multiple fronts. The I/O for this host is distributed unevenly across fabrics, which can cause unpredictable performance. The other risk is if SWBSA22CDCX16 should fail, the entire workload for the ESX host will be going through a single HBA port on the VMware server, likely resulting in a saturated HBA port.
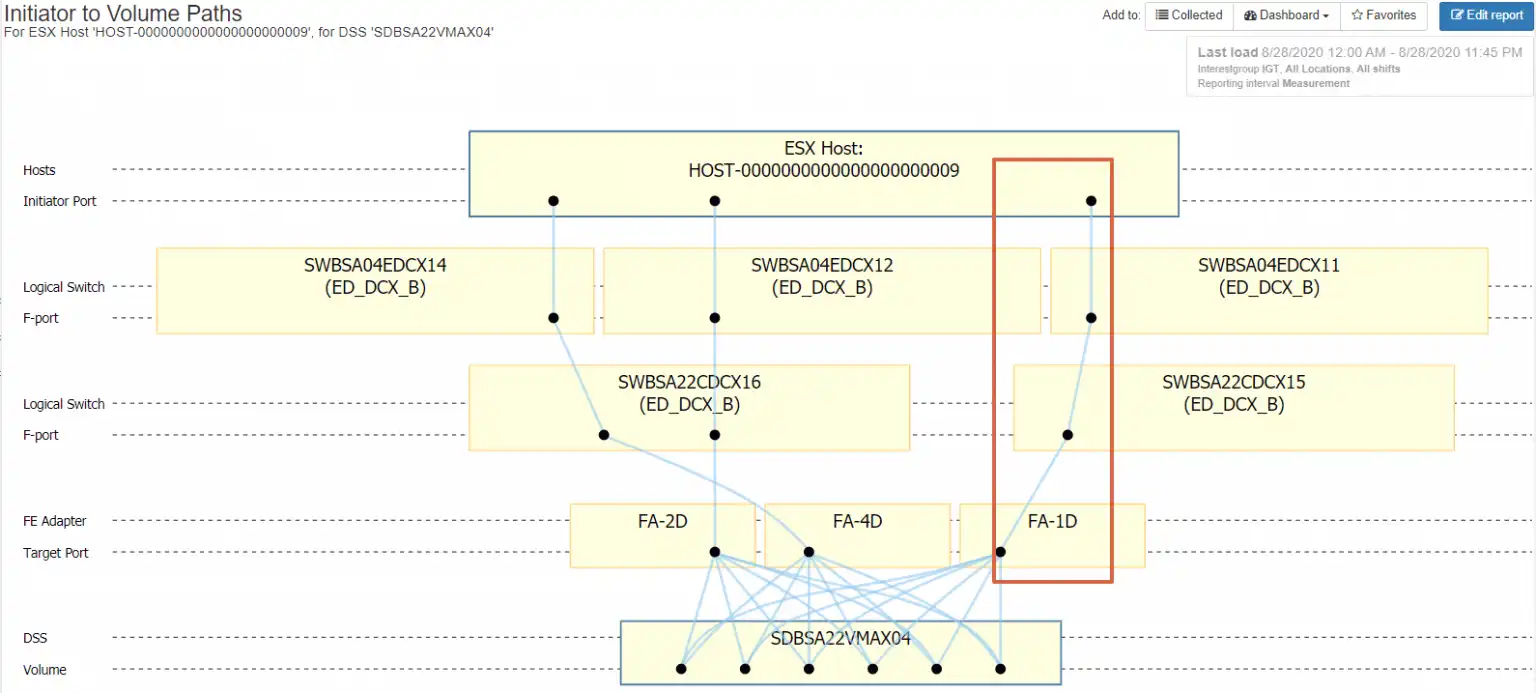
Figure 8 – Improper Path Configuration
Port Errors
Port errors should be monitored closely as they can rob your solution of performance and potentially affect the entire SAN fabric. Symptoms such as CRC errors, class 3 discards, or excessive zero buffer credit conditions can cause a host to have to retransmit data, which consume bandwidth and can potentially affect every device on the fabric.
You should consider SAN fabric connectivity any time a new VMware host is introduced to the SAN fabric.
4 – Array Front-end Ports
Host connectivity to the array front-end ports, also referred to as target ports, should be done in accordance with array manufacturer best practices, as they vary across vendors.
Just as with the previously discussed initiator ports, there should be an even number of target ports, with half on one fabric and half on the other. An uneven number of target ports can affect performance as it will result in imbalanced I/O between the host and the storage array.
Target port imbalance can also result in degraded performance in the event of a storage array port, HBA, or controller failure. The utilization of the target ports should be taken into consideration.
5 – Array Volumes
Finally, the volume on which the datastore can drastically affect performance. If you are expecting flash media speed but the datastore is created on a volume that is on nearline media, you will have disappointing results. Create the datastore’s volume on a tier that is appropriate with the SLA you’re expecting for the VMs consuming that data.
An End-to-End Picture
A proper evaluation of VMware performance means looking not only at how the hosts, VMs and datastores are performing, but also external factors like SAN fabric and storage system performance. Attaining the end-to-end picture can be a daunting task, often requiring multiple interfaces. Once the data has been gathered, it must be correlated and interpreted.
IntelliMagic Vision provides the cross-stack visibility necessary to have the entire picture for managing VMware storage management.
Built-in, automated insights leverage a domain specific AIOps approach that allows you to prevent performance issues in your VMware environment, allowing you to quickly find answers to questions such as:
- What are my most active ESX hosts and virtual machines?
- On which storage system, volumes, and storage tier is my VM currently residing?
- Are external factors contributing to my current performance issues?
- How evenly is my workload distributed across my ESX hosts?
- Where are the configuration risks in my environment?
IntelliMagic Vision provides a comprehensive end-to-end view of your storage performance, capacity, and configuration in a single pane of glass, giving you the visibility you need the next time your phone rings with a VMware performance issue.
Start a free trial today or contact us to see for yourself.
This article's author
 Tim Chilton
 Share this blog
Related Resources
Improve Collaboration and Reporting with a Single View for Multi-Vendor Storage Performance
Learn how utilizing a single pane of glass for multi-vendor storage reporting and analysis improves not only the effectiveness of your reporting, but also the collaboration amongst team members and departments.
A Single View for Managing Multi-Vendor SAN Infrastructure
Managing a SAN environment with a mix of storage vendors is always challenging because you have to rely on multiple tools to keep storage devices and systems functioning like they should.
Troubleshooting Physical and Virtual Host Issues After a Storage Outage
Whether the downtime is scheduled or not it is very important to understand which hosts are affected by an outage or partial outage in your VMWare ESX host, SAN fabric or Storage array.
Request a Free Trial or Schedule a Demo Today
Discuss your technical or sales-related questions with our availability experts today