 Joe Hyde -
Have you ever been stuck waiting with no real explanation as to why? Here’s an RMF pend time haiku that tells the “what” but not the “why” of pend time delay:
What, pend time delay?
CMR, device, other
Why so much wait time…
The I/O infrastructure for IBM z Systems is second to none in the enterprise space, including the detailed metrics delineating where time is spent in I/O processing. One such metric is pending time (pend), which has three components:
- Command Response (CMR) Delay
- Device Busy Delay
- “Other” – derived by subtracting the first two from the total pending time
I have recently posted a blog on device busy delay, Eliminating Data Set Contention. In this one, I’ll explain CMR delay and what can cause it to increase.
For FICON command-mode I/O (FICON, for short) the channel measures the time from when the first command of the I/O is sent from the channel to when a command response frame is received from the disk storage system. The response acknowledges that the first command has been received and its initial status. For FICON transport-mode I/Os (zHPF, for short) the protocol has been streamlined and a direct measurement is no longer possible; instead, CMR delay is calculated as the difference in the time the channel has measured since first sending the transport command and the sum of connect and deferred time measured by the disk storage system for the I/O.
CMR delay is a very useful metric in determining the health of your storage interconnection. The infrastructure includes the FICON channel, FICON directors (if any), cables between server and storage and the host adapters embedded in the disk storage system. You can derive the baseline delay for an I/O during a low to modest I/O time period. The main factors for the baseline are hardware generation (channel, director, disk storage) and cable length. Increases from this baseline delay come from contention. A likely source can be an overloaded host adapter in the disk storage system (fan-in issues).
Let’s look at some data on command response times from a couple of IntelliMagic customers. The first one has EC12 z Systems mainframes attached to a DS8870 with 8Gbit connectivity but without FICON directors. This is my preferred configuration because the DS8870 has many ports, and channels on a mainframe are typically less costly than large FICON director switches. In addition, not having FICON directors gives less complexity within the storage infrastructure.
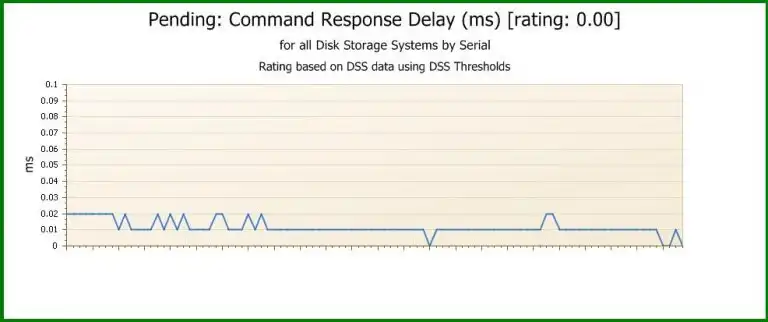
The chart above covers a 24-hour period. Note that the baseline CMR time is quite low – between 10 and 20 microseconds per I/O.
A more complex storage interconnect – using FICON directors but with the same mainframe, storage type and channel speed – has the following command response times over a 24-hour period. This time, however, the chart shows CMR time for the DS8870 split out by logical subsystem (SSID).
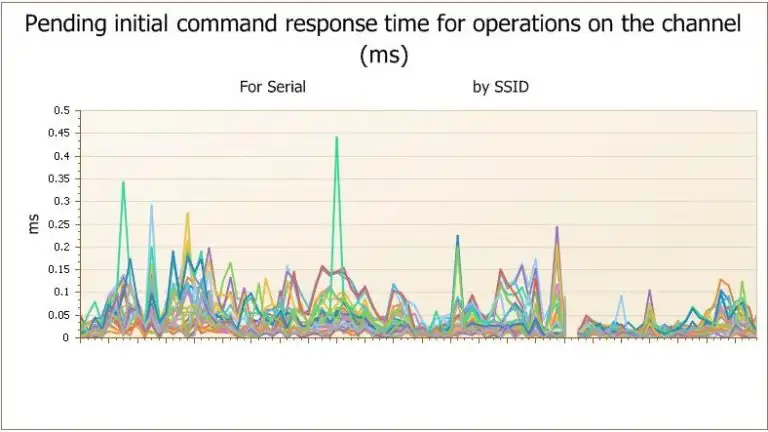
Although the baseline CMR time is still quite low, below 50 microseconds, there are times when it is above 200 microseconds (displayed as 0.2 milliseconds in the chart).
At this point, I picked one of the logical subsystems and drilled down to display the data by attached mainframe channel.
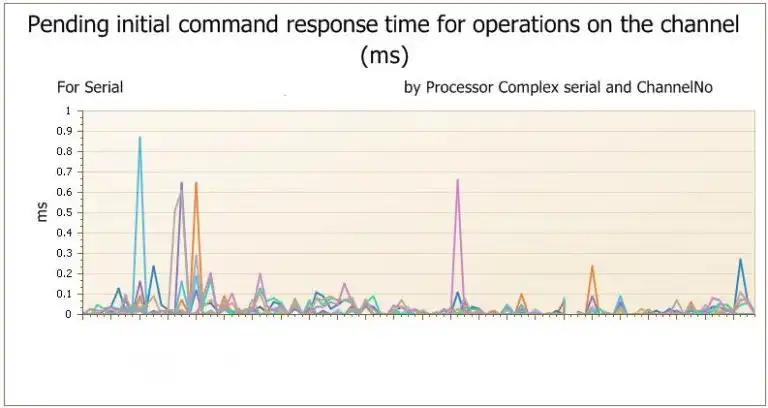
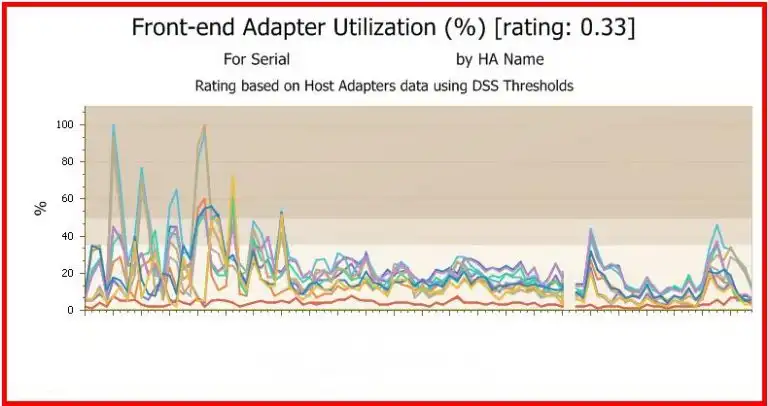
Here we see that not all channels are suffering, even during the bad times. Now, let’s next move over to host adapter utilization, displayed below.
In this chart, we see high utilizations for some, but not all, host adapters in the DS8870. The elevated CMR times are most likely due to contention at the host adapter. Options for improvement would include rebalancing channel workload across the host adapters, going to the next generation storage interconnection (server, director and storage all have at least 16Gbit capability), or both.
Do you know what your baseline command response time is in your environment? Does your storage exhibit pain points at times? Using IntelliMagic Vision is a very powerful way to quantify and resolve this before it suddenly becomes a major issue for you.
This article's author
 Joe Hyde
 Share this blog
Related Resources
IntelliMagic Vision Support for Hitachi VSP SMF Records from Mainframe Analytics Recorder
Learn how to gain insight into the health of the Hitachi Virtual Storage Platforms VSP 5000 series and VSP F/G1x00 storage systems using the SMF records created by the Hitachi Mainframe Analytics Recorder.
From Taped Walls to Your PC: z/OS Configuration Made Simple with Topology | IntelliMagic zAcademy
In this webinar, we explore a technique that integrates diverse data sources from z/OS, presenting them in a clear, concise, and interactive visual format.
Banco do Brasil Ensures Availability for Billions of Daily Transactions with IntelliMagic Vision
Discover how Banco do Brasil enhanced its performance and capacity management with IntelliMagic Vision, proactively avoiding disruptions and improving cross-team collaboration.
Book a Demo or Connect With an Expert
Discuss your technical or sales-related questions with our mainframe experts today