Manage MQ Queue Managers and Activity with IntelliMagic Vision
IntelliMagic Vision enables performance analysts to manage and optimize their z/OS MQ configurations and activity more effectively and efficiently, as well as proactively assess the health of their queue managers.
View the video for an example of those capabilities.

Manage CPU Consumption and Optimize MQ Performance with Built-In Health Insights

Proactively Analyze and Prevent Risks
Utilize built-in health insights and artificial intelligence to proactively identify risks, ensure availability, and optimize your MQ environment.
Save Time and Quickly Resolve Issues
Quickly spot and resolve issues using thousands of out-of-the-box reports, built-in live edit, compare, share, and drill down features.

Optimize and Lower IBM Software Costs
Utilize the same unrivaled insights into CPU consumption and drivers of software costs used by Watson & Walker to reduce your costs.
Built-In Intelligence at Your Fingertips
Proactively Assess Key Queue Manager Metrics to Enhance Availability
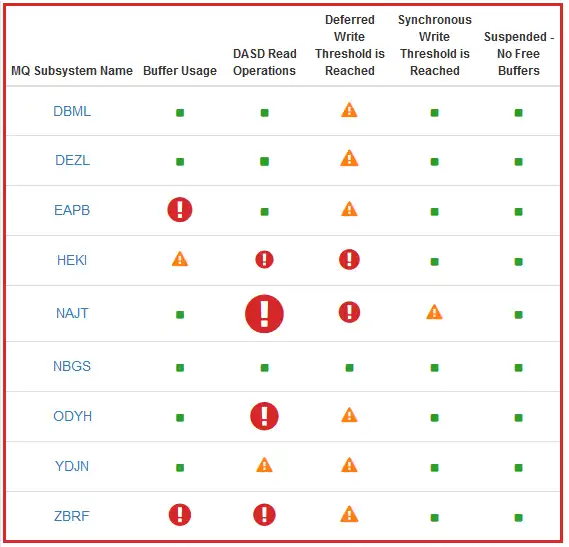
As with Db2, responsive performance from MQ relies on data residing in memory, so buffer pool management is an important aspect of managing MQ performance.
IntelliMagic Vision automatically assesses every buffer pool in every queue manager to identify areas that may warrant additional investigation and presents these findings in a red/yellow/green manner that can be quickly consumed.
Drilldown capabilities into each metric facilitate quick follow-on analysis.
Profile Queue Manager Workloads
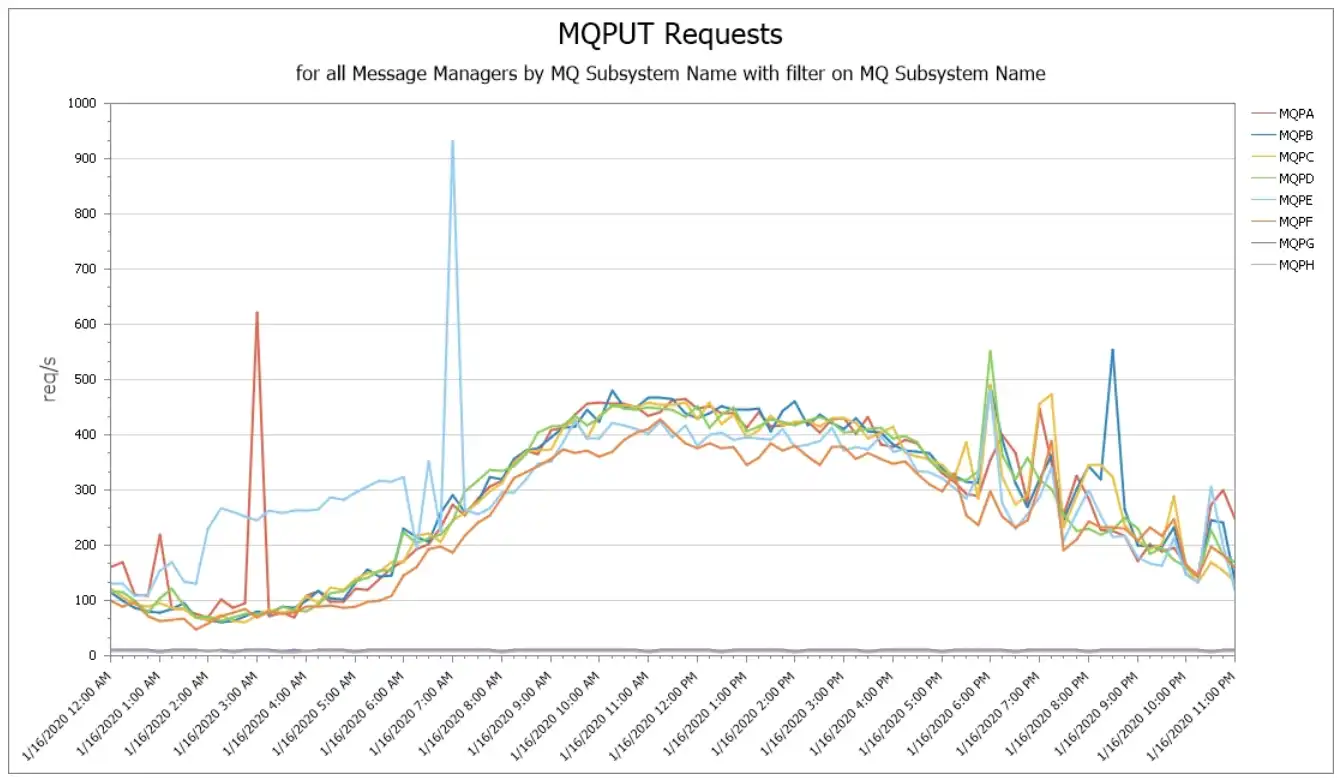
A view of the number of requests by type of MQ command can be a good starting point for identifying a workload baseline, as well as an indicator of any significant workload changes.
Easy visibility into this data shows (in this example) the volume of requests to PUT messages to the queues, which queue managers have the most activity, the time of day profile, etc.
Analyze Buffer Pool Utilizations
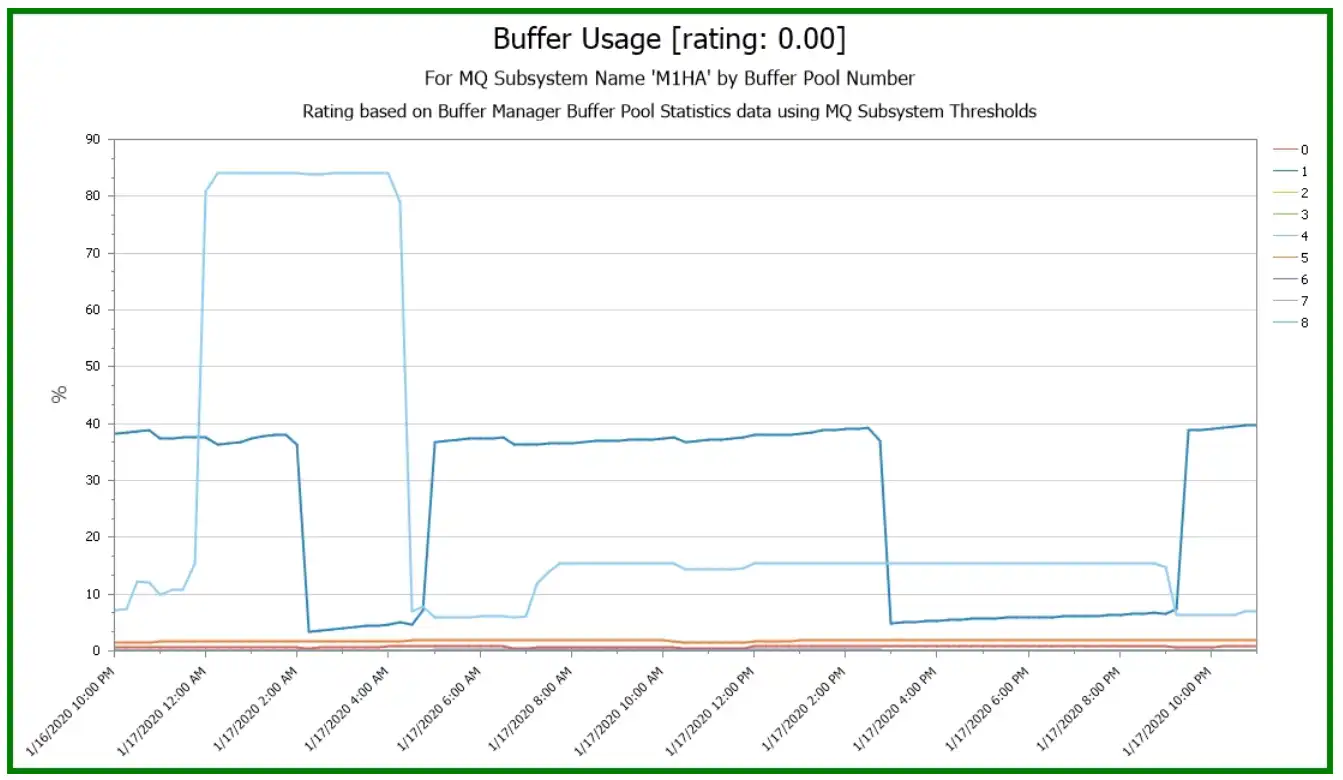
Views of buffer pool utilizations over time can indicate when these values are approaching thresholds that prompt automated de-staging to disk.
This example shows an extended interval when buffer pool 4 is nearing the 85% threshold that triggers asynchronous de-staging.
Monitor MQ Logging Infrastructure
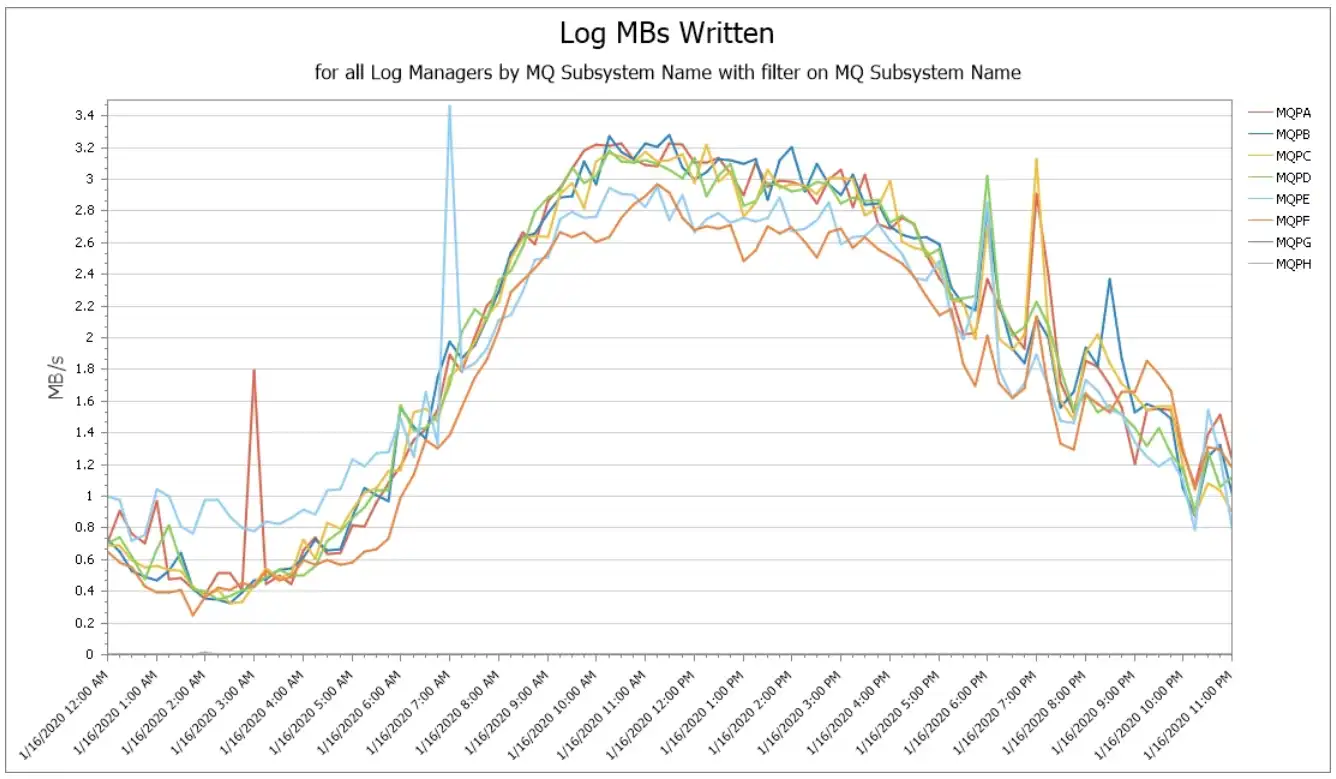
As with Db2, a well-performing MQ logging infrastructure is essential to support recovery and backout (driven largely by persistent messages) without impacting ongoing performance.
Log Manager metrics can help identify any bottlenecks that may be occurring in log processing.
One metric that may be useful from a profiling perspective is the volume of data being logged.
View Activity by Queue Name
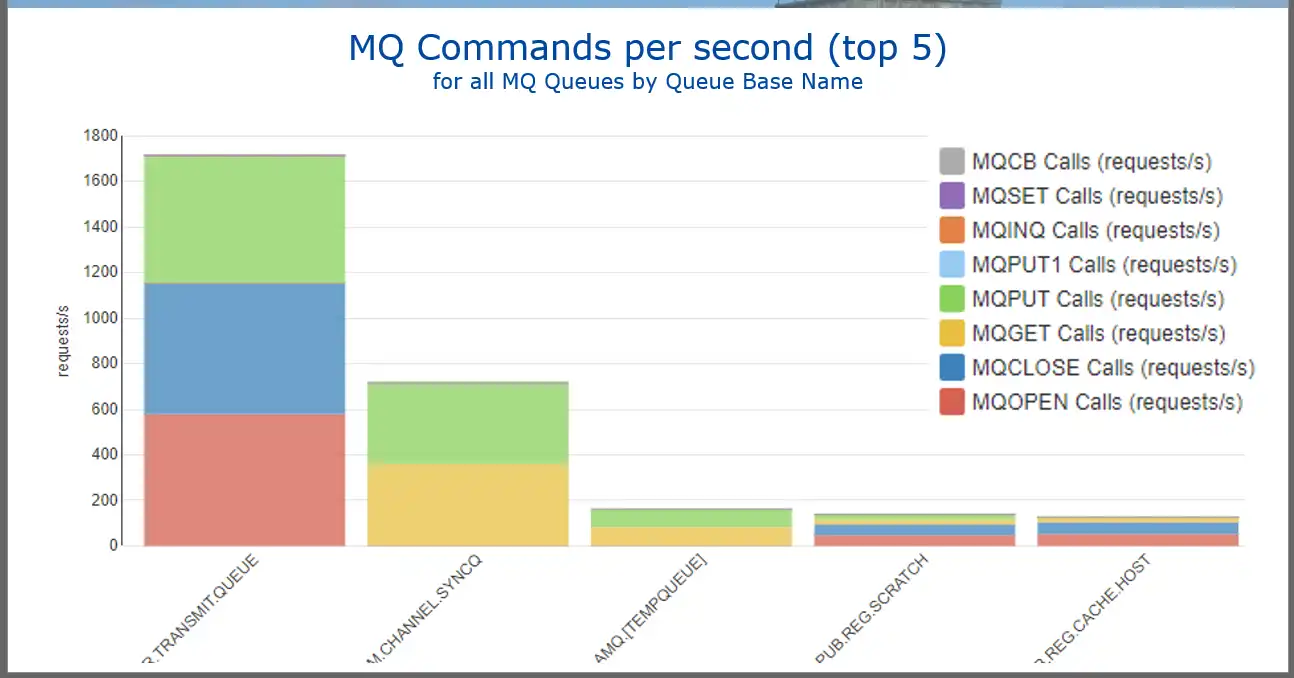
MQ Accounting data provides detailed activity metrics at many levels, which are invaluable to performance specialists as they investigate application problems and carry out performance tuning.
This example of command rates by queue name shows unique distributions across various types of queues, including a cluster transmission queue (first, no GETs), queues that process primarily PUTs and GETs in comparable numbers (second and third), and queues with high levels of OPEN and CLOSE activity (fourth and fifth).
Breakout MQ CPU by Workload Drivers
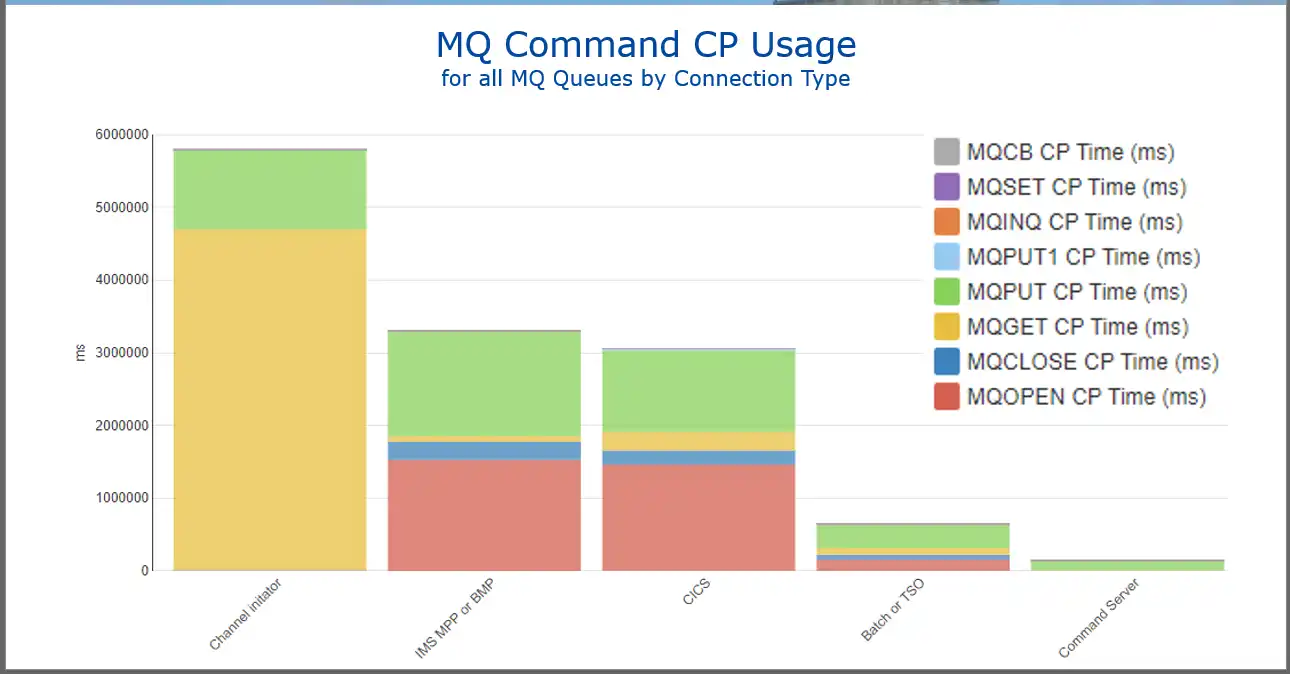
Another level of detail found in the MQ Accounting data is the type of work calling MQ (“connection type”).
In this example, the three primary drivers of MQ CPU are channel initiators and work arriving from IMS and CICS.
Analyze CPU per MQ Call
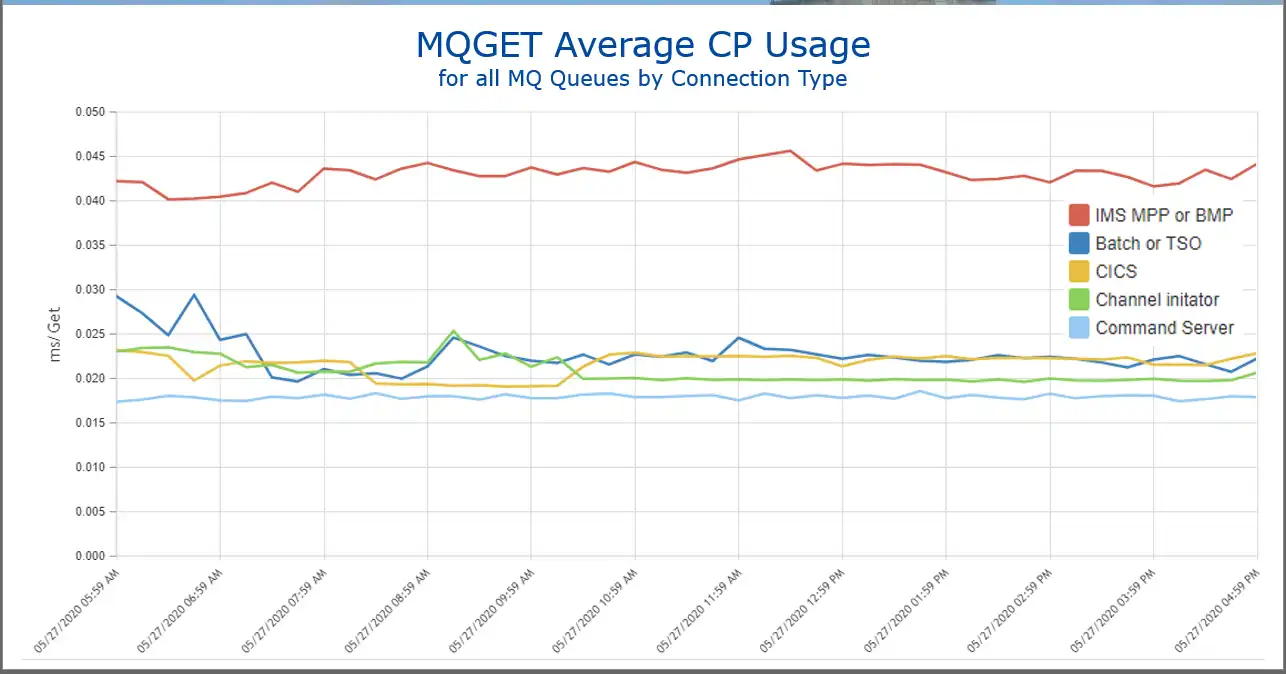
Other types of analysis may focus on metrics such as CPU and elapsed times on a per-call basis.
Though the absolute numbers are small, this view indicates that CPU time per MQGET call for work arriving from IMS is approximately double that of other types of work.
Compare and Correlate Multiple Metrics
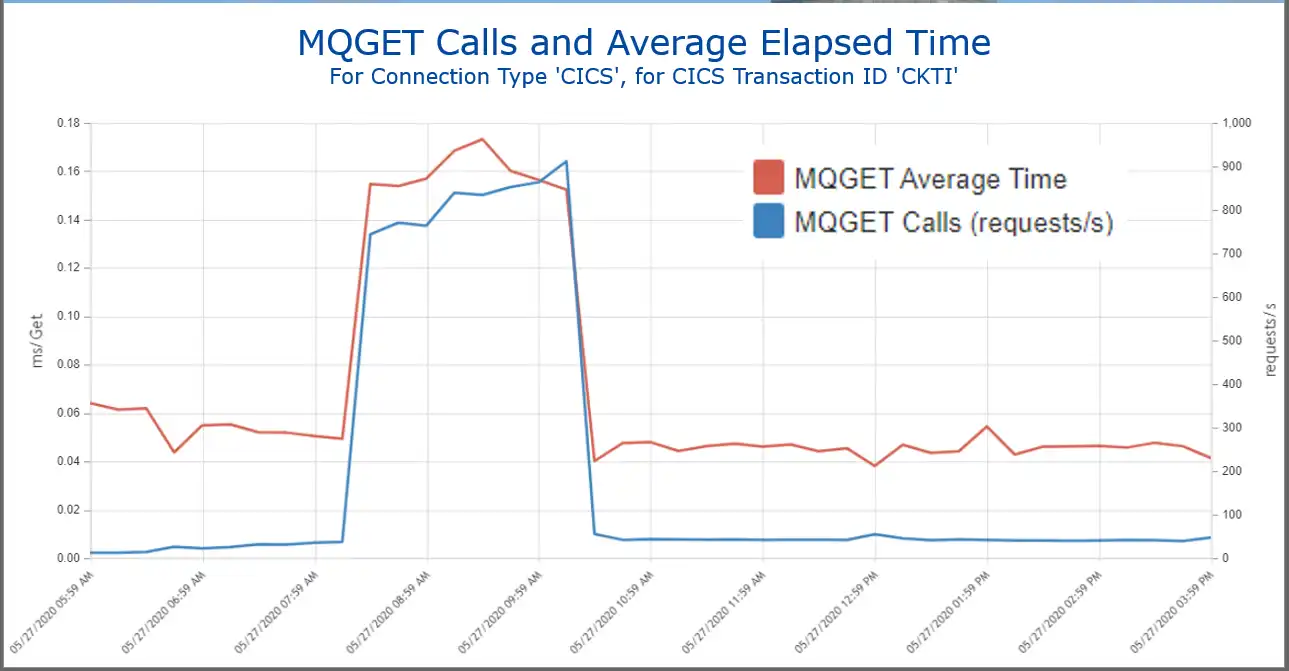
The capability to customize reports to combine multiple variables to analyze potential correlations can greatly aid analysis.
In many of today’s solutions that rely on catalogs of static reports, adhoc analysis like this typically requires the coding effort to develop a new report.
This example combining the rate of MQ GET calls and the average elapsed time for work generated by a specific CICS transaction shows a strong correlation.
Drilldown to Isolate Message Length Profiles by CICS Transactions
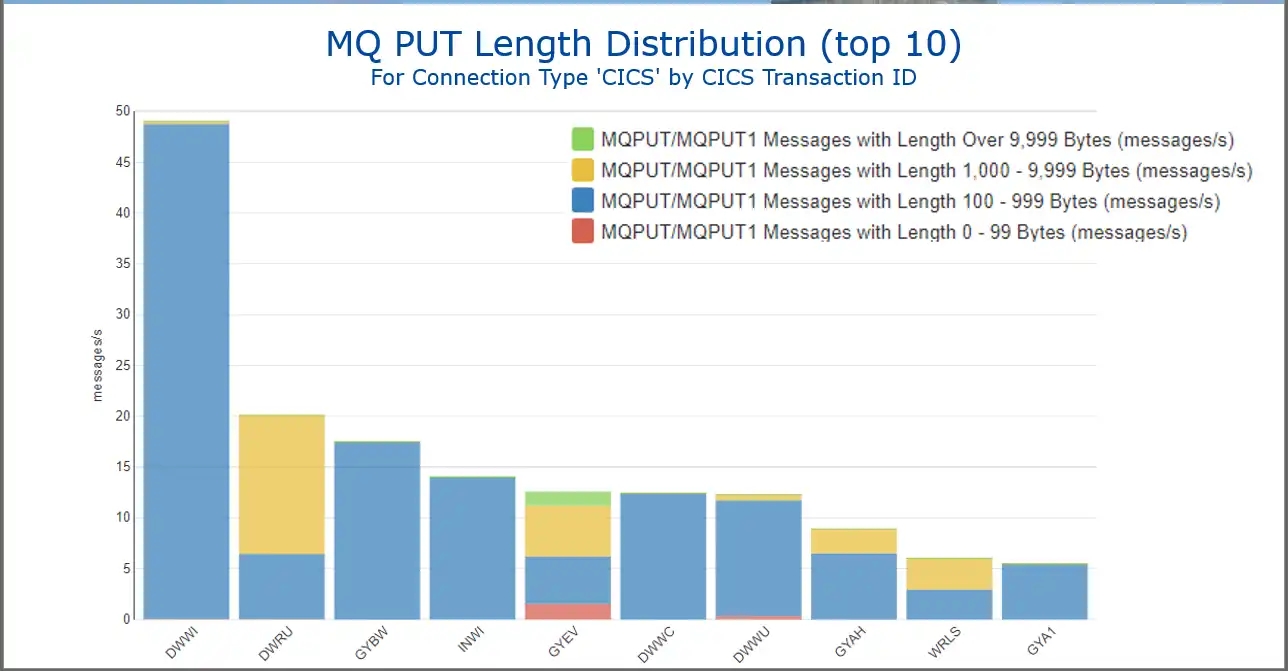
Though most sites tend to have massive volumes of MQ Accounting data, dynamic navigation and context-sensitive drilldown capabilities enable the analyst to quickly focus on a specific subset of the data.
In this example of message length distribution data, drilldowns into work originating from CICS and then further by CICS transaction ID profile the length of messages being “PUT” by transaction.
AIOps via SaaS Delivery

Advantages to adopting a cloud model include rapid implementation (no lead time to install and setup the product locally), minimal setup (only for transmitting SMF data), offloading staff resources required to deal with SMF processing issues or to install product maintenance, and easy access to IntelliMagic consulting services to supplement local skills.
Proactively Assess Key Queue Manager Metrics to Enhance Availability
As with Db2, responsive performance from MQ relies on data residing in memory, so buffer pool management is an important aspect of managing MQ performance.
IntelliMagic Vision automatically assesses every buffer pool in every queue manager to identify areas that may warrant additional investigation and presents these findings in a red/yellow/green manner that can be quickly consumed.
Drilldown capabilities into each metric facilitate quick follow-on analysis.
Profile Queue Manager Workloads
A view of the number of requests by type of MQ command can be a good starting point for identifying a workload baseline, as well as an indicator of any significant workload changes.
Easy visibility into this data shows (in this example) the volume of requests to PUT messages to the queues, which queue managers have the most activity, the time of day profile, etc.
Analyze Buffer Pool Utilizations
Views of buffer pool utilizations over time can indicate when these values are approaching thresholds that prompt automated de-staging to disk.
This example shows an extended interval when buffer pool 4 is nearing the 85% threshold that triggers asynchronous de-staging.
Monitor MQ Logging Infrastructure
As with Db2, a well-performing MQ logging infrastructure is essential to support recovery and backout (driven largely by persistent messages) without impacting ongoing performance.
Log Manager metrics can help identify any bottlenecks that may be occurring in log processing.
One metric that may be useful from a profiling perspective is the volume of data being logged.
View Activity by Queue Name
MQ Accounting data provides detailed activity metrics at many levels, which are invaluable to performance specialists as they investigate application problems and carry out performance tuning.
This example of command rates by queue name shows unique distributions across various types of queues, including a cluster transmission queue (first, no GETs), queues that process primarily PUTs and GETs in comparable numbers (second and third), and queues with high levels of OPEN and CLOSE activity (fourth and fifth).
Breakout MQ CPU by Workload Drivers
Another level of detail found in the MQ Accounting data is the type of work calling MQ (“connection type”).
In this example, the three primary drivers of MQ CPU are channel initiators and work arriving from IMS and CICS.
Analyze CPU per MQ Call
Other types of analysis may focus on metrics such as CPU and elapsed times on a per-call basis.
Though the absolute numbers are small, this view indicates that CPU time per MQGET call for work arriving from IMS is approximately double that of other types of work.
Compare and Correlate Multiple Metrics
The capability to customize reports to combine multiple variables to analyze potential correlations can greatly aid analysis.
In many of today’s solutions that rely on catalogs of static reports, adhoc analysis like this typically requires the coding effort to develop a new report.
This example combining the rate of MQ GET calls and the average elapsed time for work generated by a specific CICS transaction shows a strong correlation.
Drilldown to Isolate Message Length Profiles by CICS Transactions
Though most sites tend to have massive volumes of MQ Accounting data, dynamic navigation and context-sensitive drilldown capabilities enable the analyst to quickly focus on a specific subset of the data.
In this example of message length distribution data, drilldowns into work originating from CICS and then further by CICS transaction ID profile the length of messages being “PUT” by transaction.
AIOps via SaaS Delivery
Advantages to adopting a cloud model include rapid implementation (no lead time to install and setup the product locally), minimal setup (only for transmitting SMF data), offloading staff resources required to deal with SMF processing issues or to install product maintenance, and easy access to IntelliMagic consulting services to supplement local skills.
End-to-End Infrastructure Analytics for z/OS Performance Management
zSystems Performance Management
Optimize z/OS Mainframe Systems Management with Availability Intelligence
Benefits
Optimize z/OS Systems performance management using AI-driven analytics to proactively monitor and manage your z/OS environment, prevent disruptions, reduce costs, and preserve the reliability and availability that mainframes are known for.
Explore z/OS Systems Performance Analytics
Db2 Performance Management
Prevent Availability Risks and Optimize Db2 Performance
Benefits
The volume and complexity of Db2 Statistics data and Db2 Accounting data creates a major challenge for analysts who want to derive value from the rich metrics available.
Easy visibility into key Db2 metrics through SMF records is crucial to proactively prevent availability risks and to effectively manage and optimize performance.
Explore Db2 Performance Analytics
Easy visibility into key Db2 metrics through SMF records is crucial to proactively prevent availability risks and to effectively manage and optimize performance.
CICS Performance Management
Monitor and Profile CICS Transactions and Regions with IntelliMagic Vision
Benefits
CICS SMF Transaction data is a rich source of performance insights, but its volume can make analysis challenging using traditional approaches that rely on static reports. Proactive assessment of key Statistics metrics across all regions is essential to identify potential risks to availability.
IntelliMagic Vision enables performance analysts to manage and optimize their z/OS CICS transactions more effectively and efficiently, as well as proactively assess the health of their CICS regions.
Explore CICS Performance Analytics
IntelliMagic Vision enables performance analysts to manage and optimize their z/OS CICS transactions more effectively and efficiently, as well as proactively assess the health of their CICS regions.
Virtual Tape Performance Management
Proactively Manage Virtual and Physical Tape Environments
Benefits
With tape virtualization, tape storage became easier and more economical, but at the same time, more difficult to understand which changes or hardware upgrades are the best choices. With tape libraries being shared across multiple z/OS images, the full picture can only be obtained by aggregating workload and tape hardware information from all z/OS LPARs.
IntelliMagic Vision enables performance analysts to manage and optimize their z/OS Virtual Tape environments more effectively and efficiently.
Explore Tape Performance Analytics
IntelliMagic Vision enables performance analysts to manage and optimize their z/OS Virtual Tape environments more effectively and efficiently.
Disk & Replication Performance Management
Automatically Detect Disk Performance Risks & Quickly Resolve Issues
Benefits
As Disk speeds and throughputs have increased, z/OS applications have come to rely on fast and consistent storage performance. To respond quickly to unexpected disk and replication issues, it is essential that you have insight into the health of the various components in your storage environment.
IntelliMagic Vision enables performance analysts to manage and optimize their z/OS Disk and Replication environment more effectively and efficiently.
Explore Disk Performance Analytics
IntelliMagic Vision enables performance analysts to manage and optimize their z/OS Disk and Replication environment more effectively and efficiently.
MQ Performance Management
Optimize and Analyze MQ Activity and Performance
Benefits
MQ is widely used across z/OS environments, but sites often find it challenging to derive the valuable performance insights potentially available from MQ SMF Statistics and Accounting data due to limitations in existing reporting and available tooling.
IntelliMagic Vision enables performance analysts to manage and optimize their z/OS MQ configurations and activity more effectively and efficiently, as well as proactively assess the health of their queue managers.
Explore MQ Performance Analytics
IntelliMagic Vision enables performance analysts to manage and optimize their z/OS MQ configurations and activity more effectively and efficiently, as well as proactively assess the health of their queue managers.
z/OS Network Performance Management
Automatically Monitor Mainframe Network Security and Protect Your Data
Benefits
TCP/IP is the core of the communication for the z/OS mainframe, both for traffic into and out of the mainframe and internal communication among z/OS images and processor complexes. Proper management is necessary to secure and protect system availability.
IntelliMagic Vision automatically generates GUI-based, interactive, IBM best-practice compliant rated reports that proactively identify areas that indicate potential upcoming risk to TCP/IP health, performance, and security.
Explore z/OS Network Performance Analytics
IntelliMagic Vision automatically generates GUI-based, interactive, IBM best-practice compliant rated reports that proactively identify areas that indicate potential upcoming risk to TCP/IP health, performance, and security.
z/OS Connect: Modern Mainframe API Environment
Optimizing Mainframe API Monitoring for Improved Resource Management
Benefits
IntelliMagic Vision enhances mainframe API monitoring and profiling, providing crucial visibility to address issues at the API or service level, ultimately aiding performance analysts in better resource planning and management reporting.
Explore z/OS Connect Analytics
See Why IntelliMagic is Trusted by Some of the World’s Largest Mainframe Sites
Book a Demo or Connect With an Expert
Discuss your technical or sales-related questions with our mainframe experts today
Solutions for your Problems
Elevate IT Team Impact
Empower new staff and experts. Replace antiquated reporting with automated, intelligent analytics.
Benefits
Artificial Intelligence using built-in expert knowledge and statistics assesses and rates key metrics as good versus bad from a performance or efficiency perspective for the analyst.
Force multiplier - Invite AI to the team to help both new and expert team members in a tight job market.
Cloud Delivery - Immediate access with no maintenance needed.
Force multiplier - Invite AI to the team to help both new and expert team members in a tight job market.
Cloud Delivery - Immediate access with no maintenance needed.
Optimize & Reduce Costs Safely
Save money without compromising service levels or availability.
Benefits
Reduce cost with superior visibility into drivers of cost such as inefficient CPU utilization, configuration and priority issues, imbalance of workloads across hardware resources, consolidation opportunities, etc.
Reduce hardware spend without negative impact on service levels.
Avoid the costs of service delivery problems without both human cost and application unavailability cost.
Reduce hardware spend without negative impact on service levels.
Avoid the costs of service delivery problems without both human cost and application unavailability cost.
Prevent Performance Problems
Predict and Prevent many IT issues without incurring typical false positive and false negative issues.
Benefits
Automatically quantify risks in the z/OS infrastructure for peak workloads or configuration issues prior to production impact being felt by application end-users. Go beyond KPI to KRI (Key Risk Indicators) root cause monitoring.
Continuous Health Assessment of application and infrastructure stress; assesses millions of metrics using context-specific expert knowledge and statistical techniques.
Continuous Health Assessment of application and infrastructure stress; assesses millions of metrics using context-specific expert knowledge and statistical techniques.
Resolve Issues Quickly
Accelerate Mean Time To Resolution for unpredictable problems with AI-augmented diagnosis.
Benefits
Rapidly identify where problems are occurring with infrastructure wide exception (anomaly) tables, intelligent navigation through the data from big picture to extremely granular levels, automated compare of time periods, and more.
See and understand what applications are affected, what part of the infrastructure, what time frames, and get clues as to probable cause.
See and understand what applications are affected, what part of the infrastructure, what time frames, and get clues as to probable cause.
Flexible Deployment and Monitoring

In the Cloud
Cloud based deployment can be accessed from everywhere in the world and is easy to share with colleagues

Services & Support
Take advantage of IntelliMagic's experienced performance experts for standalone custom services or daily monitoring

On Premise
Install the software on premise and use it offline for total control of your installation
Optimize and Analyze MQ Activity and Performance
MQ is widely used across z/OS environments, but sites often find it challenging to derive the valuable performance insights potentially available from MQ SMF Statistics and Accounting data due to limitations in existing reporting and available tooling.
When managing your MQ environment, you need an easy and effective way to focus your analysis so you can rapidly find what you are looking for.
IntelliMagic Vision provides GUI-based, interactive reports with dynamic navigation and context-sensitive drilldowns to facilitate rapid and focused access to MQ data to manage, tune, and optimize your environment.
With IntelliMagic Vision, you will be able to:
- Profile MQ queue manager and buffer pool activity
- Easily view key logging metrics as well as those produced by every MQ component
- Proactively assess the health of all MQ queue managers
- Analyze elapsed and CPU times for MQ activity at detailed levels (e.g., by queue name or connection type)
IntelliMagic Vision offers you the out-of-the-box visibility and seamless navigation to manage every component of your z Systems infrastructure under a single solution.
Continue Learning with These Resources
Brochures and Datasheets
Connect With an Expert
Discuss your technical or sales-related questions with our mainframe experts today