
What’s in a storage system response time? Every storage system vendor has different methods and definitions surrounding the response times provided, but unfortunately most of the explanations lack clarity into the components of the response times.
In this blog we will examine the components of the response times for I/O on a fibre channel fabric with block storage.
4 Steps Required for an I/O To Be Completed
Figure 1 displays the steps that occur for an I/O to be completed:
- The host initiates the I/O request
- Switch routes the request to the target address
- The storage system receives the requests (starts an internal processing counter) and performs processing to gather the required data. It then sends the data back to the host, stops internal processing counter on send and starts the network timer.
- The host receives and processes the data and sends an acknowledgement of receipt. The storage system receives the acknowledgment and stops the network timer.
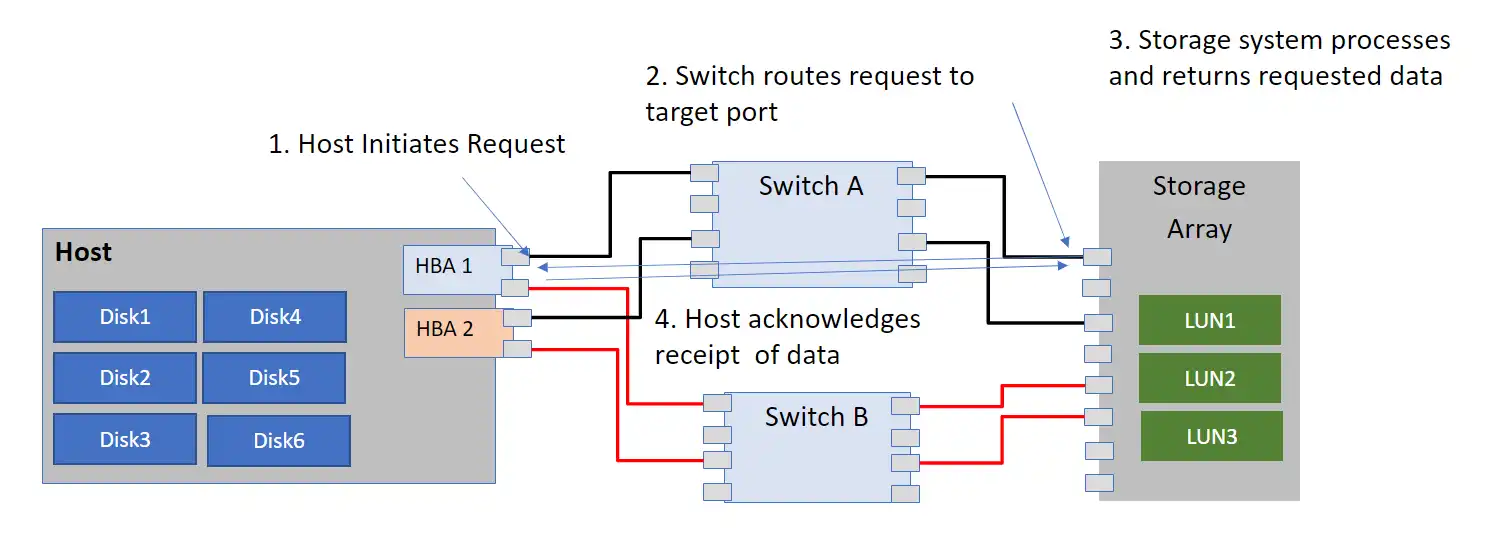
Figure 1: Steps required for an I/O to be completed
All response time measurements observed at the storage array are limited in visibility. For example, the storage array cannot know when the host has sent the request, nor does it know the duration of time between the initial host send and the receipt at the storage array.
That is, the time accumulated in step 1 and step 2 above is opaque to the storage system. One could wager that the amount of time in step 1 is roughly equivalent to the amount of time in step 4, but they couldn’t be certain without timing measurements from the host or the switches.
Various Response Time Definitions
Now that we understand the basic steps, we can define and categorize the different types of response times, also referred to as latencies, that may be available. In reality it depends on what the vendor thought was important, but generally the following variations are encountered in storage system performance data:
Internal processing
This is the time between receiving the host I/O request and sending back the response.
Round-trip time
Also called end-to-end response time. This is the time between reception of the host I/O request, and reception of the host acknowledgement after sending the response.
Network time
This is the difference between round-trip time and internal processing. In addition to the actual time spent in the fabric, this includes the time spent by the host to ingest the response of the storage system. While this is referred to as network time, it does not include the time spent between when the host has initiated a request and the moment the request is received by the storage system.
Full
Internal processing and round-trip time are both available.
Data Sources for Storage Hardware Platforms
The measurement available for a few of the platforms supported by IntelliMagic Vision are:
| Volume metrics | Port metrics | |
| IBM DS8000 | Round-trip time | Network time |
| HPE 3PAR | Internal processing | Round-trip time |
| INFINIDAT InfiniBox | Full | Full |
| Huawei OceanStor | Internal processing | Internal processing |
| Pure FlashArray | Full | N/A |
Having at least two of internal processing, round-trip time, and network time available can be very helpful in diagnosing the root cause of an observed increase in response time.
For example, if the internal processing time is high, the cause is likely in the storage system configuration, whereas if the internal processing time is good, and only the network time and/or round-trip time is high, the cause is likely in the fabric or at the host.
Obviously, having both timers available for the volumes and the ports is best, but even in situations such as for the IBM DS8000 and HPE 3PAR series, being able to compare the metrics for the ports and volumes provides valuable insights in the health of the storage infrastructure.
Conclusion
As you can tell, various vendors provide varying measurements at the volume and port level. When visualizing the response time data, it is very important to understand if you are looking at the internal processing time, the round-trip time, or the difference between the two.
When you understand what you are looking at you can also interpret whether it is good or bad.
IntelliMagic Vision automatically applies hardware specific and measurement specific thresholds to intelligently highlight areas of your infrastructure that have performance risks. For a multi-vendor environment, it is especially important to properly interpret the response times so that you can manage any risk in the host, fabric, or storage array.
If you would like to see intelligent interpretation in action, start a free trial of IntelliMagic Vision so that you can see for yourself.
This article's author
 Brett Allison
 Share this blog
Related Resources
Improve Collaboration and Reporting with a Single View for Multi-Vendor Storage Performance
Learn how utilizing a single pane of glass for multi-vendor storage reporting and analysis improves not only the effectiveness of your reporting, but also the collaboration amongst team members and departments.
A Single View for Managing Multi-Vendor SAN Infrastructure
Managing a SAN environment with a mix of storage vendors is always challenging because you have to rely on multiple tools to keep storage devices and systems functioning like they should.
Cleaning up the SAN Fabric: Getting Your House in Order Part Two
Cleaning up SAN fabric zones and storage array masking views are often a forgotten part of good storage hygiene. Although unused zones and masking views may seem harmless, they pose an availability risk to your environment on multiple fronts.
Request a Free Trial or Schedule a Demo Today
Discuss your technical or sales-related questions with our availability experts today