
Processor cache designs in current z processors contain distinct cache lines that separate instructions and data. As a result, programs that store data into the instruction stream introduce major inefficiencies into CPU performance. To identify and quantify this issue, IBM has identified the “Store Into Instruction Stream” (SIIS) metric derived from counters captured in SMF 113 records. Updating SIIS programs can result in significant reduction of CPU utilization.
(Note that modern compilers do not cause this condition, but instead it is typically only an issue for older programs written in Assembler.)
IntelliMagic Vision calculates SIIS values by system for processor models beginning with the zEC12 and presents this in the Processor Hardware “Analysis” report sets customized by processor type.
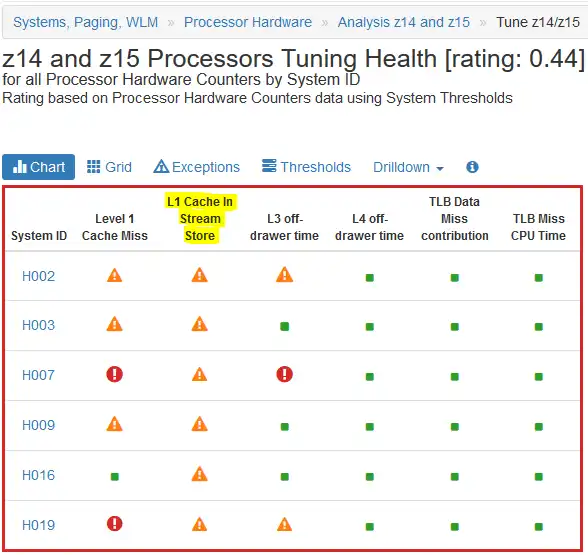
Figure 1: z14 and z15 Processors Tuning Health
Figure 1 comes from the “Tuning z14/z15” report in the “Analysis z14 and z15” report set, and the SIIS assessments appear under “L1 Cache In Stream Store” alongside other key metrics. The default thresholds used to assess SIIS are aligned with the published IBM recommendations.
As we can see, every system has a warning indicator under the L1 Cache in Stream Store. As is the case with all Health Insights views, the “Time Charts” drilldown displays charts for each metric that can be used to compare their values at a glance.
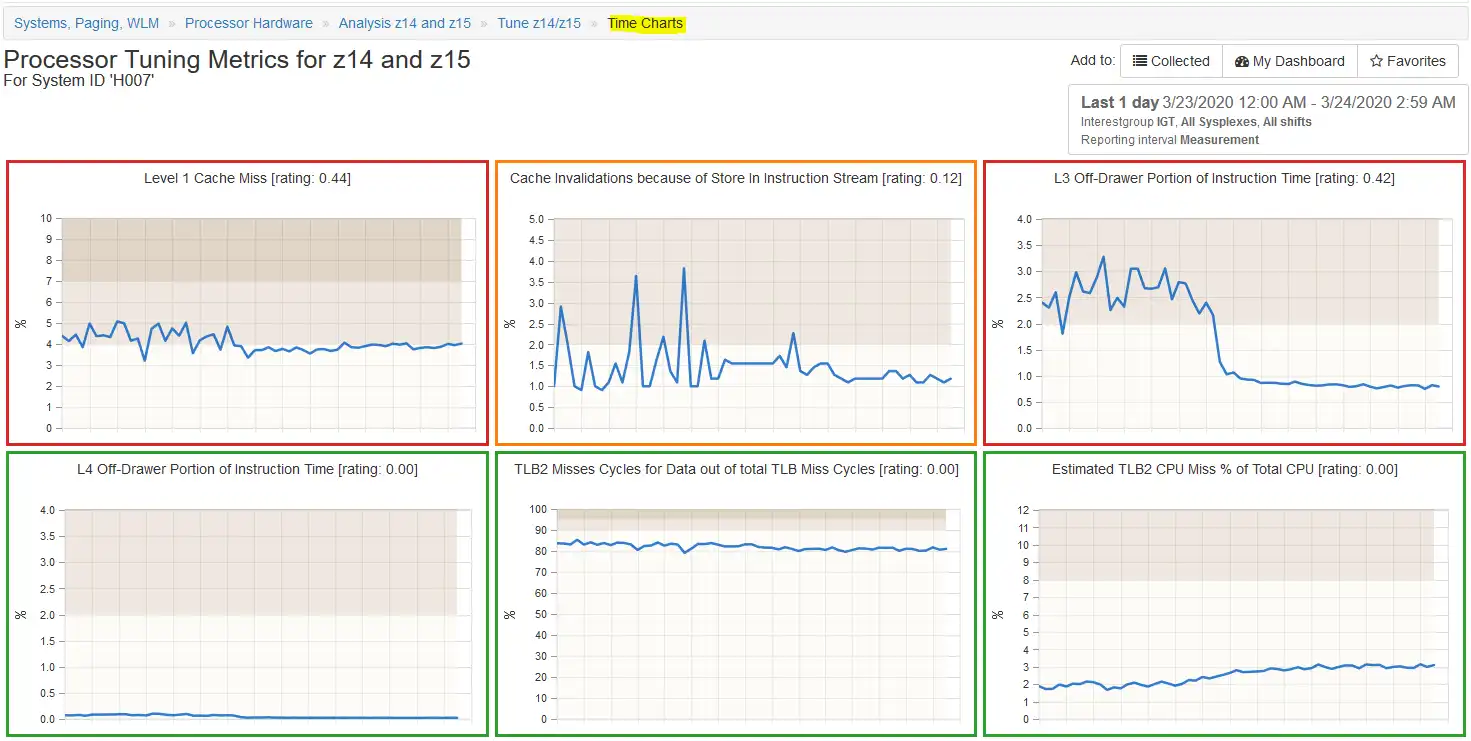
In Figure 2, the Level 1 Cache Miss and L3 Off-Drawer Portion of Instruction Time charts have red borders, indicating the values for these metrics frequently exceed our warning or exception thresholds. Cache Invalidations because of SIIS has a yellow border, indicating a warning, and the L4 Off-Drawer Portion of Instruction Time, the TLB2 Misses Cycles for Data, and the Estimated TLB2 CPU Miss % of Total CPU charts have green borders indicating no warnings or exceptions there.
From this display, any of the time-charts can be selected for more detailed analysis.
Figure 3 shows us the Cache Invalidations for System H007 for a single day.
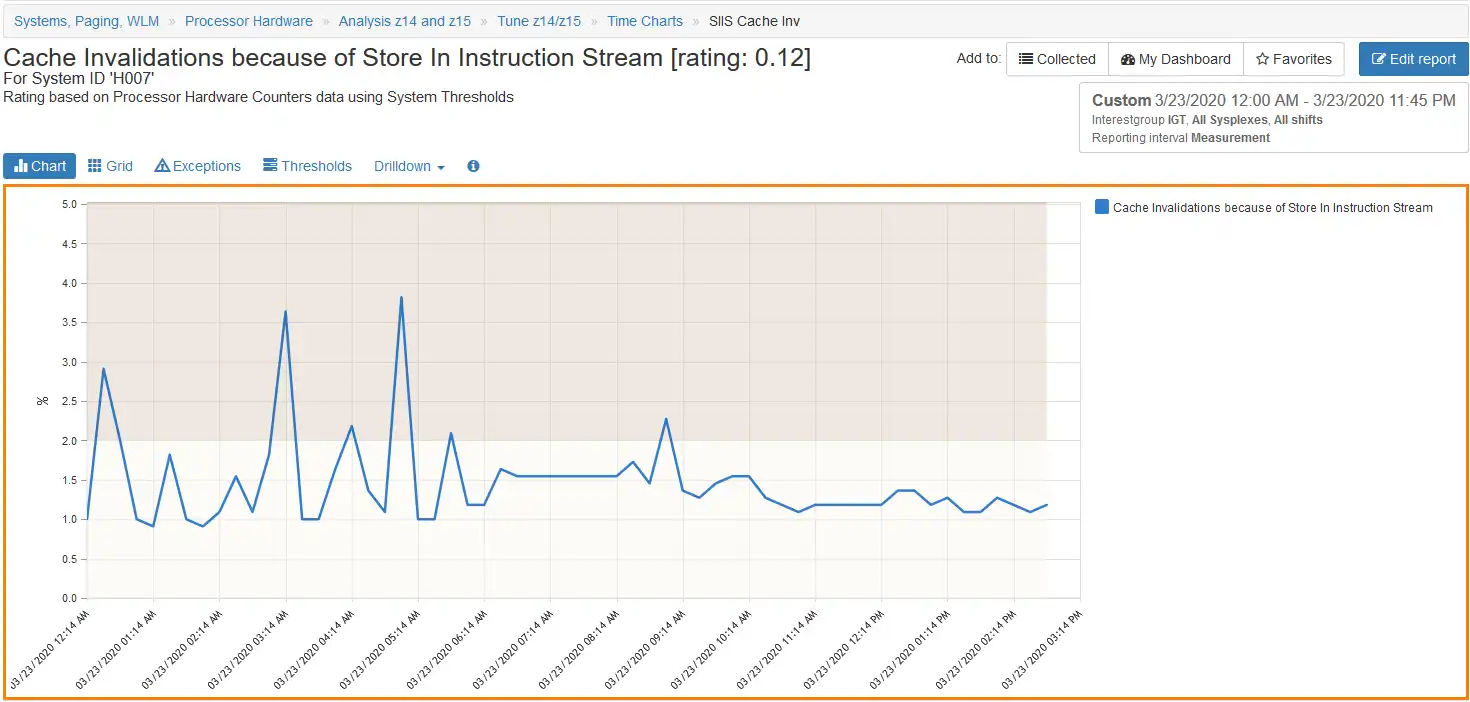
Figure 3: Cache Invalidations because of SIIS (for one day)
Figure 4 shows the Cache Invalidations for System H007 for each day over the selected interval. The legend of the chart indicates in bold days when more frequent exceptions occur.
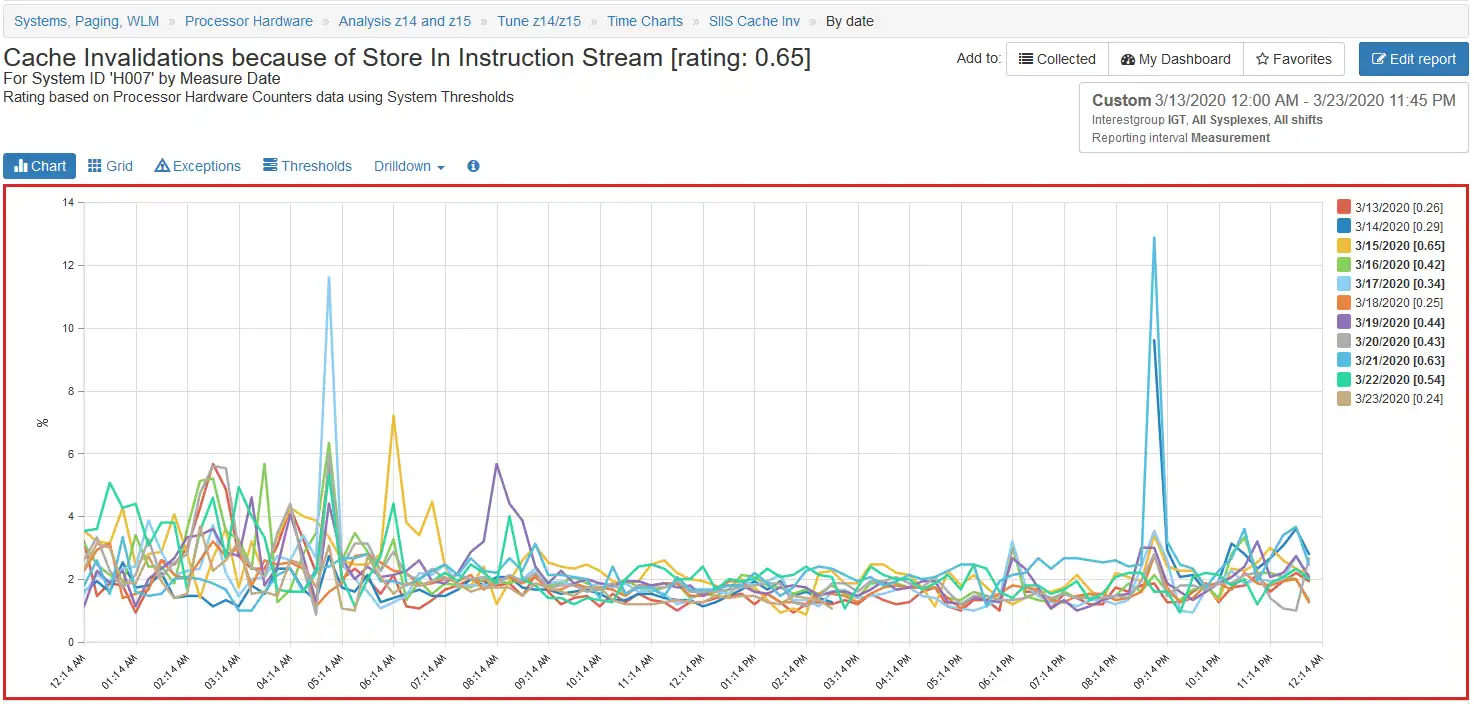
Figure 4: Cache Invalidations because of SIIS (by Measure Data)
And we can also look at the Cache Invalidations by day of the week as shown in Figure 5. The profile is relatively consistent across the days, indicating the more “serious offenders” are likely part of a daily batch cycle.
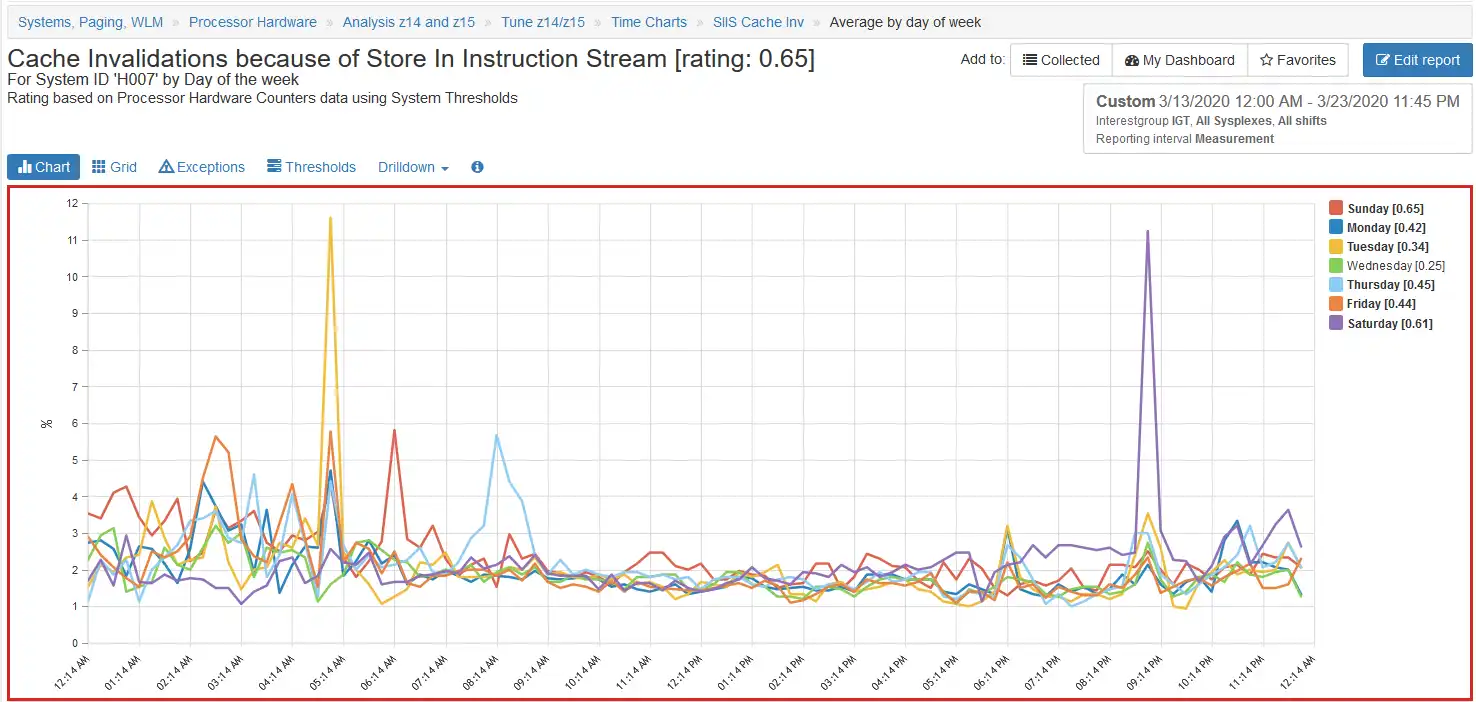
Figure 5: Cache Invalidations because of SIIS (by day of week)
Identify and Resolve Cache Invalidations with Visibility into SIIS Data
IntelliMagic Vision is continually adding support and access to new and important metrics as they emerge and benefit our customers’ ability to manage and optimize their environment, and the recent addition of SIIS metrics is no different.
With easy access to these new metrics, IntelliMagic Vision users can now identify serious Cache Invalidations, drilldown to investigate the issues, and more easily resolve them.
If you’re interested in trying out IntelliMagic Vision for yourself, feel free to email us at info@intellimagic.com, or head over to this page to start a trial.
This article's author
 Todd Havekost
 Share this blog
Related Resources
Making Sense of the Many I/O Count Fields in SMF | Cheryl Watson's Tuning Letter
In this reprint from Cheryl Watson’s Tuning Letter, Todd Havekost addresses a question about the different fields in SMF records having different values.
What's New with IntelliMagic Vision for z/OS? 2024.2
February 26, 2024 | This month we've introduced changes to the presentation of Db2, CICS, and MQ variables from rates to counts, updates to Key Processor Configuration, and the inclusion of new report sets for CICS Transaction Event Counts.
Expanding Role of Sub-Capacity Processors in Today's Mainframe Configurations | Cheryl Watson's Tuning Letter
In this reprint from Cheryl Watson’s Tuning Letter, Todd Havekost delves into the role of sub-capacity processors in mainframe upgrades, providing insights on transitioning to a more efficient CPC.
Book a Demo or Connect With an Expert
Discuss your technical or sales-related questions with our mainframe experts today