
So you got a shiny new InfiniBox® system, and after a few months of loading it with migrated workloads you start to see some increases in response time. How do you figure out the root cause?
In order to understand the causes of the increase in latency you need to collect performance data for the key components of the storage array. Fortunately, INFINIDAT® provides an excellent API interface for gathering data and provides a free tool, InfiniMetrics®, for analyzing the data.
While the free tool is nice, it does not provide heterogenous support and doesn’t give you the end-to-end perspective that can be helpful when you want to make changes to your host and array configuration.
Measuring INFINIDAT data
The INFINIDAT API consists of a REST API that allows a client to pull both configuration and performance information including but not limited to the following:
Hosts/Clusters/Storage Volume/Pools: Read IOPS, Write IOPS, Total IOPS, Read Throughput, Write Throughput, Total Throughput, Read Response Time, Write Response Time, Total Response Time, RAM Cache Hit ratio, SSD Cache Hit ratio.
Storage Ports: Read IOPS, Write IOPS, Total IOPS, Read Throughput, Write Throughput, Total Throughput, Read Internal Response Time, Write Internal Response Time, Total Internal Response Time, Total Read Response Time, Total Write Response Time and Total Response Time.
With this information you can identify and resolve most performance issues that might arise on your INFINIDAT systems.
Identifying INFINIDAT Performance Issues
There are various ways to identify performance issues in your INFINIDAT systems. The most common approach is to wait until an application owner or user contacts the storage team. A better approach, and the one we will explore in this blog, is to proactively monitor the storage array looking for potential areas of concern.
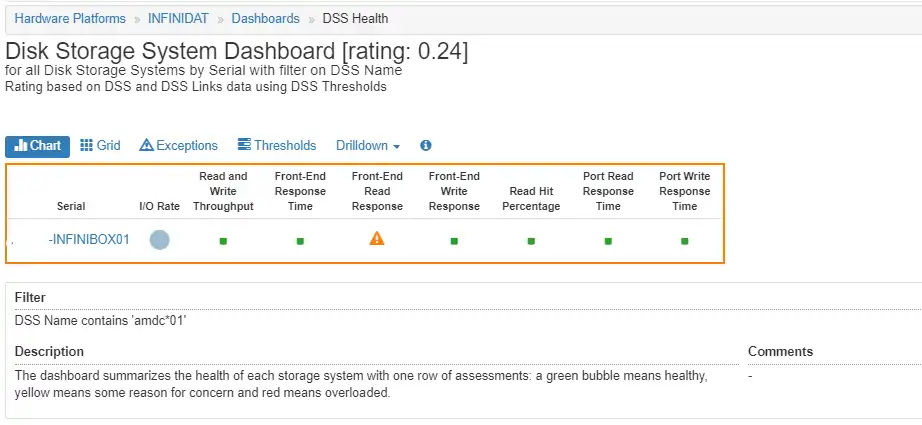
Figure 1 INFINIDAT Array Dashboard
Based on the IntelliMagic Vision dashboard above, we can see some elevated front-end read response times, but there is no port saturation because the port response times are excellent. By clicking on the yellow warning icon for front-end Read Response, we can drill down to the INFINIDAT Array Multi-charts view.
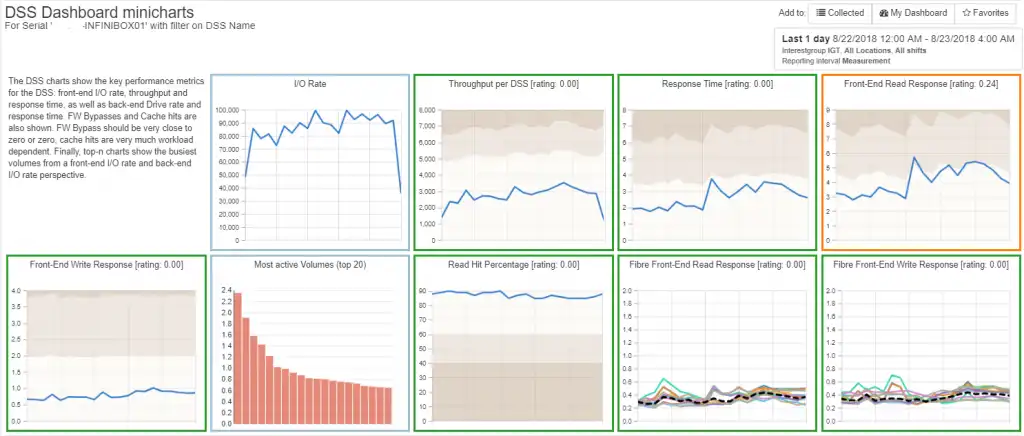
Figure 2 INFINIDAT Array Multi-charts
Here, as seen in Figure 2, we can observe the slightly elevated front-end read response times over time.
To identify the cause of the elevated response times we just need to drill down on the Front-end Read Response time charts to look at the read response times for each Storage Pool, as seen in Figure 3.
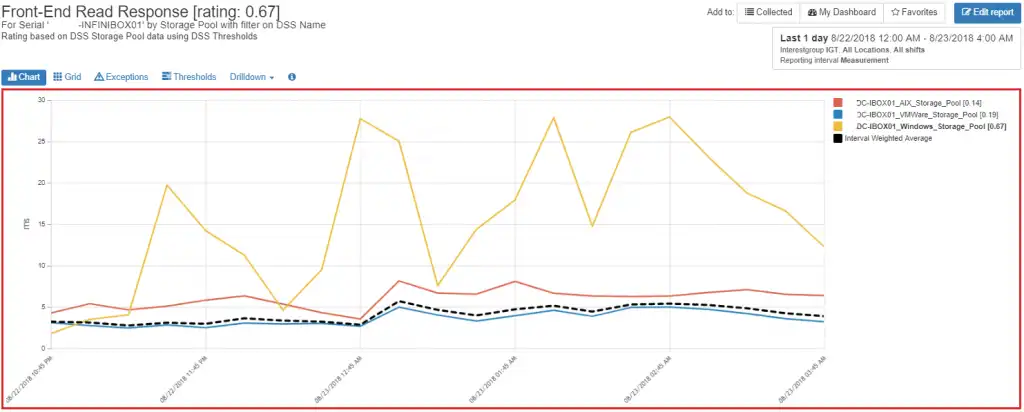
Figure 3 Storage Pool Response Time
Figure 3 shows us that the majority of the response time concern is with the yellow line (pool ‘DC-IBOX01_Windows_Storage_Pool’). By clicking on that particular storage pool, we can drill down to the read response times of this storage pool’s volumes, as shown in Figure 4 below.
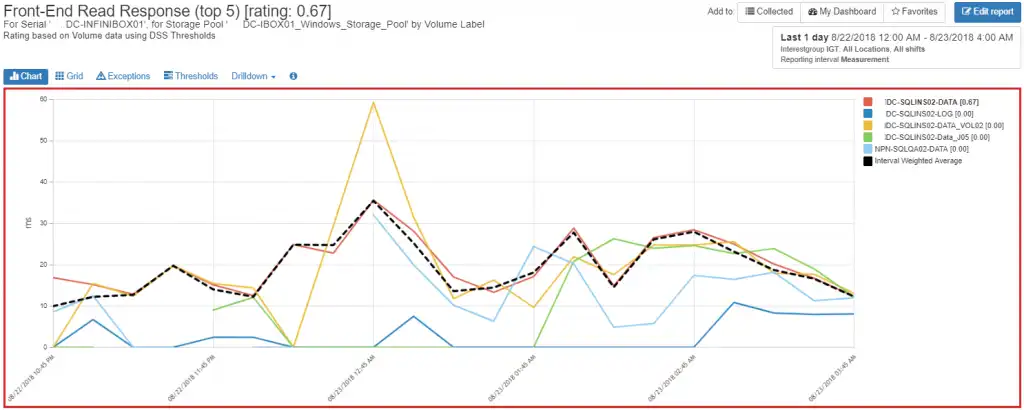
Figure 4 Volume Front-end Read Response Time
Looking at the key to the right of the chart, we can see that the red volume (DC-SQLINS02-DATA) is marked in bold and has a rating of [0.67]. IntelliMagic Vision highlights any rating above 0.30 as a significant performance risk/impact. Also note the red border around the chart, indicating a serious performance risk/impact is likely occurring.
[One factor that affects the risk rating of the chart is the I/O activity. If the I/O activity of a component is low, then the component will not get rated even if it has high response time. This is the case for the yellow line on the chart.]
So why does the DC-SQLINS02-DATA volume have poor read response time? By looking at the volume’s workload we see that it contains a high number of read misses as shown in Figure 5. This is likely due to the workload running at the time.
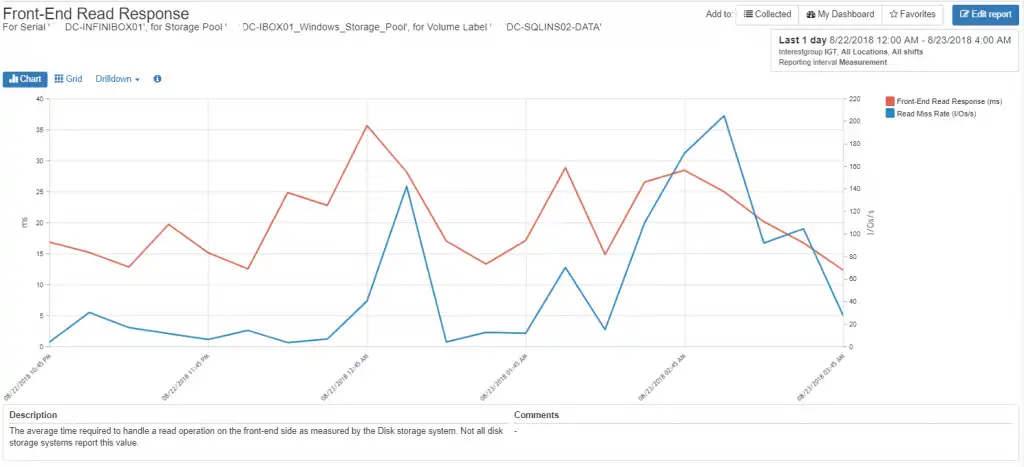
Figure 5 DC-SQLINS02-DATA Read Miss Rate vs Front-end Response Time
Optimizing InfiniBox Performance with Tuning
In the example above, we quickly identified why the front-end read response time was high by drilling down to the individual volume that had the high response time. By assessing the workload, we determined that it was getting low read hits during the analysis period. The read misses resulted in a fairly high response time as the reads had to be retrieved from disk.
There is not likely anything that can be done to improve the performance of this particular workload. To improve the workload’s performance you would need to ensure that the data that was being missed was in the server or storage cache. Consistent low read hit workloads should be examined by the application owners to determine if there are more efficient mechanisms for improving the read access patterns of the data hosted on the volume.
Know Your INFINIDAT Workload
INFINIDAT InfiniBox systems provide excellent performance at a reasonable price – that is why so many people are purchasing them. Even though they are excellent storage arrays for most workloads, there may be cases where the performance for a particular workload does not respond well.
Whether it’s a workload performance issue or SAN fabric or storage port contention, IntelliMagic Vision will highlight the issue and allow you to identify root cause in a few mouse clicks.
This article's author
 Brett Allison
 Share this blog
Related Resources
Should There Be a Sub-Capacity Processor Model in Your Future? | IntelliMagic zAcademy
In this webinar, you'll learn about the shift towards processor cache efficiency and its impact on capacity planning, alongside success stories and insights from industry experts.
Easy Storage Capacity Forecasting and Planning
By utilizing an interactive GUI interface with an advanced AI-based statistical analytics engine, IntelliMagic Vision for SAN provides a simple but powerful means to forecast your storage capacity at multiple levels.
Overcoming Capacity Management Challenges for Accurate Burn Rates and Forecasting
Discover how to overcome capacity management challenges for more accurate capacity forecasting and burn rates.
Request a Free Trial or Schedule a Demo Today
Discuss your technical or sales-related questions with our availability experts today